. 2013 May 17;288(20):14417-14427.
doi: 10.1074/jbc.M112.442970. Epub 2013 Apr 11.

Wedelolactone, a naturally occurring coumestan, enhances interferon-γ signaling through inhibiting STAT1 protein dephosphorylation

Affiliations

Wedelolactone, a naturally occurring coumestan, enhances interferon-γ signaling through inhibiting STAT1 protein dephosphorylation

Zhimin Chen et al. J Biol Chem. .

Abstract

Signal transducers and activators of transcription 1 (STAT1) transduces signals from cytokines and growth factors, particularly IFN-γ, and regulates expression of genes involved in cell survival/death, proliferation, and migration. STAT1 is activated through phosphorylation on its tyrosine 701 by JAKs and is inactivated through dephosphorylation by tyrosine phosphatases. We discovered a natural compound, wedelolactone, that increased IFN-γ signaling by inhibiting STAT1 dephosphorylation and prolonging STAT1 activation through specific inhibition of T-cell protein tyrosine phosphatase (TCPTP), an important tyrosine phosphatase for STAT1 dephosphorylation. More interestingly, wedelolactone inhibited TCPTP through interaction with the C-terminal autoinhibition domain of TCPTP. We also found that wedelolactone synergized with IFN-γ to induce apoptosis of tumor cells. Our data suggest a new target for anticancer or antiproliferation drugs, a new mechanism to regulate PTPs specifically, and a new drug candidate for treating cancer or other proliferation disorders.

Keywords: Cytokines/Interferon; Phosphatase; STAT Transcription Factor; Tumor Suppressor Gene; Tumor Therapy.


Figures

FIGURE 1.
FIGURE 1.
Wedelolactone increased IFN-γ/STAT1-mediated promoter activity. a, p-LUC-HepG2 cells were stimulated with 1000 IU/ml IFN-γ plus vehicle or wedelolactone (Wed) at the indicated concentrations, and luciferase activity was measured following stimulation of IFN-γ for 6 h. The indicated treatment was compared with IFN-γ treatment alone by Student's t test. **, p < 0.01; ***, p < 0.0001. Data are mean ± S.E. of a representative experiment performed in triplicate. b, p-LUC-HepG2 cells were stimulated with 1000 IU/ml IFN-γ plus vehicle or 50 μm wedelolactone, and luciferase activity was measured after stimulation of IFN-γ for the indicated time. Data are mean ± S.E. of a representative experiment performed in triplicate. DMSO, dimethyl sulfoxide. c, HepG2 cells were stimulated with 1000 IU/ml IFN-γ plus vehicle or 50 μm wedelolactone. After the indicated time, cells were harvested for total RNA followed by RT-PCR analysis of three indicated IFN-γ response genes: IP-10, SOCS1, and IL-8. Densitometric quantification of the indicated genes normalized to GAPDH was graphed.
FIGURE 2.
FIGURE 2.
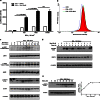
Wedelolactone enhanced IFN-γ/STAT1 signaling by prolonging STAT1 tyrosine phosphorylation. a, p-LUC-HepG2 cells were stimulated with IFN-γ at the indicated concentrations plus vehicle or 50 μm wedelolactone, and luciferase activity was measured following stimulation of IFN-γ for 6 h. Data are mean ± S.E. of a representative experiment performed in triplicate. DMSO, dimethyl sulfoxide; ns, not significant. b, the effects of wedelolactone (Wed) on binding of IFN-γ to its receptors. Suspended HepG2 cells were incubated with FITC-labeled IFN-γ plus vehicle or 50 μm wedelolactone for 60 min, followed by analysis using flow cytometry. c and d, HepG2 cells were stimulated with IFN-γ plus vehicle or 50 μm wedelolactone for various lengths of time (c, 0–120 min; d, 0–8 h) as indicated. Whole cell lysates were processed for Western blot analysis and probed with the indicated antibodies. e, HepG2 cells were stimulated with IFN-γ plus vehicle or wedelolactone at various concentrations as indicated. After 2-hour treatment, whole cell lysates were subjected to Western blot analysis. Densitometric quantification of tyrosine phosphorylated STAT1 normalized to total STAT1 compared with IFN-γ alone was graphed (right panel).
FIGURE 3.
FIGURE 3.
Wedelolactone specifically enhanced IFN-γ signaling. a–c, HepG2 cells were stimulated with IFN-α (a), IL-6 (b), EGF plus vehicle (c), or 50 μm wedelolactone (Wed) for various lengths of time (a, 0–180 min; b, 0–240 min; c, 0–240 min) as indicated. Whole cell lysates were processed for Western blot analysis and probed with the indicated antibodies.
FIGURE 4.
FIGURE 4.
Wedelolactone regulated IFN-γ signaling through inhibiting STAT1 dephosphorylation. a, HepG2 cells were stimulated with 100 IU/ml IFN-γ plus vehicle, wedelolactone (Wed), or vanadate at various concentrations, as indicated, for 30 min, followed by an addition of 150 nm staurosporine. After 30 min of chasing with staurosporine, the whole cell lysates were processed for Western blot analysis and probed with the indicated antibodies. Tyrosine-phosphorylated STAT1 normalized to total STAT1 compared with IFN-γ alone was quantitated densitometrically and graphed (right panel). b, in vitro dephosphorylation of p-STAT1 in cell lysates mixed with wedelolactone at various concentrations as indicated. DMSO, dimethyl sulfoxide. c, HepG2 cells were stimulated with 100 IU/ml IFN-γ plus vehicle or 50 μm wedelolactone for various lengths of time as indicated. The levels of general tyrosine phosphorylation in whole cell lysates were analyzed by Western blot analysis using 4G10 antibody. 500 μm vanadate (Van) served as a positive control. d, whole cell lysates from HepG2 cells were mixed with vanadate or wedelolactone at various concentrations, as indicated, and proceeded to a para-nitrophenyl phosphate in vitro dephosphorylation assay. Data are means ± S.E. of a representative experiment performed in triplicate and analyzed by analysis of variance. ***, p < 0.0001.
FIGURE 5.
FIGURE 5.
Wedelolactone prolonged IFN-γ-induced STAT1 phosphorylation through TCPTP. a, p-LUC-HepG2 cells were mock-transfected or transfected with the TCPTP pMT2 plasmid 24 h before being stimulated with IFN-γ plus vehicle or 50 μm wedelolactone, and luciferase activity was measured following stimulation of IFN-γ for 6 h. IFN-γ plus 500 μm vanadate served as a positive control. Data are mean ± S.E. of a representative experiment performed in triplicate and analyzed by Student's t test. b, p-LUC-HepG2 cells were transfected with control siRNA or TCPTP siRNA 72 h before being stimulated with IFN-γ plus vehicle or 50 μm wedelolactone, and luciferase activity was measured following stimulation of IFN-γ for 6 h. IFN-γ plus 500 μm vanadate served as a positive control. Data are mean ± S.E. of a representative experiment performed in triplicate and analyzed by Student's t test. c, transfection efficiencies in a and b were tested by Western blot analysis using TCPTP antibody. d, HepG2 cells were transfected with control siRNA or TCPTP siRNA 72 h before being stimulated with IFN-γ plus vehicle or 50 μm wedelolactone (Wed) for various lengths of time as indicated. Whole cell lysates were processed for Western blot analysis and probed with the indicated antibodies. IFN-γ plus 250 μm vanadate (Van) served as a positive control. e, wedelolactone was tested for its inhibitory effect on in vitro PTP activity of various PTPs as described under “Experimental Procedures.” Each value is mean ± S.E. of a representative experiment performed in triplicate. LAR, leukocyte antigen-related phosphatase.
FIGURE 6.
FIGURE 6.
Synergistic effect of IFN-γ and wedelolactone in tumor cell viability reduction. a–d, different tumor cell lines were treated with wedelolactone (Wed) alone or together with 1000 IU/ml IFN-γ at various concentrations. After HepG2 cell (24 h) (a); WiDr cell (72 h) (b); A431NS cell (36 h) (c); or 97H cell (72 h) (d) treatment, cells proceeded to an MTT assay. Each value is mean ± S.E. of a representative experiment performed in triplicate. Data were analyzed by Student's t test. The first two columns in each histogram are control cells (unfilled column) and cells treated with IFN-γ only (filled column). ns, not significant. e, 97H cells were stimulated with 100IU/ml IFN-γ or 20 ng/ml IL-6 as indicated. 30 min after stimulation, whole cell lysate of 97H cells was harvested and analyzed by Western blot analysis with the indicated probes.

Similar articles

Cited by

References

    1. Horvath C. M. (2000) STAT proteins and transcriptional responses to extracellular signals. Trends Biochem. Sci. 25, 496–502 - PubMed
    1. Battle T. E., Frank D. A. (2002) The role of STATs in apoptosis. Curr. Mol. Med. 2, 381–392 - PubMed
    1. Stephanou A., Latchman D. S. (2003) STAT-1. A novel regulator of apoptosis. Int. J. Exp. Pathol. 84, 239–244 - PMC - PubMed
    1. Kaplan D. H., Shankaran V., Dighe A. S., Stockert E., Aguet M., Old L. J., Schreiber R. D. (1998) Demonstration of an interferon γ-dependent tumor surveillance system in immunocompetent mice. Proc. Natl. Acad. Sci. U.S.A. 95, 7556–7561 - PMC - PubMed
    1. Bromberg J. F., Horvath C. M., Wen Z., Schreiber R. D., Darnell J. E., Jr. (1996) Transcriptionally active Stat1 is required for the antiproliferative effects of both interferon α and interferon γ. Proc. Natl. Acad. Sci. U.S.A. 93, 7673–7678 - PMC - PubMed

Publication types

LinkOut - more resources