. 2013 Jun;23(6):977-87.
doi: 10.1101/gr.150342.112. Epub 2013 Apr 11.

Roles for transcript leaders in translation and mRNA decay revealed by transcript leader sequencing

Affiliations

Roles for transcript leaders in translation and mRNA decay revealed by transcript leader sequencing

Joshua A Arribere et al. Genome Res. 2013 Jun.

Abstract

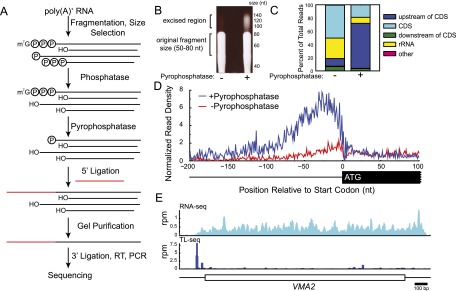
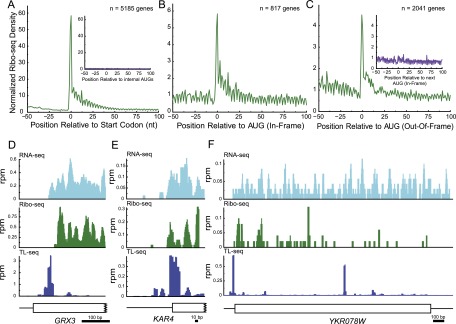
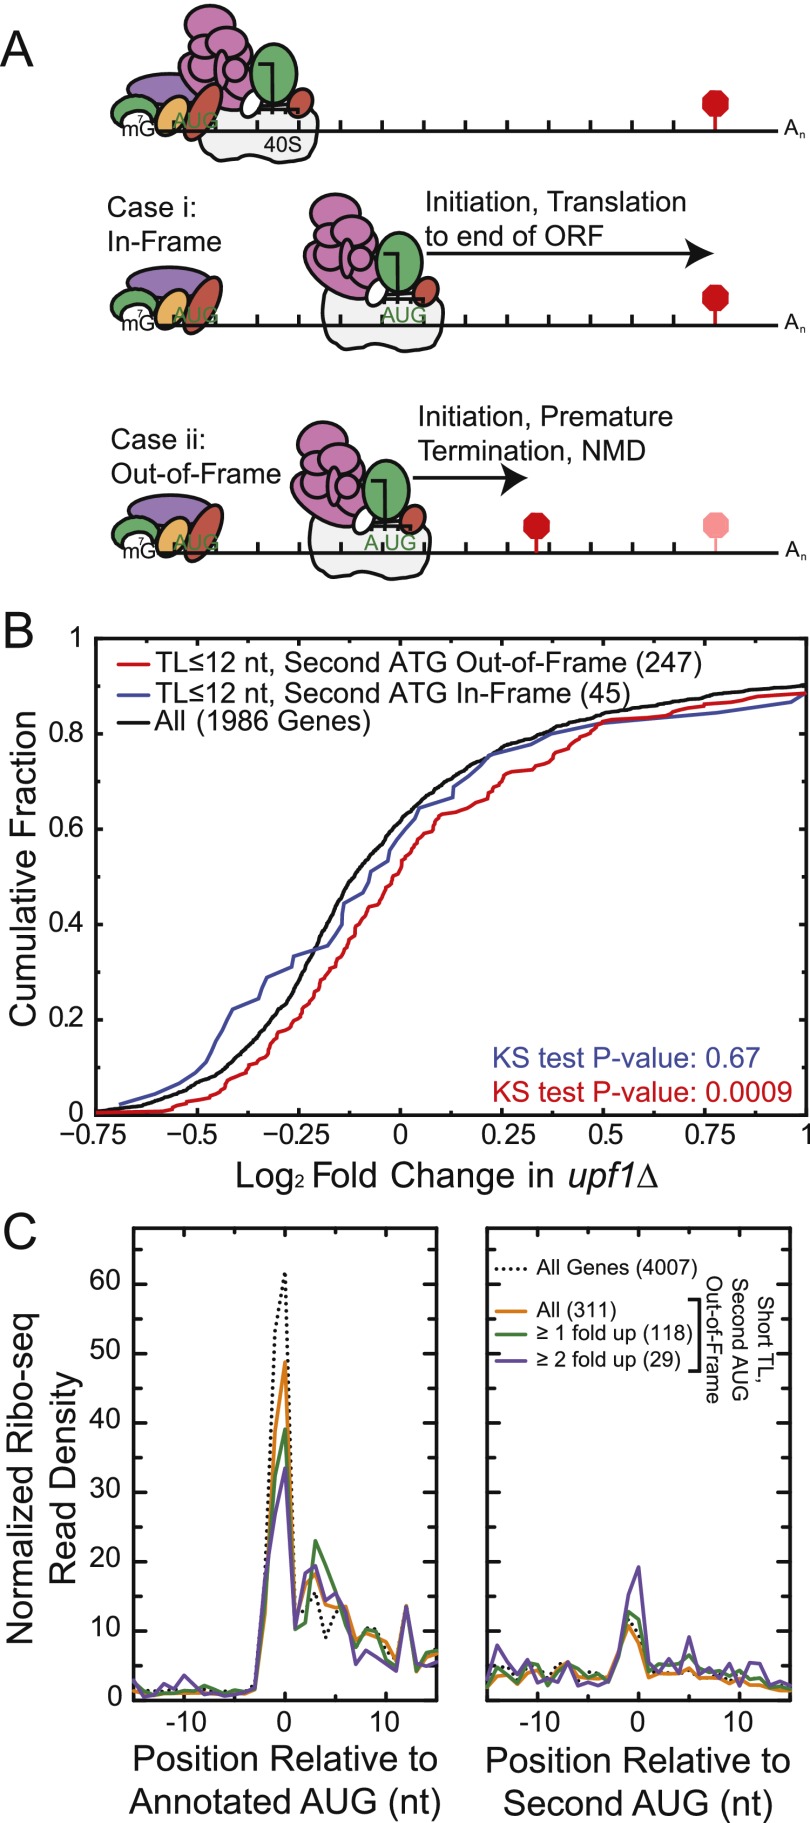
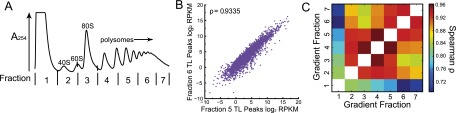
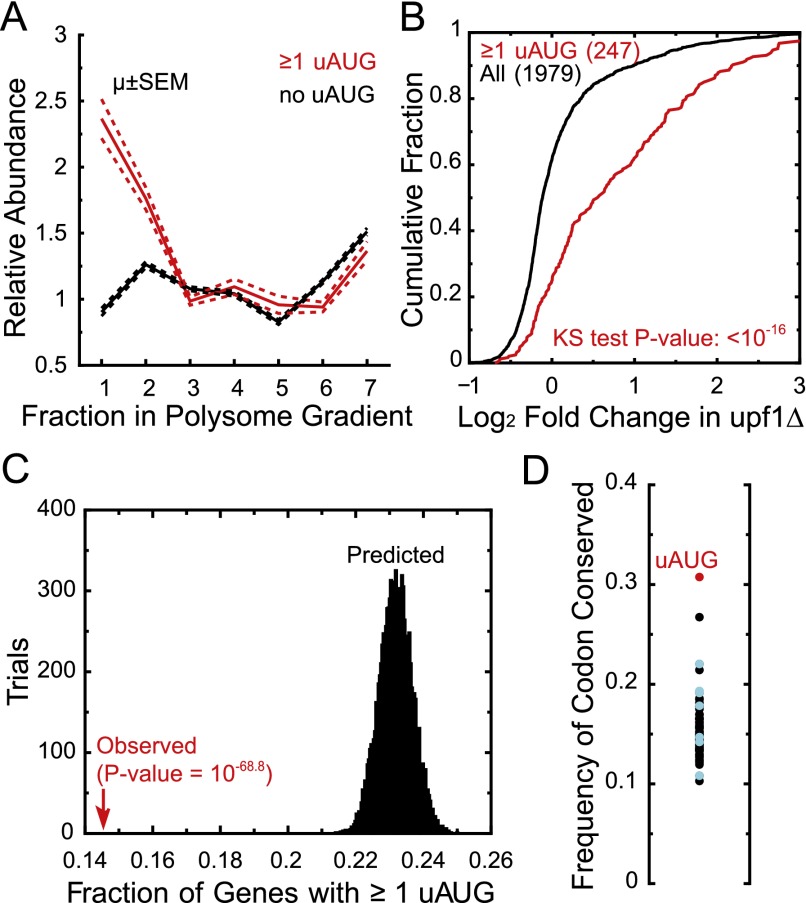
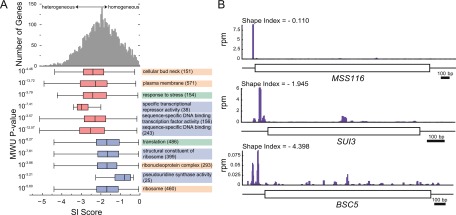
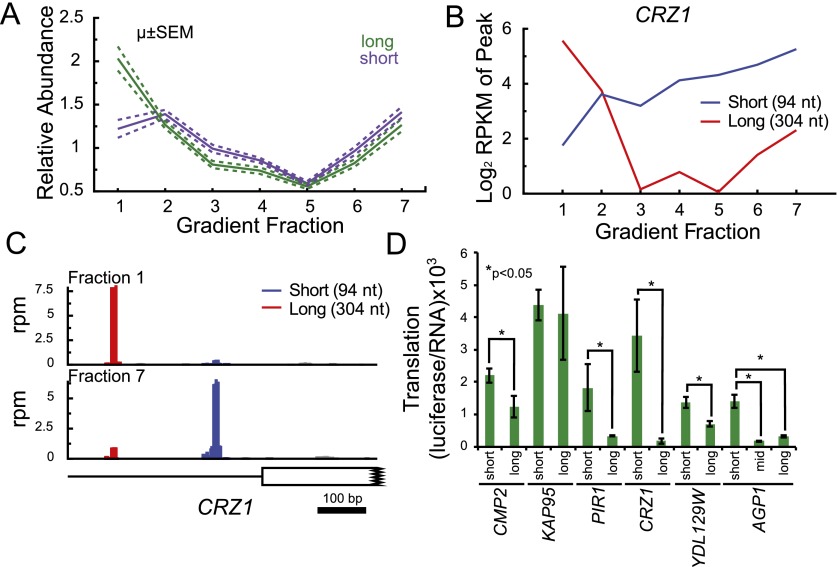
Transcript leaders (TLs) can have profound effects on mRNA translation and stability. To map TL boundaries genome-wide, we developed TL-sequencing (TL-seq), a technique combining enzymatic capture of m(7)G-capped mRNA 5' ends with high-throughput sequencing. TL-seq identified mRNA start sites for the majority of yeast genes and revealed many examples of intragenic TL heterogeneity. Surprisingly, TL-seq identified transcription initiation sites within 6% of protein-coding regions, and these sites were concentrated near the 5' ends of ORFs. Furthermore, ribosome density analysis showed these truncated mRNAs are translated. Translation-associated TL-seq (TATL-seq), which combines TL-seq with polysome fractionation, enabled annotation of TLs, and simultaneously assayed their function in translation. Using TATL-seq to address relationships between TL features and translation of the downstream ORF, we observed that upstream AUGs (uAUGs), and no other upstream codons, were associated with poor translation and nonsense-mediated mRNA decay (NMD). We also identified hundreds of genes with very short TLs, and demonstrated that short TLs were associated with poor translation initiation at the annotated start codon and increased initiation at downstream AUGs. This frequently resulted in out-of-frame translation and subsequent termination at premature termination codons, culminating in NMD of the transcript. Unlike previous approaches, our technique enabled observation of alternative TL variants for hundreds of genes and revealed significant differences in translation in genes with distinct TL isoforms. TL-seq and TATL-seq are useful tools for annotation and functional characterization of TLs, and can be applied to any eukaryotic system to investigate TL-mediated regulation of gene expression.


Figures

Figure 1.
Figure 1.
TL-seq preferentially recovers capped 5′ ends. (A) Schematic of TL-sequencing (TL-seq). (B) Fragmented RNA (50–80 nt) was treated or mock-treated with pyrophosphatase. Subsequently, both reactions were treated with RNA ligase and a 45-nt adaptor. The gel is overexposed to visualize the shift (bracket). Size markers for a DNA ladder are indicated to the right of the gel. (C) Distribution of where 5′ ends of reads map with and without inclusion of pyrophosphatase. (D) Genes were aligned by their annotated translation start codon and the distribution of reads calculated with or without pyrophosphatase. (E) Comparison of RNA-seq and TL-seq profiles for VMA2. Ordinate is in reads per million reads (rpm); scale bar, lower right.
Figure 2.
Figure 2.
Three types of internal transcription start sites (TSSs) identified by TL-seq. (A) Ribosome footprint density aligned relative to annotated start codons for Ribo-seq from glucose-starved yeast. Ribosomes accumulate at initiation AUGs but not internal AUGs (inset). (B) Ribosome footprint density for internal TL genes whose first AUG is in-frame with the annotated start codon. (C) Ribosome footprint density for internal TL genes whose first AUG is out-of-frame with the annotated start codon. (Inset) The first in-frame AUG for these same peaks. (D) Misannotated N termini. RNA-seq, Ribo-seq, and TL-seq support a TSS starting internal to the annotated AUG. (E) N-terminal peak. TL-seq called a TSS just inside of the annotated ORF. RNA-seq and Ribo-seq support such an internal TSS. (F) TL-seq identified a second internal TSS.
Figure 3.
Figure 3.
Short TL genes are enriched for nonsense-mediated mRNA decay (NMD) targets. (A) Model predicting why short TL genes with a second out-of-frame AUG are NMD targets (not to scale). Failure to identify the cap-proximal AUG in short TLs results in scanning and recognition of a second, downstream AUG. If the second AUG is out-of-frame, it results in premature termination and NMD. For simplicity, the eIF4F complex is drawn on the cap during scanning, though some or all of its subunits may remain associated with the small ribosomal subunit (Jackson et al. 2010; Aitken and Lorsch 2012). (B) Fold change in steady-state mRNA levels for short TL genes in upf1Δ cells. Genes with short TLs exhibit a significant shift toward increased RNA levels only when the next AUG encountered is out-of-frame. The number of genes in each group is indicated in parentheses. (C) Ribosome density analysis of genes with a second AUG out-of-frame, using Ribo-seq from glucose-starved yeast. The dotted line shows all genes; solid lines show short TL genes with second AUG out-of-frame. Fold up indicates genes whose mRNAs are increased in the upf1Δ microarray data.
Figure 4.
Figure 4.
Translation-associated TL-seq (TATL-seq) quantifies translation activity of TLs in vivo. (A) TATL-seq was performed on each of seven fractions across a polysome gradient. (B) Peaks were called on the computationally pooled TATL-seq fractions, and then RPKMs were computed for each fraction individually. The Spearman correlation between two gradient fractions is shown. (C) Heatmap of Spearman's ρ for peak abundance in different TATL-seq fractions.
Figure 5.
Figure 5.
uAUGs are an underrepresented and conserved sequence element associated with decreased translation. (A) TATL-seq sedimentation pattern for uAUG-containing and all TLs. Relative abundance (ordinate) is the abundance of a given TL in a fraction divided by its abundance across the entire gradient. (B) Fold change in mRNA steady-state levels for single TL genes, either with uAUG-containing TLs or with all TLs. Numbers in parentheses indicate number of genes. (C) The fraction of uAUG-containing TLs was calculated based on observed TL lengths for single TL genes (red arrow) and 10,000 randomizations of gene-specific TL length (histogram). P-value based on Z-score of the observed value compared to histogram. (D) Conservation of each of 64 possible uNNN trinucleotides in the TL region was calculated using a genome-wide alignment of S. paradoxus, S. mikatae, S. bayanus, and S. cerevisiae and single TL genes. The ordinate is the number of conserved instances over the total occurrences of that trinucleotide. Near-uAUG trinucleotides are highlighted in blue.
Figure 6.
Figure 6.
There is intragenic TL heterogeneity. (A) SI scores of GO categories with 10 or more genes were compared to all genes (top histogram). GO categories with a significantly different SI score distribution (Bonferroni-corrected Mann Whitney U P < 0.001) are shown, with number of genes in parentheses. Box and whisker plots indicate quartiles and range; red/blue shading indicates decreased/increased SI. Shading of GO categories indicates process (green), component (orange), or function (blue). (B) Three examples of genes with different shape index (SI) scores.
Figure 7.
Figure 7.
Intragenic TL heterogeneity leads to different translation behavior in vivo. (A) Average sedimentation pattern for 204 short/long TL pairs. (B) CRZ1 is an example of a gene with multiple TLs showing distinct sedimentation patterns in a polysome gradient. (C) TATL-seq profile of CRZ1 from fractions 1 and 7. (D) TLs are sufficient to confer the translational behavior predicted from TATL-seq (four of six genes). In vivo translation (ordinate) was determined as luciferase activity per unit RNA. Mean and standard deviation of biological triplicates is shown, (*) P < 0.05, Student's t-test.

References

    1. Aitken CE, Lorsch JR 2012. A mechanistic overview of translation initiation in eukaryotes. Nat Struct Mol Biol 19: 568–576 - PubMed
    1. Altschul SF, Erickson BW 1985. Significance of nucleotide sequence alignments: A method for random sequence permutation that preserves dinucleotide and codon usage. Mol Biol Evol 2: 526–538 - PubMed
    1. Arava Y, Wang Y, Storey JD, Liu CL, Brown PO, Herschlag D 2003. Genome-wide analysis of mRNA translation profiles in Saccharomyces cerevisiae. Proc Natl Acad Sci 100: 3889–3894 - PMC - PubMed
    1. Beltzer JP, Chang LF, Hinkkanen AE, Kohlhaw GB 1986. Structure of yeast LEU4. The 5′ flanking region contains features that predict two modes of control and two productive translation starts. J Biol Chem 261: 5160–5167 - PubMed
    1. Calvo SE, Pagliarini DJ, Mootha VK 2009. Upstream open reading frames cause widespread reduction of protein expression and are polymorphic among humans. Proc Natl Acad Sci 106: 7507–7512 - PMC - PubMed

Publication types

Associated data