. 2013 Apr 11;153(2):335-47.
doi: 10.1016/j.cell.2013.03.012.

Exit from pluripotency is gated by intracellular redistribution of the bHLH transcription factor Tfe3

Affiliations

Exit from pluripotency is gated by intracellular redistribution of the bHLH transcription factor Tfe3

Joerg Betschinger et al. Cell. .

Abstract

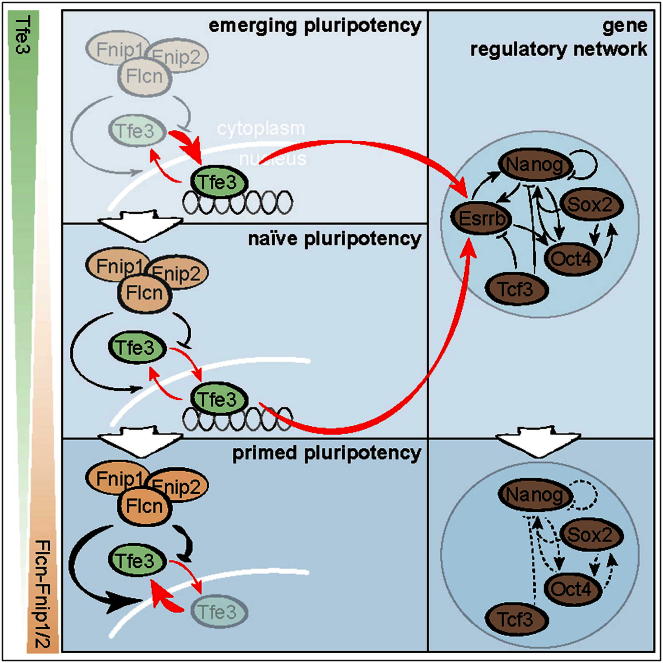
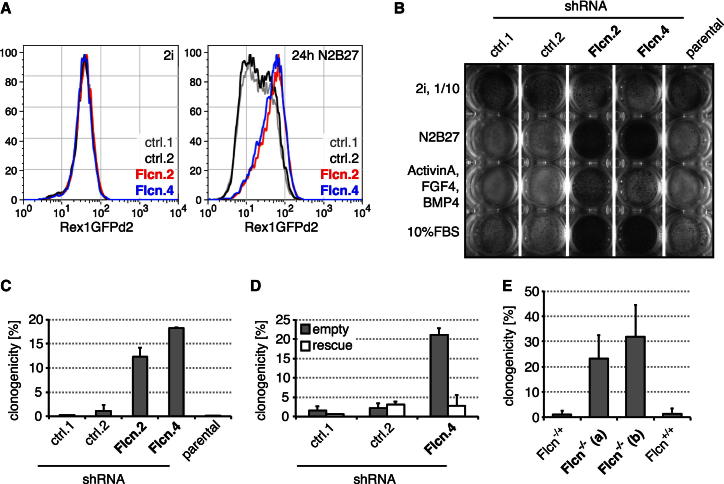
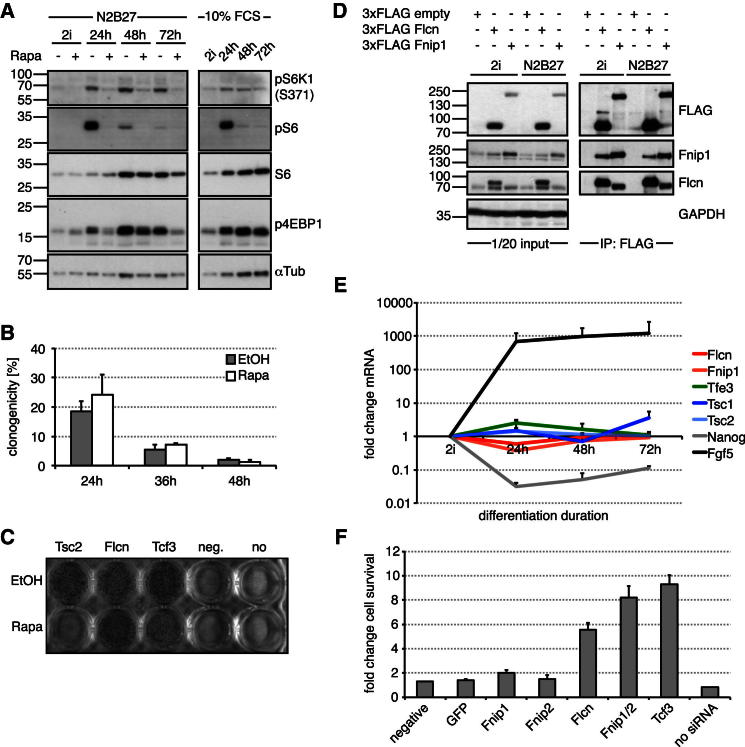
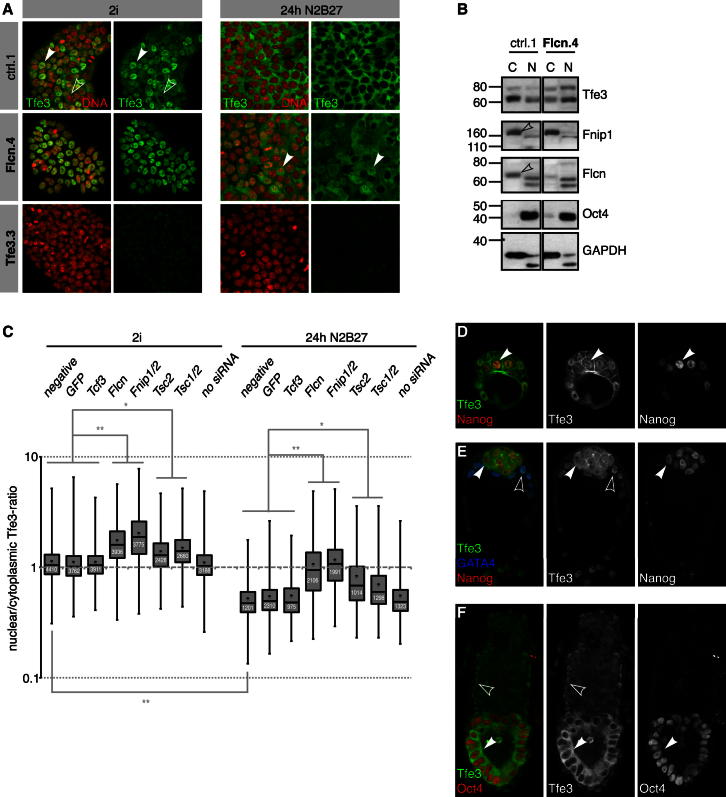
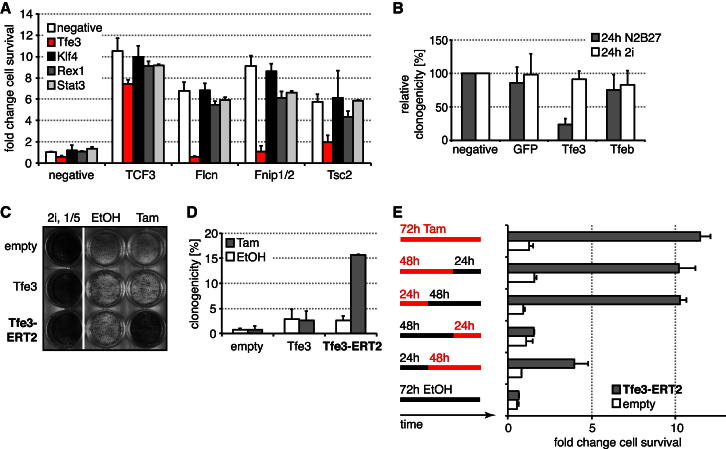
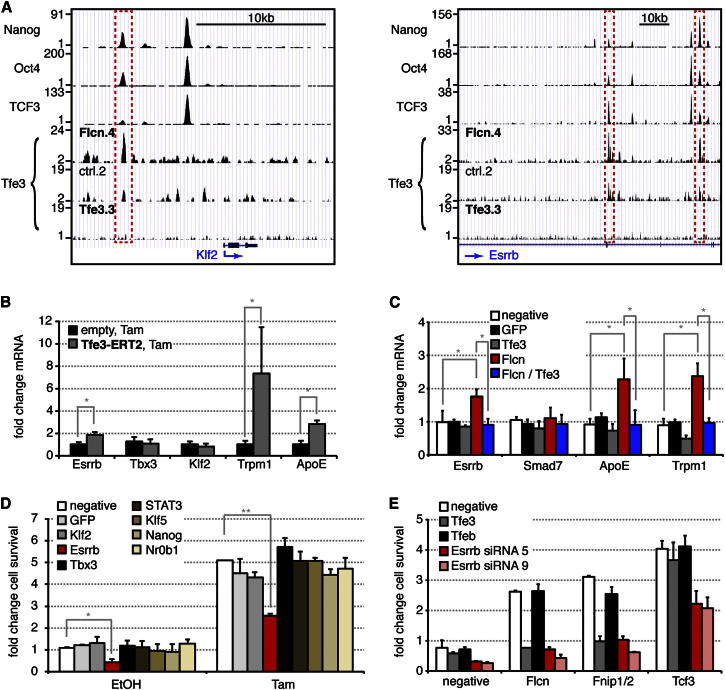
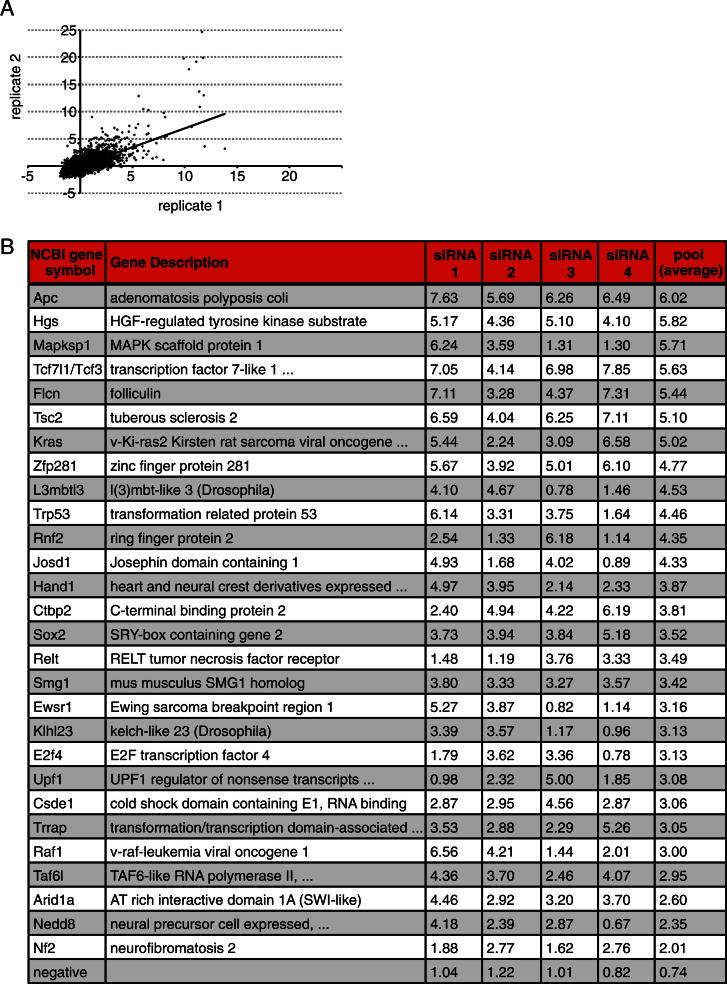
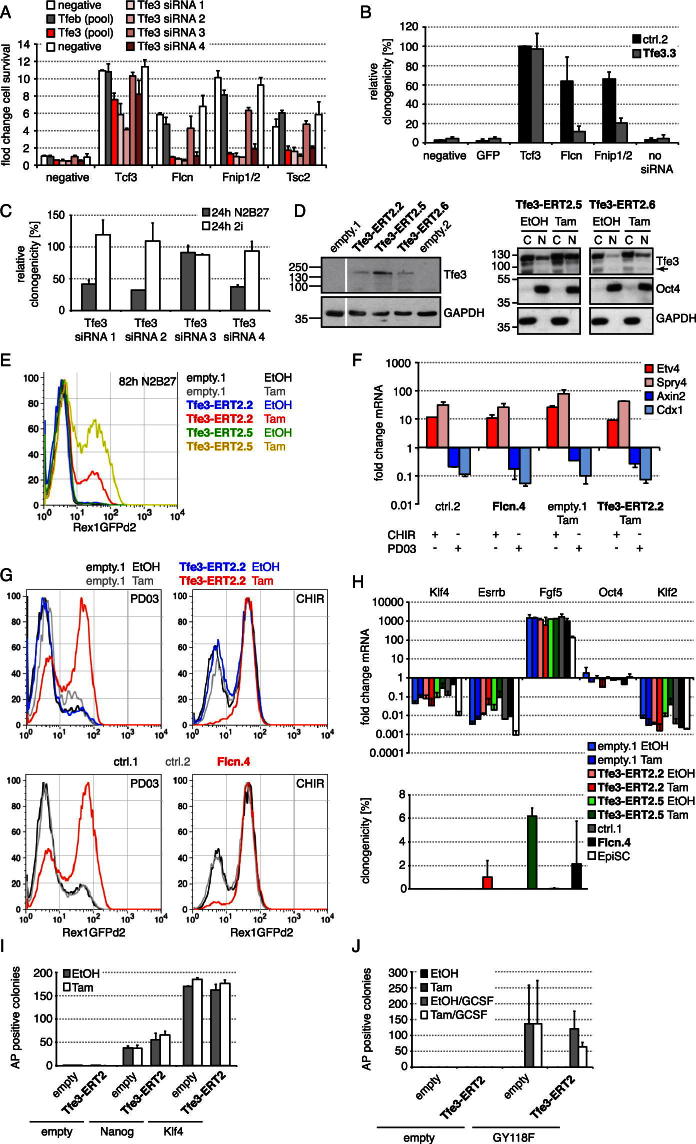
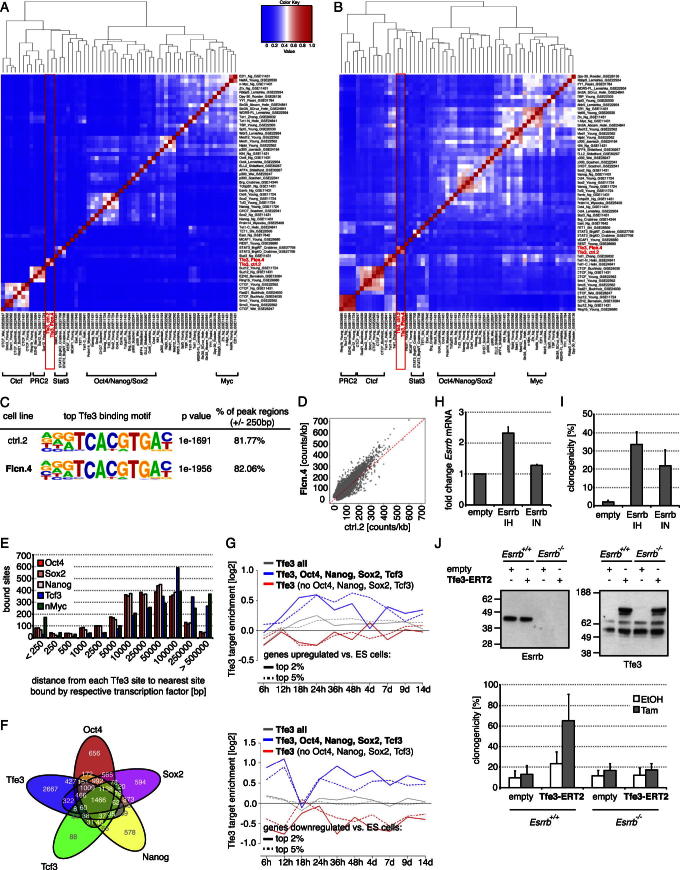
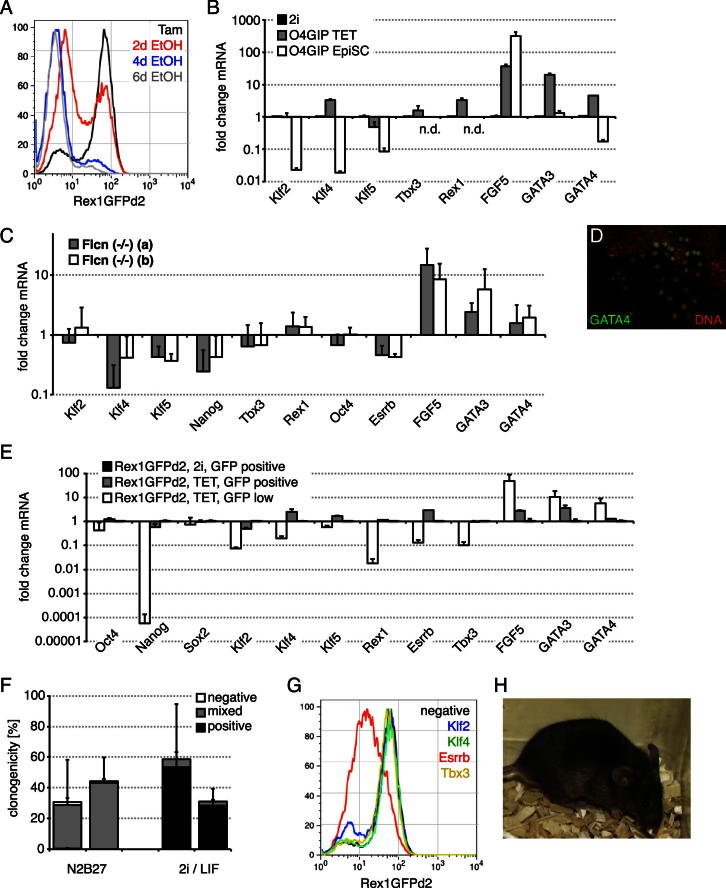
Factors that sustain self-renewal of mouse embryonic stem cells (ESCs) are well described. In contrast, the machinery regulating exit from pluripotency is ill defined. In a large-scale small interfering RNA (siRNA) screen, we found that knockdown of the tumor suppressors Folliculin (Flcn) and Tsc2 prevent ESC commitment. Tsc2 lies upstream of mammalian target of rapamycin (mTOR), whereas Flcn acts downstream and in parallel. Flcn with its interaction partners Fnip1 and Fnip2 drives differentiation by restricting nuclear localization and activity of the bHLH transcription factor Tfe3. Conversely, enforced nuclear Tfe3 enables ESCs to withstand differentiation conditions. Genome-wide location and functional analyses showed that Tfe3 directly integrates into the pluripotency circuitry through transcriptional regulation of Esrrb. These findings identify a cell-intrinsic rheostat for destabilizing ground-state pluripotency to allow lineage commitment. Congruently, stage-specific subcellular relocalization of Tfe3 suggests that Flcn-Fnip1/2 contributes to developmental progression of the pluripotent epiblast in vivo.


Figures

None
Graphical abstract
Figure 1
Figure 1
A Large-Scale siRNA Screen for Genes Regulating ESC Commitment (A) Outline of the screening procedure; O4GIP ESCs were transfected with siRNAs in 2i, differentiation enabled by inhibitor removal, and resistance to commitment assayed by restoring 2i with puromycin selection for Oct4 expression. (B) Exit from pluripotency in differentiating O4GIP ESCs transfected with indicated siRNAs assayed after 24 hr, 48 hr, and 72 hr and stained for AP. (C) Average screen Z scores. Red and green triangles show validated hits (see Figure S1B); gray triangles show duplicates within the transcription factor subset. (D) O4GIP ESC resistance to commitment after transfection with siRNAs was quantified with a cell viability assay and normalized to no siRNA transfection controls. Pools and individual siRNAs are shown. Note that Tsc1 was not recovered in the primary screen. For siRNA pools, the average and standard deviation (SD) of two technical replicates is shown. See also Figure S1.
Figure 2
Figure 2
Flcn Regulates ESC Commitment (A) Flow cytometry profile of Rex1GFPd2 expression in Flcn shRNA knockdown clones (Flcn.2,4) and controls (ctrl.1,2) in 2i conditions (left panel) and after 24 hr of 2i withdrawal (right panel). (B) Flcn shRNA cell lines and controls kept in 2i (10-fold fewer cells) or differentiated for 72 hr in N2B27, or N2B27 supplemented with 10% FBS or 25 ng/ml FGF4, 10 ng/ml BMP4, and 20 ng/ml Activin A, were replated in 2i and selected in blasticidin for Rex1 expression. Resulting ESC colonies were visualized by AP staining. (C and D) Differentiating Flcn shRNA cell lines (C) or Flcn shRNA cell lines expressing an empty vector or shRNA-resistant Flcn transgene (rescue) (D) and respective controls were replated at clonal density, and colonies arising from uncommitted cells stained for AP. Average clonogenicity and SD are relative to number of plated cells of two independent experiments. (E) CreERT2-expressing clones of indicated genotypes were treated with Tam, differentiated for 3 days, and uncommitted cells quantified in 2i/LIF. Average and SD are of at least three independent biological replicates. See also Figure S2.
Figure 3
Figure 3
Flcn Acts downstream of or in Parallel to mTOR and Interacts with Fnip1/2 (A) Rex1GFPd2 cells were differentiated in N2B27 with and without 20 nM Rapa (left panel) or in N2B27/10%FBS (right panel), and cell lysates probed with indicated antibodies. (B) Rex1GFPd2 cells differentiated in N2B27 with and without 20 nM Rapa were replated at single-cell density in 2i including Rex1-expression selection at the indicated time points. The average percentage of uncommitted cells forming AP-positive colonies relative to the number of cells plated and SD are of two technical replicates. (C) Rex1GFPd2 cells transfected with indicated siRNAs were differentiated for 72 hr in N2B27 with and without 20 nM Rapa and replated in 2i with Rex1-expression selection, and resulting colonies were stained for AP. (D) Proteins were immunoprecipitated with FLAG antibodies from stably transfected Rex1GFPd2 cells cultured in 2i or differentiated for 40 hr and probed with indicated antibodies. (E) mRNA levels were quantified during differentiation and normalized to 2i-cultured cells. Average and SD are of two cell lines. (F) O4GIP ESCs were transfected with indicated siRNAs, and after differentiation for 3 days, exit from pluripotency quantified with a cell-viability assay and normalized to no siRNA transfection controls. Average and SD are of two technical replicates. See also Figure S3.
Figure 4
Figure 4
Flcn Regulates Subcellular Localization of Tfe3 (A) Control (ctrl.1), Flcn shRNA (Flcn.4), and Tfe3 shRNA (Tfe3.3) cell lines were stained for Tfe3 and DNA in 2i conditions (left panel) and 24 hr after inhibitor withdrawal (right panel). Tfe3 was detected in the nucleus (arrowhead) and cytoplasm (open arrowhead). (B) Cytoplasmic (C) and nuclear (N) fractions of control and Flcn shRNA cells probed with indicated antibodies (open arrowheads indicate Fnip1 and Flcn bands; both bands recognized by Tfe3 antibodies are specific and likely represent phosphorylation variants; Hong et al., 2010). (C) Box and whisker plots of nuclear/cytoplasmic Tfe3 ratios in ESCs transfected with indicated siRNAs in 2i conditions and 24 hr after inhibitor withdrawal. Indicated cell numbers (white) from three experiments with two ESC lines were quantified. (∗∗) and () indicate Student’s t test values < 1 × 10−100 and 1 × 10−50, respectively. (D–F) Tfe3 is localized to the nucleus (arrowhead) at E3.5 (D). At E4.5, Tfe3 is found in the nucleus and cytoplasm of Nanog-positive epiblast cells (arrowhead) but stays nuclear in GATA4-positive (open arrowhead) primitive endodermal cells (E). At E5.5, Tfe3 is enriched in the cytoplasm (arrowhead) of Oct4-positive epiblast cells and remains nuclear (open arrowhead) in extraembryonic endoderm cells (F). See also Figure S4.
Figure 5
Figure 5
Tfe3 Is Required and Sufficient to Impair ESC Commitment (A) Commitment of O4GIP cells transfected with the indicated siRNA combinations assayed after 72 hr of differentiation by reapplying 2i culture conditions and Oct4-expression selection. Exit from pluripotency was quantified with a cell-viability assay and normalized to negative siRNA treatment. Average and SD are of two technical replicates. (B) Rex1GFPd2 cells were transfected with indicated siRNAs and exposed for 24 hr to the indicated culture conditions, and ESCs were quantified by replating single cells in 2i with Rex1-expression selection. Average clonogenicity relative to negative siRNA and SD are of four independent experiments. (C and D) Rex1GFPd2 cells expressing indicated constructs were differentiated in the absence or presence of 0.1 μM Tam for 100 hr and replated in 2i with Rex1 selection (five times fewer cells were replated for cells kept in 2i), and resulting ESC colonies were visualized with AP (C). Cells differentiated for 72 hr were replated at clonal density, and resulting colonies arising from uncommitted cells stained for AP (D). Average clonogenicity relative to number of plated cells and SD are of two independent experiments. (E) O4GIP ESCs expressing an empty vector or Tfe3-ERT2 were differentiated in the indicated intervals with 0.1 μM Tam and EtOH and switched back to 2i with puromycin selection, and ESCs were quantified with a cell-viability assay. Average fold changes over empty vector control at 72 hr EtOH and SD are from two technical replicates. See also Figure S5.
Figure 6
Figure 6
Genome-wide Tfe3-Target Determination Identifies Esrrb as a Downstream Effector of Flcn-Fnip1/2-Tfe3 (A) Gene tracks of loci identified by Tfe3 ChIP-Seq with control (ctrl.2), Flcn shRNA (Flcn.4), and Tfe3 shRNA (Tfe3.3) cell lines, overlaid with Nanog-, Oct4- and Tcf3-bound regions. (B) ESCs expressing indicated constructs were treated for 3 hr with 0.1 μM Tam in 2i. Average mRNA fold changes relative to EtOH treatment and SD are from two independent experiments with three different cell lines per genotype. () indicates Student’s t test values < 0.005. (C) Average mRNA changes in ESCs transfected with the indicated siRNA combinations. Average relative expression normalized to no and negative siRNA treatments and SD are of three independent experiments. () indicates Student’s t test values < 0.05. (D) O4GIP ESCs expressing Tfe3-ERT2 were transfected with indicated siRNAs, differentiated for 3 days in the presence of 0.1 μM Tam or EtOH, and switched back to 2i with puromycin selection, and remaining ESC colonies were quantified with a cell-viability assay. Average fold changes over negative siRNA-transfected, EtOH-treated cells and SD are from two independent experiments. (∗∗) and () indicate Student’s t test values < 0.001 and 0.03, respectively. (E) Commitment of O4GIP cells transfected with indicated siRNA combinations, including two independent Esrrb siRNAs. Exit from pluripotency was quantified with a cell-viability assay and normalized to negative siRNA treatment. Average and SD are of two technical replicates. See also Figure S6.
Figure 7
Figure 7
Nuclear Tfe3 Maintains an ESC State (A) Tfe3-ERT2-expressing cells differentiated into neurons (arrowhead) in the absence (left panel) but retained undifferentiated morphology and could be serially passaged in the presence of 0.1 μM Tam (right panel). (B) mRNA expression in Rex1GFPd2 and O4GIP TET cells relative to ESCs in 2i conditions. Average and SD are of three independent experiments. (C) mRNA expression in Rex1GFPd2 TET cells after Tam withdrawal relative to presence of Tam. Average and SD are of two technical replicates. (D) Immunohistochemistry in Rex1GFPd2 TET cells treated for 6 days with and without 0.1 μM Tam. (E) TET cells were plated at single-cell density in indicated culture conditions. Resulting colonies were stained for AP (lower panel) and quantified. Average numbers relative to Tam and SD are from two independent experiments (left bar: Rex1GFPd2, right bar: O4GIP). (F) Rex1GFPd2 TET cells were transfected with indicated siRNAs and replated after 2 days at clonal density in the presence of Tam. Average clonogenicity relative to negative siRNA and SD are of two independent experiments. (G) Rex1GFPd2 TET cells stably transfected with a GFP-expressing plasmid were microinjected into blastocysts, and resulting embryos analyzed at E11.5. Widespread contribution was detected in 4/7 embryos. For comparison, a non-GFP-expressing embryo (arrowhead) of the same litter is shown. (H) Passage 8 Rex1GFPd2 TET cells were cultured for 2 days in 2i and injected into C57BL/6 blastocysts. Contribution of the TET cell agouti gene to coat color is visible against black host fur. (I) Schematic representation of the Flcn-Fnip1/2 pathway and combinatorial inputs into Esrrb transcription. (….) denotes additional Tfe3 targets that contribute to self-renewal. See also Figure S7.
Figure S1
Figure S1
Related to Figure 1 (A) Scatter plot of Z scores for the two replicates. Coefficient of determination R2 = 0.483. (B) Validated screen hits. Relative fold increase in cell viability normalized to no siRNA after 72 hr differentiation of O4GIP ESCs transfected with indicated siRNAs. Genes are ranked according to the average of two technical replicates using siRNA pools. An increase greater than 2 is considered to be significant.
Figure S2
Figure S2
Related to Figure 2 (A) Quantification of Flcn mRNA in Flcn shRNA cell lines (Flcn.2,4) relative to control (ctrl.1,2) and parental cells. Average and SD are from two technical replicates. (B) Western blot of Flcn shRNA knockdown clones and corresponding controls probed for Flcn and GAPDH as a loading control. (C) Maintenance of Rex1GFPd2 expression in Flcn shRNA knockdown clones transfected with an empty vector or a plasmid expressing an shRNA-resistant Flcn transgene (rescue) after 25 hr of 2i withdrawal. (D) Maintenance of Rex1GFPd2 expression 24 hr after inhibitor withdrawal upon transfection of indicated siRNAs. (E) Flcn shRNA knockdown clones and controls expressing an empty vector or the rescue transgene were differentiated for 80 hr or kept in 2i, replated in 2i with Rex1-expression selection, and stained for AP. Note: five times fewer cells were plated for the 2i condition. (F) ESCs wild-type, heterozygous, or homozygous for a floxed Flcn allele were stably transfected with CreERT2, and single clones expanded. Cell lines were exposed to 0.1 μM Tam for 48 hr, and cell lysates probed with indicated antibodies. (G) Knockdown efficiencies of utilized siRNAs. ESCs were transfected with indicated siRNAs (GOI: gene of interest), and corresponding mRNA changes calculated relative to negative (or no siRNA) controls. Average and SD are of two technical replicates.
Figure S3
Figure S3
Related to Figure 3 (A) ESCs were transfected with siRNAs overnight, and after 36 hr in indicated culture conditions, cell lysates were probed with specified antibodies. Equal exposures indicate that the increase in S6 phosphorylation during differentiation exceeds the effect of Tsc2 depletion in undifferentiated ESCs. (B) Silver-stained gel of FLAG-IP eluates from ESCs expressing indicated constructs. Bands corresponding to the IP’ed protein are marked with an asterisk. FLAG-Flcn co-IPs Fnip1 (arrowhead) and FLAG-Fnip1 co-IPs a band at the size of Flcn (open arrowhead). No other specific bands are visible compared to empty vector controls. (C) Fold changes of indicated transcript levels in ESCs overexpressing the Flcn-Fnip1 complex (empty, 3xFLAG-Flcn, 3xFLAG-Fnip1), stably knocked down for Tfe3 (empty shRNA [ctrl.2], Tfe3 shRNA [Tfe3.3]) or depleted of mTOR activity by rapamycin (EtOH, Rapa) relative to empty shRNA (ctrl.2). For comparison, two O4GIP EpiSC lines are included. Average and SD are of two independent experiments. (D) ESCs overexpressing the Flcn-Fnip1 complex (empty, 3×FLAG-Flcn, 3×FLAG-Fnip1) were exposed for 24 hr to the indicated culture conditions, and ESCs quantified by replating single cells in 2i with Rex1-expression selection. Average clonogenicity relative to empty vector control and SD are of four independent experiments. (E) Deconvolution of Fnip1/2 siRNA pools. O4GIP ESCs were transfected with indicated siRNAs, and after 3 days of differentiation, exit from pluripotency quantified with a cell-viability assay and normalized to no siRNA transfection controls. Average and SD are of two technical replicates. (F) O4GIP-7 EpiSCs were transfected with indicated siRNAs and differentiated by removal of FGF2 and Activin A for 3 days. After reapplication of EpiSC culture conditions and Oct4-expression selection using puromycin, EpiSCs were visualized by AP activity.
Figure S4
Figure S4
Related to Figure 4 (A) Subcellular Tfe3 localization in wild-type, heterozygous, and homozygous Flcn knockout clones. (B) Box and whisker plots of nuclear/cytoplasmic ratios of ESCs transfected with indicated siRNAs in 2i in the presence and absence of 0.1 μM Rapa. Indicated cell numbers (white) were quantified. (∗∗) and () indicate Student’s t test values < 1 × 10−100 and 1 × 10−25, respectively. Note that absolute values of nuclear/cytoplasmic ratios are different to Figure 4C due to independent experiments and quantitation. (C) Tfe3 localization in O4GIP EpiSCs.
Figure S5
Figure S5
Related to Figure 5 (A) Deconvolution of the Tfe3 siRNA pool. O4GIP ESCs were transfected with indicated siRNA combinations, and after differentiation for 3 days, exit from pluripotency quantified with a cell-viability assay and normalized to negative siRNA transfection. Average and SD are of two technical replicates. (B) Clonogenicity of differentiated Tfe3 shRNA knockdown cells (Tfe3.3) and controls (ctrl.2) transfected with indicated siRNAs and replated into 2i with Rex1-expression selection. To account for transfection efficiency variability, resulting AP-positive clone numbers were normalized to Tcf3 siRNA in control cells. Average and SD are of two independent experiments. (C) Deconvolution of the Tfe3 siRNA pool. Rex1GFPd2 cells were transfected with individual siRNAs and exposed for 24 hr to the indicated culture conditions, and ESCs quantified by replating single cells in 2i with Rex1-expression selection. Average clonogenicity and SD are of two technical replicates relative to negative siRNA-treated controls (Figure 5B). (D) Western blot of Tfe3-ERT2-expressing clones probed with Tfe3 and GAPDH antibodies to control for loading (left panel). Cytoplasmic (C) and nuclear (N) fractions of two Tfe3-ERT2-expressing clones probed with indicated antibodies (right panel). Arrow indicates endogenous Tfe3. (E) Flow cytometry of Rex1GFPd2 expression in Tfe3-ERT2.2 and 5 clones, and empty.1 vector control differentiated in the presence or absence of 0.1 μM Tam for 82 hr. (F) Flcn shRNA knockdown (Flcn.4) and Tfe3-ERT2-expressing ESC clones with respective controls were treated for 6 hr in the presence of PD03 or CHIR only and expression of indicated mRNAs determined. Average relative to the respective genotype maintained for 6 hr in 2i and SD are of two independent experiments. (G) Flow cytometry of Rex1GFPd2 expression in Tfe3-ERT2-expressing (upper panels), Flcn shRNA knockdown cell clones (lower panels) and controls maintained for four passages in PD03 (left panels) or CHIR (right panels). (H) Tfe3-ERT2-expressing clones (empty.1, Tfe3-ERT2.2 and Tfe3-ERT2.5) were culture for three passages in EpiSC conditions with and without Tam. Similarly, Flcn shRNA knockdown clones (ctrl.1 and Flcn.4) were converted for three passages into EpiSC culture conditions. Fold transcript changes relative to parental cells in 2i and SD are from two technical replicates, and for comparison, expression in O4GIP EpiSCs is shown (upper panel). Exit from the ESC state was quantified by replating single cells in 2i with Rex1-expression selection. Average clonogenicity relative to number of plated cells and SD are of three independent experiments (lower panel). (I and J) OEC-2 EpiSCs coexpressing an empty vector (empty) and Tfe3-ERT2 with reprogramming factors (empty, Nanog or Klf4) (I) or a chimeric LIF-receptor (empty, GY118F) (J) were treated for 4 days with 2i conditions in the presence or absence of Tam, and including GCSF to activate the chimeric receptor (J). Cells were then switched to 2i with selection for Oct4 expression, and emerging ESC colonies quantified by AP. Averages and SD are of two independent experiments.
Figure S6
Figure S6
Related to Figure 6 (A and B) Hierarchical clustering of regions (A) and associated genes (B) bound by pluripotency regulators (Martello et al., 2012) and Tfe3 in control (ctrl.2) and Flcn shRNA (Flcn.4) ESCs. Colors indicate correlation levels for pairwise comparisons. Factors have been clustered according to correlation level. Cluster groups are indicated in brackets and Tfe3 in a box. (C) Top de novo motif recognition hit for Tfe3 ChIP in control and Flcn shRNA cell lines. (D) Read counts in peak regions normalized by the size of the peak region/kB in control and Flcn shRNA cells. (E) Distance to the nearest transcription factor for each Tfe3-occupied locus. (F) Venn diagram depicting overlap of genes predicted to be bound by different transcription factors. (G) Enrichment of Tfe3 and Tfe3 together with or exclusive of pluripotency factors at the top 2% or 5% of genes up- (upper panel) or downregulated (lower panel) during ESC differentiation. (H) Overexpression levels of Esrrb mRNA in two ESC lines (Esrrb IH, Esrrb IN) in 2i. Fold change over an empty vector control and SD are of two independent experiments. (I) Exit from the ESC state 80 hr after inhibitor withdrawal was quantified by plating single cells in 2i with Rex1-expression selection. Clonogenicity of indicated genotypes relative to number of cells plated and SD are of three independent experiments. (J) Control and Esrrb knockout cells were stably transfected with empty and Tfe3-ERT2-expressing vectors. Expression levels of Esrrb and Tfe3-ERT2 were visualized by western blotting (upper panel). Exit from the ESC state 5 days after differentiation was quantified in single-cell assays (lower panel). Clonogenicity of indicated genotypes relative to number of cells plated and SD are of five independent experiments. Note that cells were propagated in 2i containing LIF to allow self-renewal of Esrrb knockout ESCs (Martello et al., 2012), which leads to an increased persistence of ESCs during differentiation as compared to ESCs maintained in 2i alone.
Figure S7
Figure S7
Related to Figure 7 (A) Flow cytometry of Rex1GFPd2 TET cells after Tam withdrawal. (B) Expression levels of indicated mRNAs in O4GIP TET and EpiSCs normalized to 2i. Average and SD are from two independent experiments. (n.d.) indicates not detectable. (C) Expression levels of indicated mRNAs in Flcn knockout cells maintained in N2B27 without 2i or LIF normalized to wild-type ESCs in 2i/LIF. Average and SD are of three independent experiments. (D) Immunohistochemistry for GATA4 in Rex1GFPd2 TET cells. (E) Rex1GFPd2 TET cells were sorted for GFP expression and expression of indicated mRNAs determined. Fold changes relative to sorted Rex1GFPd2 ESCs maintained in 2i and SD are from two technical replicates. (F) Flcn knockout cells maintained in N2B27 without 2i or LIF were plated at single-cell density in indicated culture conditions. Resulting colonies were stained for AP and quantified. Average relative to number of plated cells and SD are of three independent experiments (left bar: Flcn (−/−) (a), right bar: Flcn (−/−) (b)). (G) Rex1GPPd2 TET cells were transfected with indicated siRNAs and GFP expression monitored by flow cytometry 2 days after transfection. (H) Passage 8 Rex1GFPd2 TET cells were injected into C57BL/6 blastocysts without 2i preculture. Contribution of the TET cell agouti gene to coat color is visible against black host fur.

Comment in

References

    1. Armah H.B., Parwani A.V. Xp11.2 translocation renal cell carcinoma. Arch. Pathol. Lab. Med. 2010;134:124–129. - PubMed
    1. Baba M., Hong S.B., Sharma N., Warren M.B., Nickerson M.L., Iwamatsu A., Esposito D., Gillette W.K., Hopkins R.F., 3rd, Hartley J.L. Folliculin encoded by the BHD gene interacts with a binding protein, FNIP1, and AMPK, and is involved in AMPK and mTOR signaling. Proc. Natl. Acad. Sci. USA. 2006;103:15552–15557. - PMC - PubMed
    1. Baba M., Keller J.R., Sun H.W., Resch W., Kuchen S., Suh H.C., Hasumi H., Hasumi Y., Kieffer-Kwon K.R., Gonzalez C.G. The folliculin-FNIP1 pathway deleted in human Birt-Hogg-Dubé syndrome is required for murine B-cell development. Blood. 2012;120:1254–1261. - PMC - PubMed
    1. Brannon M., Brown J.D., Bates R., Kimelman D., Moon R.T. XCtBP is a XTcf-3 co-repressor with roles throughout Xenopus development. Development. 1999;126:3159–3170. - PubMed
    1. Brons I.G., Smithers L.E., Trotter M.W., Rugg-Gunn P., Sun B., Chuva de Sousa Lopes S.M., Howlett S.K., Clarkson A., Ahrlund-Richter L., Pedersen R.A., Vallier L. Derivation of pluripotent epiblast stem cells from mammalian embryos. Nature. 2007;448:191–195. - PubMed

Supplemental References

    1. Baba M., Hong S.B., Sharma N., Warren M.B., Nickerson M.L., Iwamatsu A., Esposito D., Gillette W.K., Hopkins R.F., 3rd, Hartley J.L. Folliculin encoded by the BHD gene interacts with a binding protein, FNIP1, and AMPK, and is involved in AMPK and mTOR signaling. Proc. Natl. Acad. Sci. USA. 2006;103:15552–15557. - PMC - PubMed
    1. Chen X., Xu H., Yuan P., Fang F., Huss M., Vega V.B., Wong E., Orlov Y.L., Zhang W., Jiang J. Integration of external signaling pathways with the core transcriptional network in embryonic stem cells. Cell. 2008;133:1106–1117. - PubMed
    1. Guo G., Yang J., Nichols J., Hall J.S., Eyres I., Mansfield W., Smith A. Klf4 reverts developmentally programmed restriction of ground state pluripotency. Development. 2009;136:1063–1069. - PMC - PubMed
    1. Hailesellasse Sene K., Porter C.J., Palidwor G., Perez-Iratxeta C., Muro E.M., Campbell P.A., Rudnicki M.A., Andrade-Navarro M.A. Gene function in early mouse embryonic stem cell differentiation. BMC Genomics. 2007;8:85. - PMC - PubMed
    1. Hasumi Y., Baba M., Ajima R., Hasumi H., Valera V.A., Klein M.E., Haines D.C., Merino M.J., Hong S.B., Yamaguchi T.P. Homozygous loss of BHD causes early embryonic lethality and kidney tumor development with activation of mTORC1 and mTORC2. Proc. Natl. Acad. Sci. USA. 2009;106:18722–18727. - PMC - PubMed

Publication types

MeSH terms

Associated data