. 2013 May 2;12(5):616-28.
doi: 10.1016/j.stem.2013.03.003. Epub 2013 Apr 11.

Integration of genome-wide approaches identifies lncRNAs of adult neural stem cells and their progeny in vivo

Affiliations

Integration of genome-wide approaches identifies lncRNAs of adult neural stem cells and their progeny in vivo

Alexander D Ramos et al. Cell Stem Cell. .

Abstract

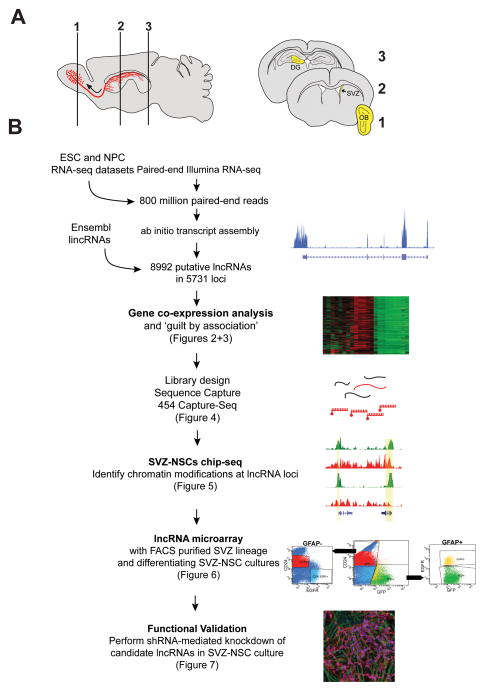
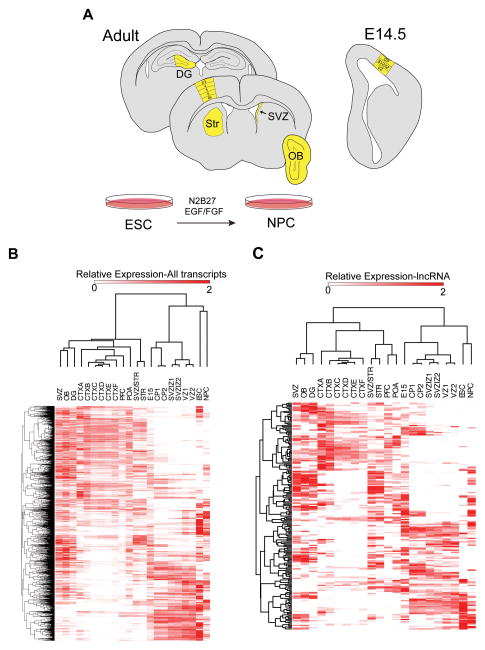
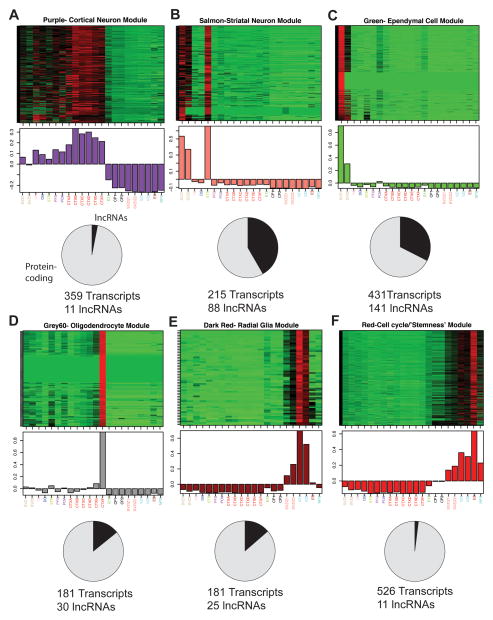
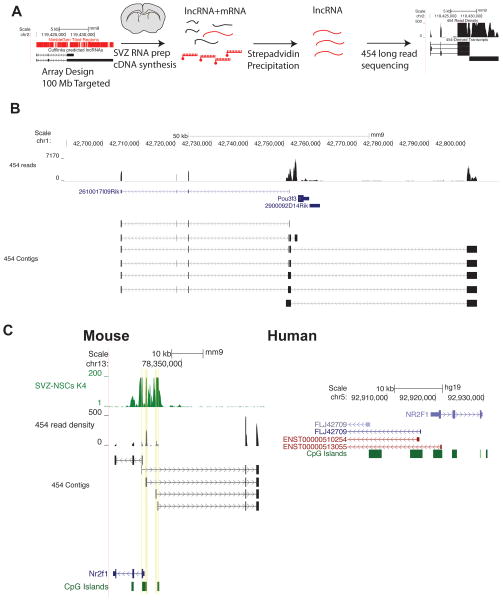
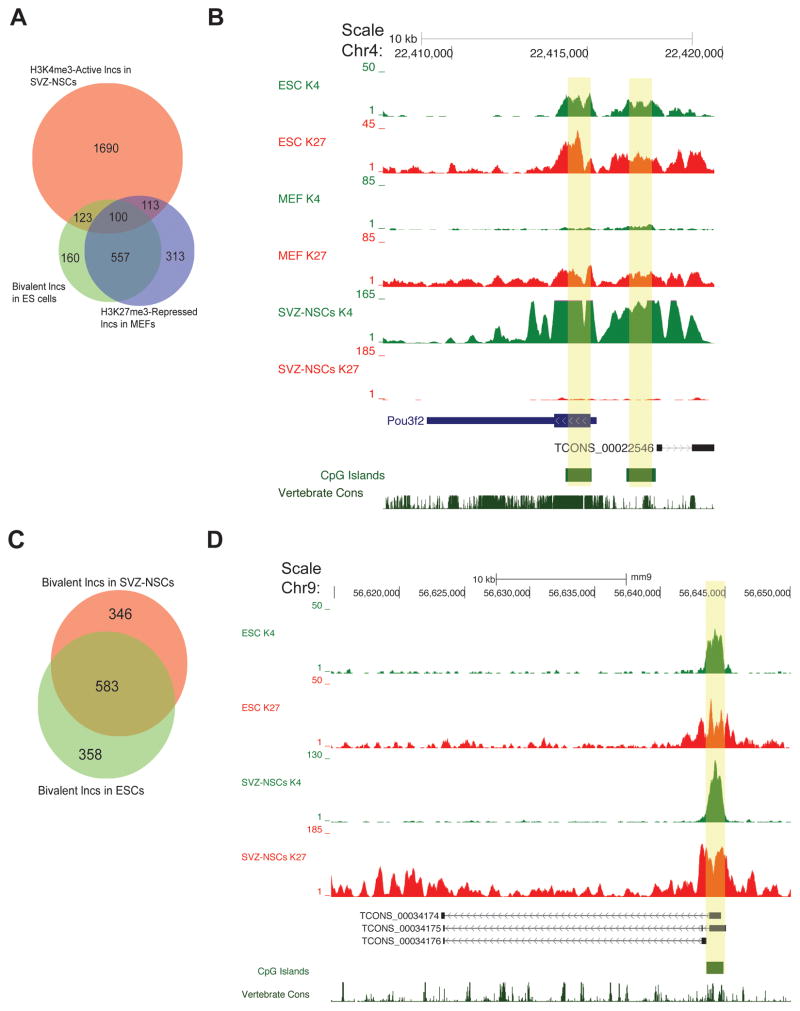
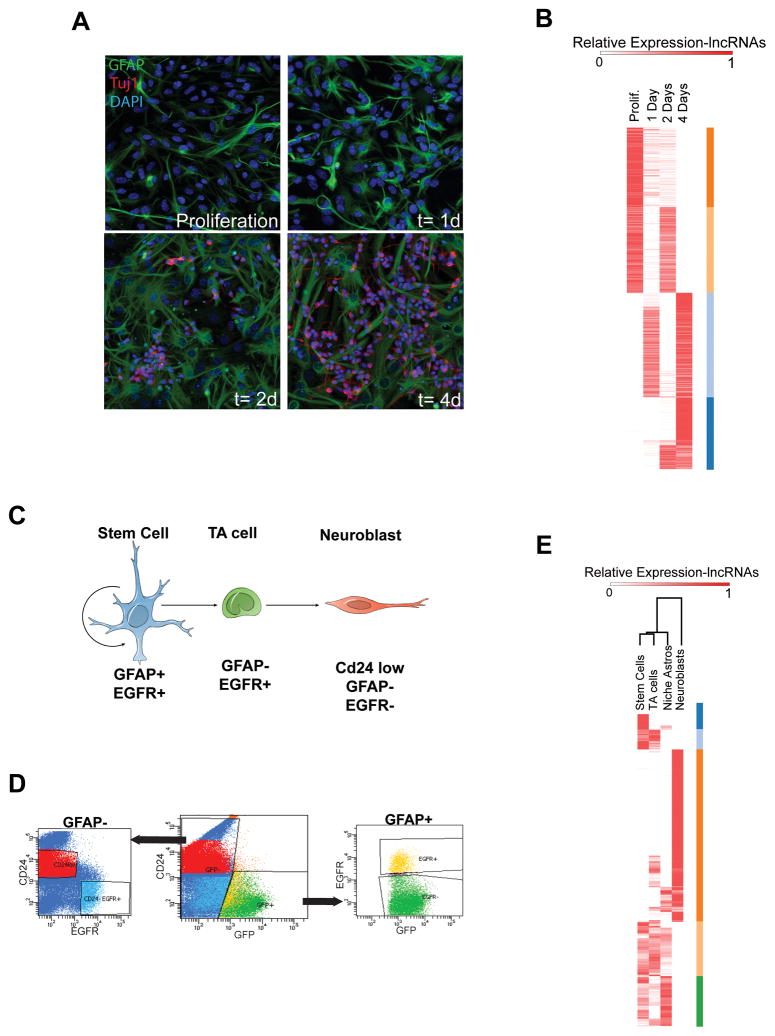
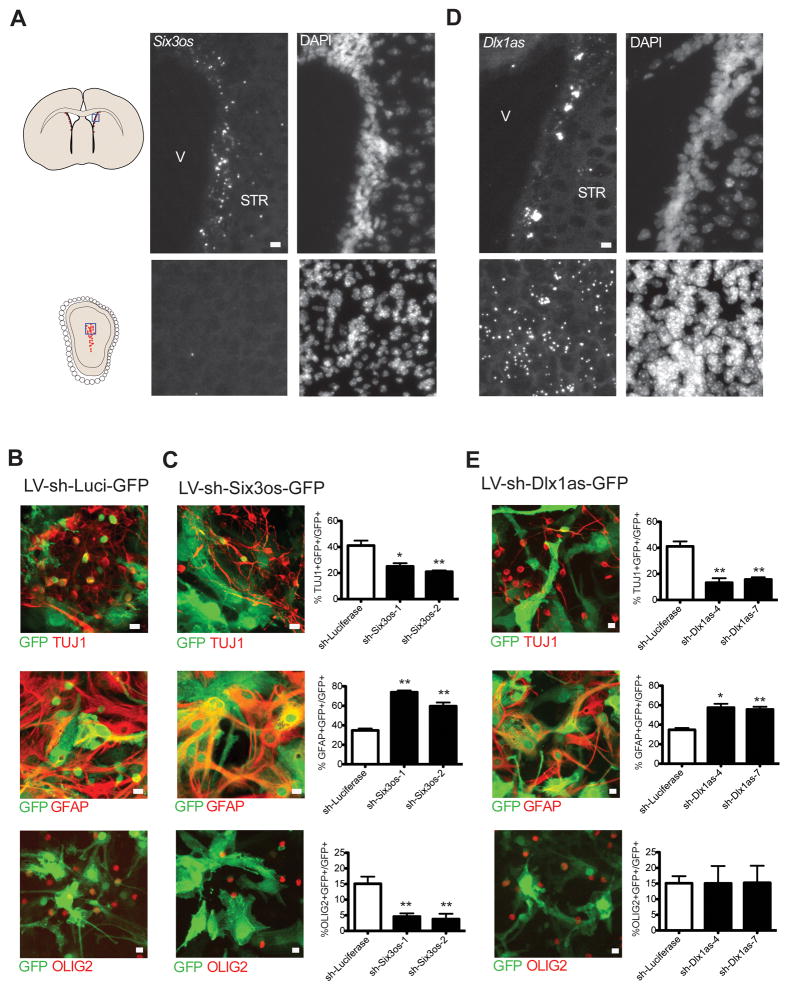
Long noncoding RNAs (lncRNAs) have been described in cell lines and various whole tissues, but lncRNA analysis of development in vivo is limited. Here, we comprehensively analyze lncRNA expression for the adult mouse subventricular zone neural stem cell lineage. We utilize complementary genome-wide techniques including RNA-seq, RNA CaptureSeq, and ChIP-seq to associate specific lncRNAs with neural cell types, developmental processes, and human disease states. By integrating data from chromatin state maps, custom microarrays, and FACS purification of the subventricular zone lineage, we stringently identify lncRNAs with potential roles in adult neurogenesis. shRNA-mediated knockdown of two such lncRNAs, Six3os and Dlx1as, indicate roles for lncRNAs in the glial-neuronal lineage specification of multipotent adult stem cells. Our data and workflow thus provide a uniquely coherent in vivo lncRNA analysis and form the foundation of a user-friendly online resource for the study of lncRNAs in development and disease.


Figures

Figure 1
Figure 1. Outline of lncRNA catalog generation, see also Figure S1 and File S1
(A) Schematic of sagittal section of adult mouse brain. SVZ neural stem cells give rise to migratory neuroblasts (red). These neuroblasts travel along the rostral migratory stream (curved arrow) before terminally differentiating and integrating into olfactory bulb (OB) neuronal circuits. Numbered schematics correspond to coronal brain sections highlighting dissected regions (yellow) used for RNA collection. (B) Workflow for lncRNA catalog construction and characterization.
Figure 2
Figure 2. mRNAs and lncRNAs have temporally and spatially unique expression patterns, see also Figure S2 and File S2
(A) Schematic summarizing regions used for this analysis, colored in yellow. (B) Hierarchical clustering results of all transcripts expressed across all samples. (C) Hierarchical clustering results of lncRNAs expressed across all samples. The Pearson correlation coefficient was used as the distance metric. DG=dentate gyrus, STR=striatum, SVZ=subventricular zone, STR/SVZ=mixed dissection including both SVZ and striatal regions, OB= olfactory bulb, CTXA= cortical dissection, layer 2/3, CTXB= cortical dissection, layer 4, CTXC=cortical dissection, layer 5, CTXD=cortical dissection, layer 5, CTXE= cortical dissection, layer 6, CTXF= cortical dissection, layer 6b. POA= preoptic area, PFC= prefrontal cortex, E15= whole embryonic day 15 brain, VZ= ventricular zone of E 14.5 cortex, SVZ/IZ= subventricular zone/ intermediate zone of E14.5 cortex, CP= cortical plate of E14.5 cortex, ESC= cultured embryonic stem cells, NPCs= ESC-derived neural progenitor cells.
Figure 3
Figure 3. lncRNAs are associated with specific neural cell types and cellular processes, see also Figure S3 and File S3
(A–F) Top: heat maps depicting expression levels for six modules of co-expressed transcripts (rows) in 22 samples (columns) representing various brain regions and cell lines. Samples are labeled as in Fig. 2. Red, increased expression; black, neutral expression; green, decreased expression. Middle: barplots of the values of the module eigengenes (Horvath and Dong, 2008), which correspond to the first principal component obtained by singular value decomposition of each module. Modules were characterized by performing enrichment analysis with known gene sets (See Supplemental File 3 and Supplemental Experimental Procedures). Bottom: pie charts indicating the abundance of lncRNAs within each module. Module members are defined as all transcripts that were positively correlated with the module eigengene at P < 2.61e-08 (Supplemental Experimental Procedures).
Figure 4
Figure 4. RNA CaptureSeq validates SVZ lncRNA expression and reveals multiple isoforms and complex locus structures, see also Figure S4
(A) Schematic of RNA-Capture seq procedure. We used Cufflinlks’ lncRNA assembly to define putative lncRNA loci and designed tiled probe libraries against these loci. The cDNA library was then hybridized to this biotin-labeled probe library, and after purification by streptavidin, the enriched population of lncRNAs was sequenced by 454 (Roche) long-read chemistry. (B) Isotigs assembled at the Pou3f3 locus revealed a distal transcriptional start site for a transcript that can be spliced into known noncoding RNA 2610017I09Rik. (C) CaptureSeq-derived reads correctly assembled known protein-coding gene Nr2f1 and identified 4 distinct TSS’s for a lncRNA transcribed divergently from the Nr2f1 promoter. The syntentic region in human reveals a similar organization of CpG islands and divergent transcriptional start sites for non-coding transcripts. Genes derived from RefSeq are colored purple, genes from Ensembl are red.
Figure 5
Figure 5. lncRNA loci can be bivalent in stem cell populations, see also Figure S5
(A) Venn diagram highlighting lncRNAs that were bivalent in ESCs, monovalent H3K4me3 in SVZ-NSCs, and H3K27me3-repressed (monovalent or bivalent) in MEFs. (B) The Pou3f2 promoter and the promoter (yellow boxes) of a nearby lncRNA demonstrated a similar pattern of histone modifications (bivalent in ESCs, repressed in MEFs, and activated in SVZ-NSCs). (C) Venn diagram demonstrating the number of lncRNAs that were bivalent in both ESCs and SVZ-NSCs. (D) A novel lncRNA locus ~50 kb downstream of protein-coding gene Odf3l1. The promoter was bivalent in both SVZ-NSCs and ESCs.
Figure 6
Figure 6. Analysis of lncRNA expression in the SVZ lineage in vitro and in vivo, see also Figure S6 and File S4
(A) Immunocytochemistry (ICC) of SVZ-NSC differentiation in vitro. In proliferation conditions, the culture is composed of neural precursor cells including GFAP+ (green) NSCs. After growth factor withdrawal, cells in these cultures differentiate into Tuj1+ neuroblasts (red, increasing numbers at 2d and 4d). (B) Heat map representing expression of lncRNAs that were changed > 4 fold from proliferation conditions to 4 d of differentiation. Color bars (orange, peach, light blue, dark blue) at the right represent gene clusters resulting from k-means clustering, k=4, Pearson distance metric. (C) Schematic of the SVZ lineage. GFAP+, EGFR+ stem cells (blue) give rise to transit amplifying (TA, green) cells. These TA cells give rise to Cd24+ low migratory neuroblasts (red). (D) FACS plots for isolation of the SVZ lineage. Cells were dissociated from freshly dissected SVZ tissue from the hGFAP-GFP mouse and stained with EGF conjugated to the A667 fluorophore and a CD24 antibody conjugated to PE. (E) Heatmap of lncRNAs differentially expressed throughout the SVZ lineage in vivo. Genes differentially expressed >2 fold between activated NSCs and neuroblasts were k-means clustered using the Pearson correlation metric, k=5. Color bars at the right (dark blue, light blue, orange, peach, green) represent gene clusters resulting from k-means clustering.
Figure 7
Figure 7. Functional validation of lncRNA candidates, see also Figure S7 and File S5
(A) In situ hybridization (ISH) for Six3os using branched DNA probes. Positive signal is revealed by Fast Red alkaline phosphatase substrates, which appears as highly fluorescent, punctate deposits (left panels); DAPI nuclear counterstain is shown at the right. Blue box in SVZ and OB coronal schematics at left indicate regions shown at right. Scale bars= 10 μm. V=ventricle, STR= striatum. (B) Control (LV-sh-Luci-GFP) lentiviral infections in SVZ-NSC cultures after 7 days of differentiation. Top, immunocytochemistry (ICC) for Tuj1 (red) and GFP (green), Middle, ICC for GFAP (red) and GFP (green), Bottom, ICC for OLIG2 (red) and GFP (green). (C) Analysis of Six3os knockdown in SVZ-NSCs after 7 days of differentiation. Two different constructs were used (sh-Six3os-1, sh-Six3os-2). Top, immunocytochemistry (ICC) for Tuj1 (red) and GFP (green), Middle, ICC for GFAP (red) and GFP (green), Bottom, ICC for OLIG2 (red) and GFP (green) after infection with control vector expressing shRNAs targeting Six3os (LV-sh-Six3os-GFP). Quantification of data is presented at right. Scale bars= 10 μm. Error bars= SEM, 5–6 replicates for control group, 2–3 per experimental group. *p<.05, **p<0.01, compared to sh-Luci, two-tailed t-test. (D) ISH with branched DNA probes for Dlx1as in the SVZ (top) and OB (bottom). Scale bars= 10 μm. V=ventricle, STR= striatum. (E) Analysis of Dlx1as knockdown after 7 days of differentiation. Two unique targeting sequences were used (sh-Dlx1as-4, sh-Dlx1as-7). Top, immunocytochemistry (ICC) for Tuj1 (red) and GFP (green), Middle, ICC for GFAP (red) and GFP (green), Bottom, ICC for OLIG2 (red) and GFP (green). Quantification of of data is presented at right. Scale bars= 10 μm. Error bars= SEM, 5–6 replicates for control group, 3 per experimental group. *p<.05, **p<0.01, compared to sh-Luci, two-tailed t-test.

Comment in

References

    1. Agger K, Cloos PAC, Christensen J, Pasini D, Rose S, Rappsibler J, Issaeva I, Canaani E, Salcini AE, Helin K. UTX and JMJD3 are histone H3K27 demethylases involved in HOX gene regulation and development. Nature. 2007;449:731–734. - PubMed
    1. Ayoub AE, Oh S, Xie Y, Leng J, Cotney J, Dominguez MH, Noonan JP, Rakic P. Transcriptional programs in transient embryonic zones of the cerebral cortex defined by high-resolution mRNA sequencing. Proc Natl Acad Sci. 2011;108:14950–14955. - PMC - PubMed
    1. Belgard TG, Marques AC, Oliver PL, Abaan HO, Sirey TM, Hoerder-Suabedissen A, García-Moreno F, Molnár Z, Margulies EH, Ponting CP. A Transcriptomic Atlas of Mouse Neocortical Layers. Neuron. 2011;71:605–616. - PMC - PubMed
    1. Bernstein BE, Mikkelsen TS, Xie X, Kamal M, Huebert DJ, Cuff J, Fry B, Meissner A, Wernig M, Plath K, et al. A bivalent chromatin structure marks key developmental genes in embryonic stem cells. Cell. 2006;125:315–326. - PubMed
    1. Bertani S, Sauer S, Bolotin E, Sauer F. The Noncoding RNA Mistral Activates Hoxa6 and Hoxa7 Expression and Stem Cell Differentiation by Recruiting MLL1 to Chromatin. Mol Cell. 2011;43:1040–1046. - PMC - PubMed

Publication types

MeSH terms

Associated data