. 2013 Apr 10;78(1):81-93.
doi: 10.1016/j.neuron.2013.02.011.

Imaging patients with psychosis and a mouse model establishes a spreading pattern of hippocampal dysfunction and implicates glutamate as a driver

Affiliations

Imaging patients with psychosis and a mouse model establishes a spreading pattern of hippocampal dysfunction and implicates glutamate as a driver

Scott A Schobel et al. Neuron. .

Abstract

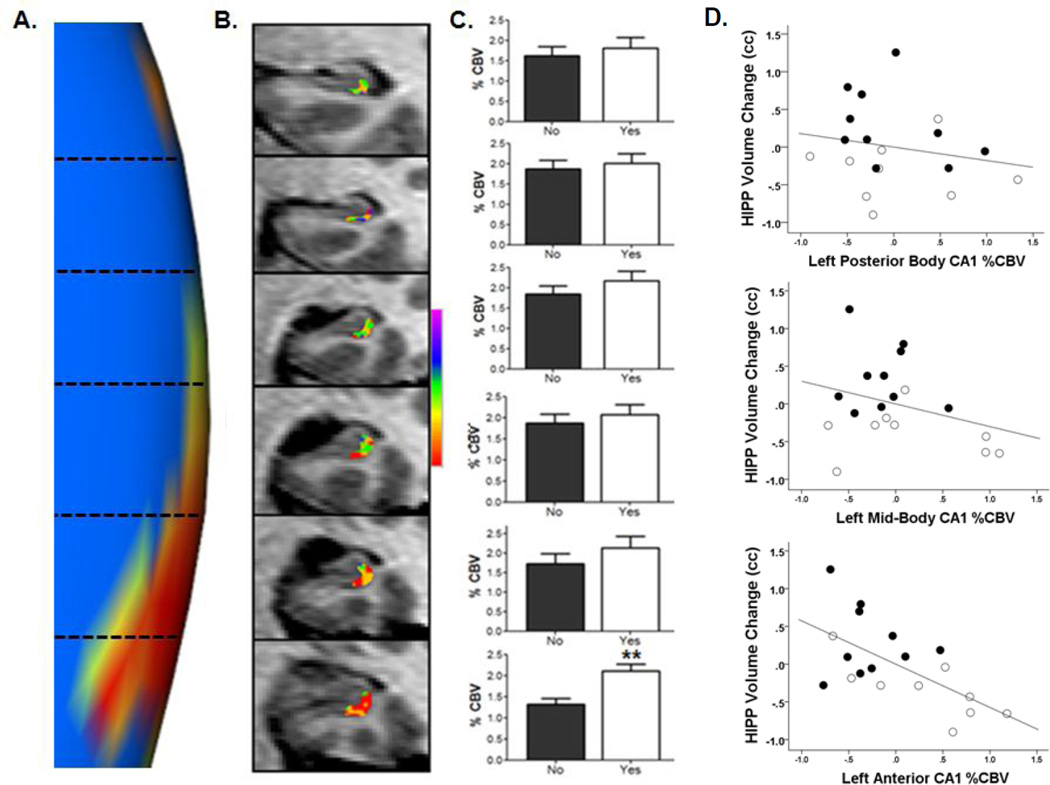
The hippocampus in schizophrenia is characterized by both hypermetabolism and reduced size. It remains unknown whether these abnormalities are mechanistically linked. Here we addressed this question by using MRI tools that can map hippocampal metabolism and structure in patients and mouse models. In at-risk patients, hypermetabolism was found to begin in CA1 and spread to the subiculum after psychosis onset. CA1 hypermetabolism at baseline predicted hippocampal atrophy, which occurred during progression to psychosis, most prominently in similar regions. Next, we used ketamine to model conditions of acute psychosis in mice. Acute ketamine reproduced a similar regional pattern of hypermetabolism, while repeated exposure shifted the hippocampus to a hypermetabolic basal state with concurrent atrophy and pathology in parvalbumin-expressing interneurons. Parallel in vivo experiments using the glutamate-reducing drug LY379268 and direct measurements of extracellular glutamate showed that glutamate drives both neuroimaging abnormalities. These findings show that hippocampal hypermetabolism leads to atrophy in psychotic disorder and suggest glutamate as a pathogenic driver.


Figures

Figure 1
Figure 1. Mapping a spatiotemporal pattern of hippocampal hypermetabolism and atrophy during the emergence of psychosis
(A). Tracking changes in hippocampal cerebral blood volume (%CBV) over time in high-risk subjects who progress to psychosis versus those who do not (‘no psychosis’) shows that CA1 %CBV (upper graph) is increased in progressors at the pre-psychotic baseline stage (‘Time 1’) and remains elevated at the onset of psychosis (‘Time 2’). In the subiculum (SUB) (lower graph), no %CBV differences were observed at baseline (‘Time 1’) but an abnormal increase emerged after the onset of psychosis (‘Time 2’). (B) No changes in whole hippocampal volume between the progressors (‘psychosis’) and nonprogressors (‘no-psychosis’) were observed in the pre-psychotic baseline stage (‘Time 1’) but atrophy was observed after the onset of psychosis (‘Time 2’). (C) Changes in hippocampal morphometric shape over time between the progressors and nonprogressors pinpoints the site of dominant hippocampal volume loss. The right and left hippocampal bodies are shown over the posterior-to-anterior long axis, with warmer colors indicating sites of statistically significant morphometric shape change between the groups over time. A gradient of statistical significance over the long axis is observed, with greatest changes observed in the anterior hippocampal body, in particular in the left CA1 and subiculum. (D) A vector map shows the directionality of morphometric changes between the groups. Arrows pointing inward along the surface of the hippocampal shape indicate negative hippocampal shape change in progressors to psychosis vs. non progressors, with the greatest effects observed bilaterally in the anterior CA1 and subiculum. Arrows that run parallel to the long axis, as shown in the anterior uncus and posterior body indicate a shift in three dimensions of the hippocampal body potentially consistent with either shrinkage or movement of the entire structure in space over time between the groups. See also Tables S1 and S2.
Figure 2
Figure 2. Overlap of anatomical patterns of psychosis-related hypermetabolism and atrophy
(A) Magnified view of Figure 1C, showing the statistical significance p value map of longitudinal left hippocampal body CA1 subfield morphometric shape change between progressors and non-progressors to psychosis. The orientation from posterior (top) to anterior is divided into representative MRI slices along the long-axis of the hippocampal body as indicated by horizontal dotted lines corresponding with frames in Panel B. (B) Color map of %CBV shown for a single participant acquired at baseline 24 months prior to onset of psychotic symptoms. Illustrated are 3mm slices in the hippocampus body from posterior to anterior of the left CA1 subfield; each frame corresponding with levels demarcated by dotted lines in Panel A. The map shows a gradient in this individual in left CA1, with %CBV progressively higher (warmer colors) in anterior sectors. (C) Group-wise data of left anterior CA1 %CBV at baseline, showing differences between patients that subsequently progressed to psychosis (progressors; (“yes”, white bars) versus non-progressors (“no”; black bars). Each bar graph corresponds with the posterior-anterior levels demarcated in Panels A and B. **p< 0.01 peak difference in rCBV in progressors relative to non-progressors. Data are represented as mean ± SEM. (D) The association between baseline left anterior CA1 %CBV and hippocampal (HIPP) volume change. The scatterplots show data averaged from slices 1–6 shown in Panels A–C into two posterior, middle, and anterior slices. There is a negative association between CA1 %CBV and longitudinal hippocampal volume change that becomes progressively stronger across the posterior-anterior axis reaching significance only in the left anterior CA1 (bottom scatterplot; black=non progressors, white=progressors to psychosis). N=19 of the total n=25 cases are represented in the scatterplot, with n=5 lost to brain imaging follow-up, and one case excluded due to MRI artifact preventing calculation of hippocampal CBV throughout the long axis. See also Tables S1 and S2.
Figure 3
Figure 3. Acute ketamine administration in mice recapitulates the psychosis-associated pattern of hippocampal hypermetabolism
Changes in hippocampal relative CBV (rCBV; see Methods for calculation) in anesthetized mice following acute administration of ketamine (30mg/kg) are shown. Compared to saline (black lines), ketamine (red lines) evoked significant increases in CA1 (Panel A) and subiculum rCBV (Panel B), significant at 16min post injection. The EC (Panel C), CA3 (Panel D), and DG (Panel E) showed non-significant increases relative to saline. *p < 0.05 peak difference in rCBV, relative to saline. Data are represented as mean ± SEM.
Figure 4
Figure 4. Repeated ketamine administration recapitulates the psychosis-associated pattern of hippocampal hypermetabolism and atrophy
(A) Repeated intermittent ketamine administration over one month (8mg/kg, 16mg/kg, 32mg/kg vs. saline) led to a metabolic state change in hippocampal rCBV: it dose-dependently led to increases in basal rCBV measured at 48 hours after washout of the drug. Statistically significant increases were observed for the 8 and 16 mg/kg repeated treatments. * p < 0.05, relative to saline treatment. Data are represented as mean ± SEM. (B) Compared to saline control, negative hippocampal volume change was found in mice receiving higher doses of repeated ketamine administration, with the effect asymptoting at 16 mg/kg. ** p < 0.01; *** p < 0.01, relative to saline treatment. (C) Rostral view of morphometric shape change map. Compared to saline control, areas of negative hippocampal volume change were localized in the 16mg/kg group to the left ventral aspects of hippocampal body by morphometric shape analysis; areas of statistically significant volume loss are shown by orange clusters. (D) Average cross-sectional hippocampal area (mm2) as measured in fixed tissue from a subset of mice shown in Panels A–C. Relative to the saline group saline (dark bars), mice receiving repeated ketamine 16 mg/kg (light gray stippled bars) for one month showed areal reductions in the caudoventral aspect of the hippocampus (see main text for anatomical boundaries). * p < 0.05 relative to saline. Data are represented as mean ± SEM. See also Figure S1.
Figure 5
Figure 5. Glutamate mediates the psychosis-associated pattern of hippocampal hypermetabolism induced by acute ketamine administration
(A) As shown by in vivo recording of extracellular glutamate efflux performed under the same conditions as for the imaging shown in Figure 3, acute ketamine administration (30mg/kg) resulted in increases in evoked extracellular glutamate in CA1 and subiculum (SUB), and not in entorhinal cortex (EC) or dentate gyrus (DG). * p < 0.05 relative to EC. (B) The time course of the effect of acute ketamine administration in the CA1 (red line) vs. entorhinal cortex (EC; black line). (C) Pre-treatment with the mGluR2/3 agonist LY379268 (10mg/kg) blocked the evoked extracellular glutamate response within the CA1 subfield. (D) Relative to saline pre-treatment, pre-treatment with mGluR2/3 agonist LY379268 (10mg/kg) blocked the evoked rCBV response, with a trend for also reducing basal rCBV as measured at “Time 0” (prior to the ketamine challenge). Data for panels A–D are represented as mean ± SEM. See also Figure S2.
Figure 6
Figure 6. Hippocampal hypermetabolism and volume loss induced by repeated ketamine administration is ameliorated by a glutamate release inhibitor
(A) rCBV following repeated treatment over one month with ketamine and co-treatment with either saline (red bars) or LY379268 10mg/kg (blue bars). Co-treatment with LY379268 ameliorated the repeated ketamine-induced increase in basal hippocampal rCBV, as evident from comparison with saline pretreatment. The saline/ketamine group is the same as that previously shown in Figure 4. * p < 0.05 relative to saline. (B) LY379268 (10mg/kg) co-treatment during repeated ketamine exposure (blue bars) ameliorated the hippocampal (HIPP) volume loss, as evidenced by significantly preserved (larger) HIPP volume in the LY 379268 (blue symbols) relative to the saline co-treatment group (red symbols). ** p < 0.01 relative to saline/ketamine. (C) Rostral view of morphometric shape change map. Pre-treatment with LY379268 resulted in protection in the CA fields of the hippocampal body as measured by MRI-based morphometric analysis; areas of statistically significant volume protection are shown by orange clusters. (D) Average cross-sectional hippocampal area (mm2) in fixed brains of mice represented in Panels A–C. Volume protection of LY379268 pre-treatment is most evident in the caudoventral aspect of the hippocampus (see main text for anatomical boundaries). *p < 0.05 relative to saline co-treatment ; for all groups, the saline/ketamine group is the same as that represented in Figure 5. Data for panels A, B, and D are represented as mean ± SEM.
Figure 7
Figure 7. The effects of extracellular glutamate on PV+ interneuron density in the repeated ketamine exposure model
(A) Intermittent repeated ketamine exposure resulted in a decrease in the apparent density of PV+ interneurons in hippocampal CA subfields; this effect is attenuated by LY379268 co-treatment. ** p < 0.01 Saline/Ketamine group versus saline control. Data are represented as mean ± SEM. (B) Decreases in PV+ expression (relative the mean of the saline control group) are associated at trend level with increases in basal rCBV measured after one month of repeated treatment with saline only (open symbols), ketamine with saline co-treatment (red symbols) or ketamine with LY379268 co-treatment (blue symbols) (r=.49, p=.06). (C) Across the same treatment groups there is a negative association between post-treatment basal rCBV measured after drug wash-out and the change in hippocampal volumes across the 1-month treatment period (r=.57, p=.006).

Comment in

References

    1. Andreasen NC, Nopoulos P, Magnotta V, Pierson R, Ziebell S, Ho BC. Progressive brain change in schizophrenia: a prospective longitudinal study of first-episode schizophrenia. Biological psychiatry. 2011;70:672–679. - PMC - PubMed
    1. Behrens MM, Ali SS, Dao DN, Lucero J, Shekhtman G, Quick KL, Dugan LL. Ketamine-induced loss of phenotype of fast-spiking interneurons is mediated by NADPH-oxidase. Science. 2007;318:1645–1647. - PubMed
    1. Benes FM. Evidence for altered trisynaptic circuitry in schizophrenic hippocampus. Biological psychiatry. 1999;46:589–599. - PubMed
    1. Benneyworth MA, Roseman AS, Basu AC, Coyle JT. Failure of NMDA receptor hypofunction to induce a pathological reduction in PV-positive GABAergic cell markers. Neuroscience Letters. 2011;488:267–271. - PMC - PubMed
    1. Bickel S, Javitt DC. Neurophysiological and neurochemical animal models of schizophrenia: Focus on glutamate. Behavioural Brain Research. 2009;204:352–362. - PMC - PubMed

Publication types

MeSH terms