. 2013 Apr 25;3(4):1140-52.
doi: 10.1016/j.celrep.2013.03.025. Epub 2013 Apr 11.

Modeling neural crest induction, melanocyte specification, and disease-related pigmentation defects in hESCs and patient-specific iPSCs

Affiliations

Modeling neural crest induction, melanocyte specification, and disease-related pigmentation defects in hESCs and patient-specific iPSCs

Yvonne Mica et al. Cell Rep. .

Abstract

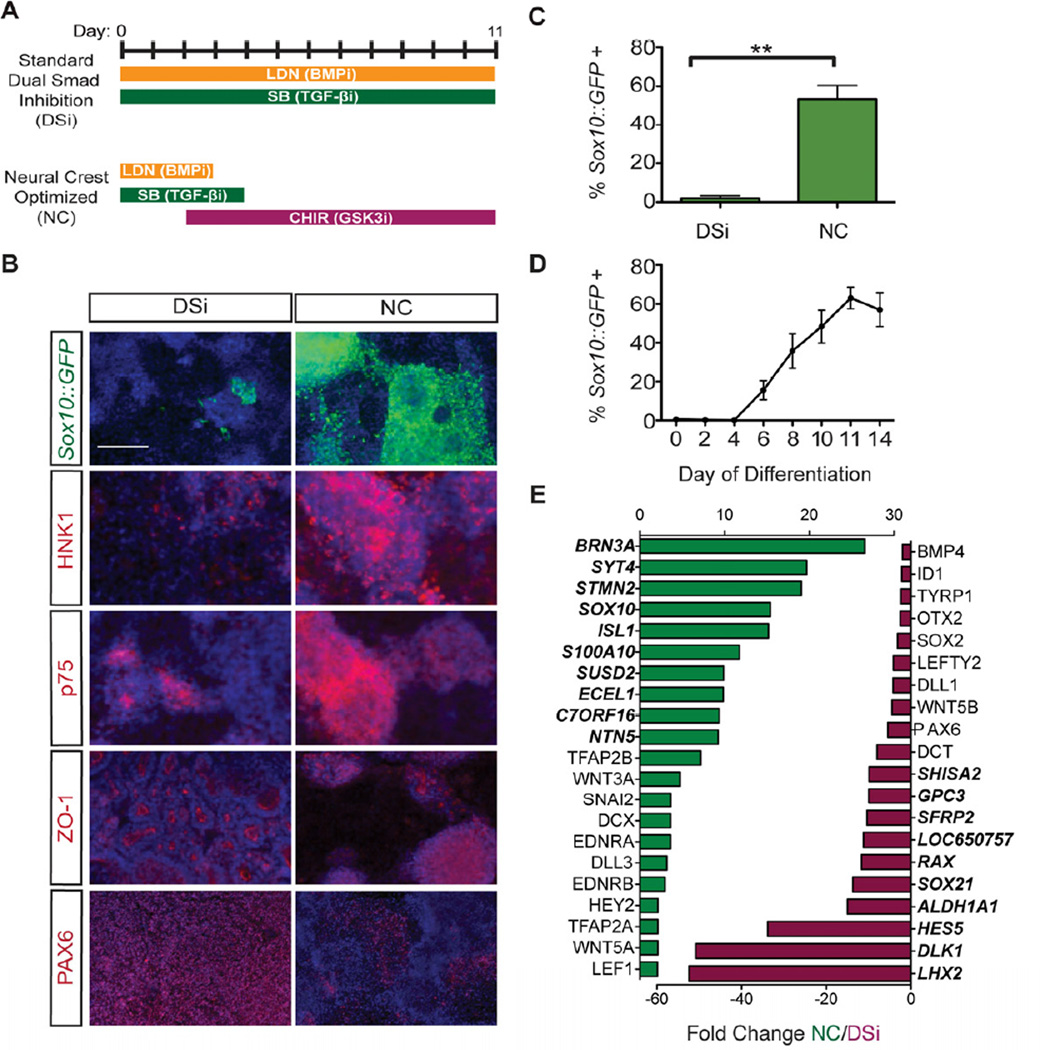
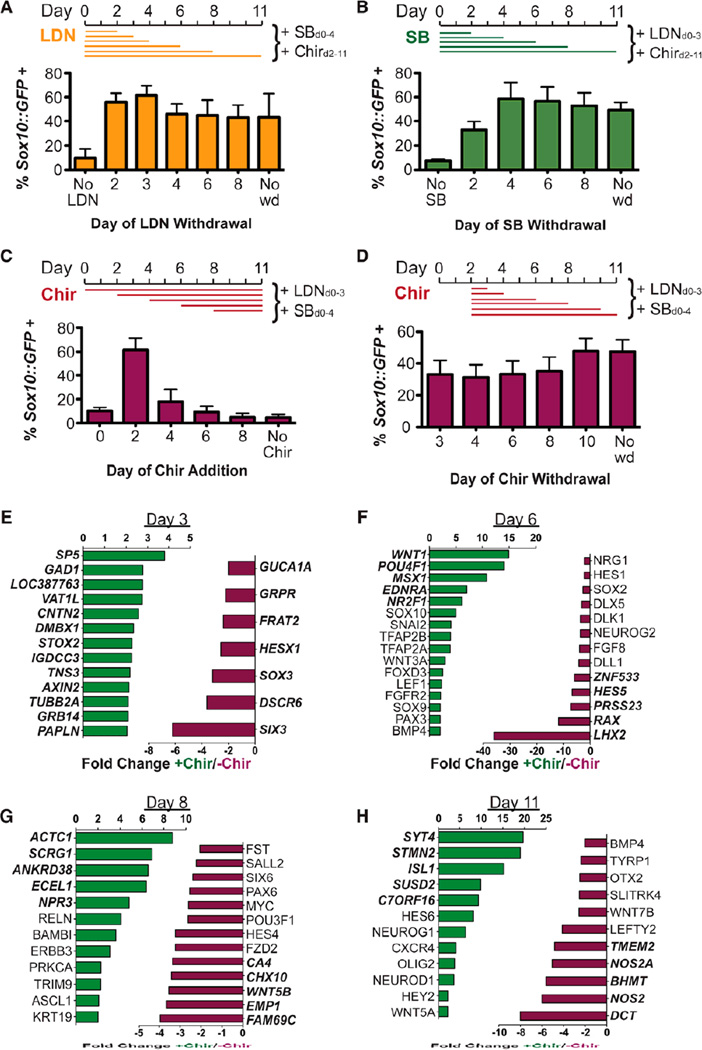
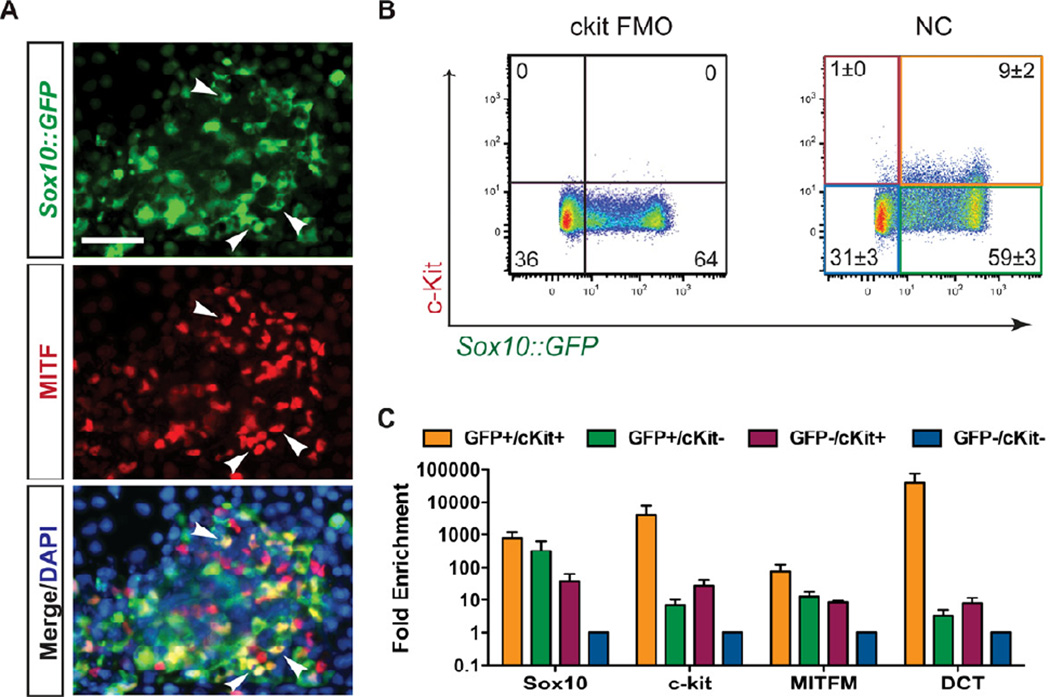
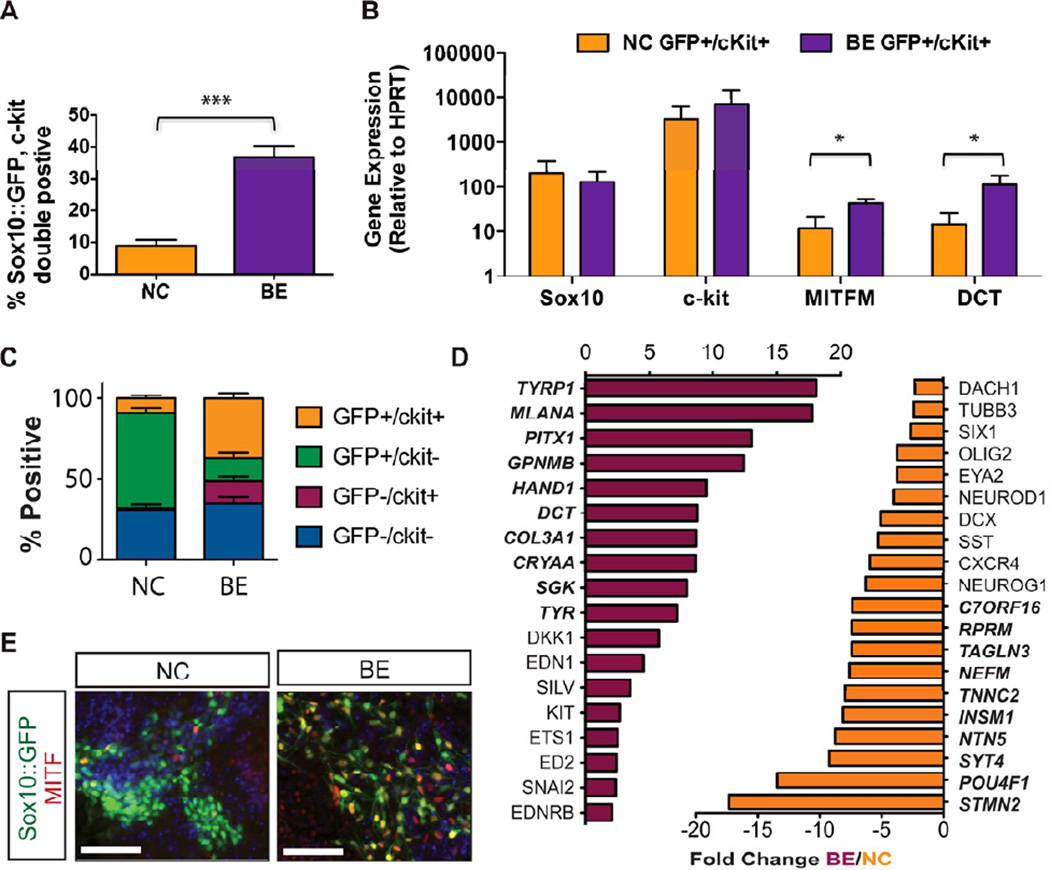
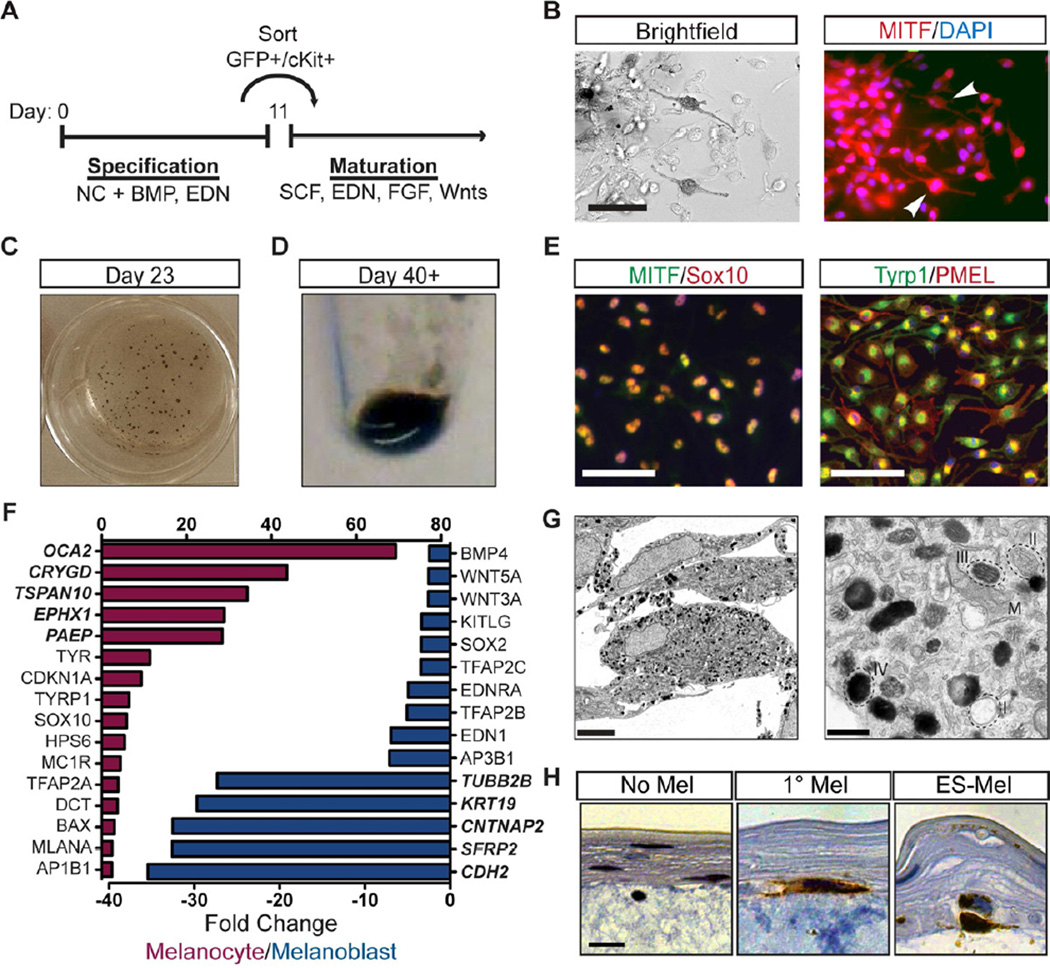
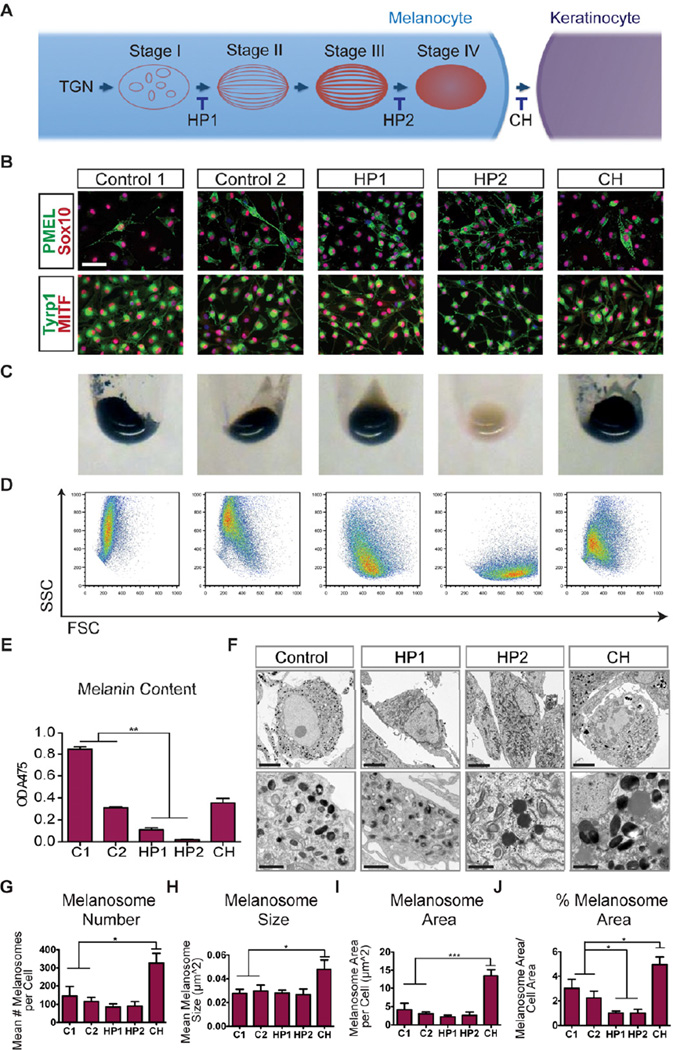
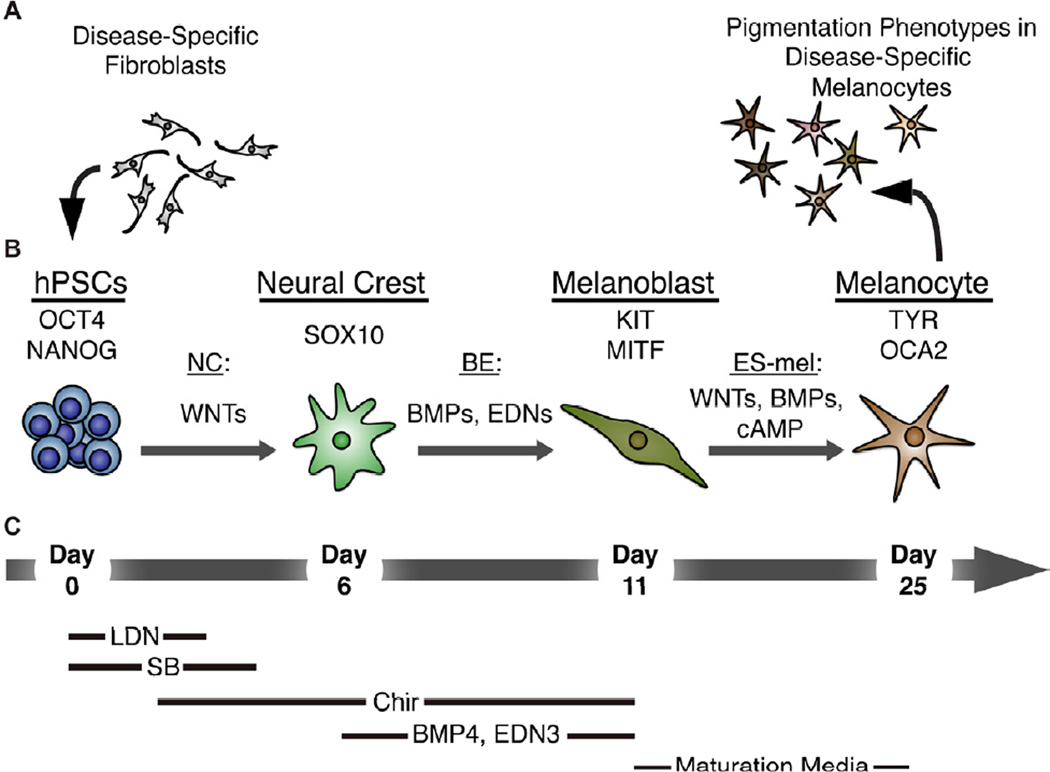
Melanocytes are pigment-producing cells of neural crest (NC) origin that are responsible for protecting the skin against UV irradiation. Pluripotent stem cell (PSC) technology offers a promising approach for studying human melanocyte development and disease. Here, we report that timed exposure to activators of WNT, BMP, and EDN3 signaling triggers the sequential induction of NC and melanocyte precursor fates under dual-SMAD-inhibition conditions. Using a SOX10::GFP human embryonic stem cell (hESC) reporter line, we demonstrate that the temporal onset of WNT activation is particularly critical for human NC induction. Subsequent maturation of hESC-derived melanocytes yields pure populations that match the molecular and functional properties of adult melanocytes. Melanocytes from Hermansky-Pudlak syndrome and Chediak-Higashi syndrome patient-specific induced PSCs (iPSCs) faithfully reproduce the ultrastructural features of disease-associated pigmentation defects. Our data define a highly specific requirement for WNT signaling during NC induction and enable the generation of pure populations of human iPSC-derived melanocytes for faithful modeling of pigmentation disorders.


Figures

Figure 1
Figure 1. Induction and isolation of NC from Sox10::GFP hESCs using a modified dual SMAD inhibition protocol
(A) A dual SMAD inhibition (DSi) protocol can be modified to support highly efficient induction of a neural crest (NC) population by optimizing BMP, TGF-β, and Wnt signaling. (B) NC conditions support induction of a Sox10::GFP expressing population that co-expresses neural crest markers HNK-1 and p75 while down-regulating ZO-1 and PAX6 expressing CNS. Scale bars represent 200µm. (C) NC optimized conditions increase the yield of Sox10::GFP positive cells greater than 20-fold (53% ± 14%, n=4, p=0.002) over the DSi condition. (D) Using FACS analysis, Sox10::GFP was first detected at day 6 of NC differentiation and peaked by day 11. Sox10::GFP induction efficiency is represented as a percentage of total viable cells. (E) Significantly up- (green) and downregulated (red) genes at day 11 in NC-induced cells compared to DSi cells. Bold genes represent top 10 most differentially regulated genes. All error bars represent the s.e.m of at least three independent experiments. ** p<0.01. See also Figures S1 and S2.
Figure 2
Figure 2. Neural crest induction is driven by a narrow window of Wnt activation
BMP inhibitor LDN193189 (LDN, A) and TGF-β inhibitor SB431542 (SB, B) are individually withdrawn at various timepoints within the context of the NC protocol and induction of Sox10::GFP assessed at day 11 by FACS. Treatment with GSK-3β inhibitor CHIR99021 (Chir) is initiated (C) or withdrawn (D) at various timepoints and induction of Sox10::GFP assessed at day 11 by FACS. Sox10::GFP induction efficiency is represented as a percentage of total viable cells. The effects of Chir on gene expression at days 3 (E), 6 (F), 8 (G), and 11 (H) were determined by comparative microarray analysis of NC cells derived in the presence (green) or absence (red) of Chir. Bold genes represent top 5 most differentially regulated genes. All error bars represent the s.e.m of at least three independent experiments. See also Figure S3.
Figure 3
Figure 3. C-kit and Sox10 expression can be used to identify and isolate melanoblasts
(A) Melanocyte progenitors can be identified in day 11 NC protocol-derived populations by coexpression of Sox10::GFP and the melanocyte transcription factor MITF (arrowheads). Scale bar represents 50µm. (B) Flow cytometry reveals the presence of a Sox10::GFP and c-kit co-expressing population. C-kit “fluorescence minus one” (FMO) was used a negative control for c-kit staining. (C) 4-way FACS sorting for Sox10::GFP and c-kit reveals an enrichment of the melanocyte markers MITFM and Dct in the SOX10/ckit double positive population by qRT-PCR. All error bars represent the s.e.m of at least three independent experiments. See also Figure S4.
Figure 4
Figure 4. Treatment with BMP4 and EDN3 enhances melanoblast specification
(A) Additional treatment with BMP4 and EDN3 (BE) beginning at day 6 significantly enhances the yield of Sox10::GFP, c-kit double positive melanocyte progenitors (n=4, p=0.0005). (B) BE-derived melanocyte progenitors express significantly higher levels of MITF and DCT than NC-derived cells by qRT-PCR (n=3, p=0.03(MITF), p=0.05(DCT)). (C) BE treatment increases the yield of Sox10::GFP, c-kit double positive melanocyte progenitors at the expense of Sox10::GFP single positive NC cells. (D) Comparative gene expression analysis identified significantly up- (red) and downregulated (orange) genes at day 11 in BE-induced cells compared to NC cells. Bold genes represent top 10 most differentially regulated genes. (E) BE-derived melanocyte progenitors exhibit spindle-like melanocyte morphology. Scale bars represent 50µm. All error bars represent the s.e.m of at least three independent experiments. * p<0.05. See also Figure S5.
Figure 5
Figure 5. hESC-derived melanoblasts can be matured to a functional, pigmented state
(A) BE-derived melanocyte progenitors can be matured to a pigmented state following culture in media containing SCF, EDN3, FGF2, BMP, cAMP and WNT signaling factors. (B) Pigmented cells expressing MITF can be observed as early as one week after passaging. Scale bar represents 20µm. (C, D) Cells become progressively more pigmented with macroscopic pigmented clusters discernable in tissue culture wells within 3 weeks (C) and cell pellets of 1×10⁶ cells taking on a darkly pigmented phenotype (D). (E) Extended culture supports the propagation of nearly pure populations of mature melanocytes expressing transcription factors SOX10 and MITF and melanosomal markers TYRP1 and PMEL. Scale bar represents 50µm. (F) Mature melanocytes exhibit elevated levels of mature marker expression (red) and downregulation of neural crest and stem cell-associated markers (blue) compared to melanocyte progenitors in gene expression analyses. Bold genes represent top 5 most differentially regulated genes. (G) Numerous pigmented melanosomes, representing all four stages of melanosome maturation (I–IV), are visible in the cytoplasm of ES-derived melanocytes by electron microscopy. Scale bar represents 5µm (left) and 500nm (right). (H) Tyrosinase positive (IHC brown) ES-derived melanocytes home to the basement membrane in organotypic artificial skin reconstructs. Scale bar represents 2µm. No melanocyte negative control – left, primary melanocytes – middle, ES-melanocytes – right. See also Figure S6.
Figure 6
Figure 6. iPS-derived melanocytes recapitulate disease-associated pigmentation defects
(A) Hermansky-Pudlak Syndrome (HP) and Chediak Higashi (CH) Syndrome are disorders with defects in melanosome biogenesis and trafficking amenable for iPS-based disease modeling. (B) Melanocytes derived from patient-specific and control (C1, C2) iPSCs express melanocyte-associated transcription factors and melanosomal proteins. Scale bar represents 50µm. (C) Cell pellets of HP2-derived melanocytes exhibit a near lack of pigmentation while HP1-derived melanocytes exhibit a more subtle defect. (D) Pigmentation levels of patient-specific melanocytes are correlated to granularity (SSC) in flow cytometric analysis. (E) Melanin content was determined from the absorbance of cell lysates at 475nm. (F) HP1- and HP2-associated pigmentation defects can be observed in electron micrographs while CH-derived melanocytes exhibit disease-typical enlarged melanosomes. Scale bars represent 5µm (top row) and 1µm (bottom row). (G–J) Stereological quantification of melanosome phenotype observed in electron micrographs. Error bars represent the s.e.m. from melanocytes derived from three independent iPS lines for each disease (2 lines were derived from donor C2). See also Figure S7.
Figure 7
Figure 7. Disease-specific melanocytes that faithfully recapitulate pigmentation defects can be derived from human pluripotent stem cells using a stepwise differentiation paradigm
(A) Disease specific fibroblasts from HP- and CH- donors were reprogrammed to establish hPSCs. (B) Exposure of Oct4 and Nanog expressing hPSCs to the WNT-activating NC protocol resulted in the emergence of a Sox10-positive NC population by day 6. Subsequent additional treatment with BMP4 and EDN3 (BE) skewed the specification along the melanocytic lineage to allow for the establishment of a melanoblast progenitor population expressing KIT and MITF at day 11. Further maturation under ES-melanocyte (ES-mel) conditions in the presence of WNTs, BMP4, and cAMP supported the induction of late melanocyte markers tyrosinase (TYR) and oculocutaneous albinism II (OCA2). Mature melanocytes were used to model the disease-specific pigmentation defects of HP and CH. (C) Growth conditions supporting each stage of differentiation are summarized below.

Similar articles

Cited by

References

    1. Adameyko I, Lallemend F, Aquino JB, Pereira JA, Topilko P, Müller T, Fritz N, Beljajeva A, Mochii M, Liste I, et al. Schwann cell precursors from nerve innervation are a cellular origin of melanocytes in skin. Cell. 2009;139:366–379. - PubMed
    1. Baynash AG, Hosoda K, Giaid A, Richardson JA, Emoto N, Hammer RE, Yanagisawa M. Interaction of endothelin-3 with endothelin-B receptor is essential for development of epidermal melanocytes and enteric neurons. Cell. 1994;79:1277–1285. - PubMed
    1. Betters E, Liu Y, Kjaeldgaard A, Sundström E, García-Castro MI. Analysis of early human neural crest development. Developmental biology. 2010;344:578–592. - PMC - PubMed
    1. Braun MM, Etheridge A, Bernard A, Robertson CP, Roelink H. Wnt signaling is required at distinct stages of development for the induction of the posterior forebrain. Development. 2003;130:5579–5587. - PubMed
    1. Bronner-Fraser M. Analysis of the early stages of trunk neural crest migration in avian embryos using monoclonal antibody HNK-1. Developmental biology. 1986;115:44–55. - PubMed

Publication types

MeSH terms

Associated data