. 2013 Apr 22;23(8):710-6.
doi: 10.1016/j.cub.2013.03.031. Epub 2013 Apr 11.

Variation in the dorsal gradient distribution is a source for modified scaling of germ layers in Drosophila

Affiliations

Variation in the dorsal gradient distribution is a source for modified scaling of germ layers in Drosophila

Juan Sebastian Chahda et al. Curr Biol. .

Abstract

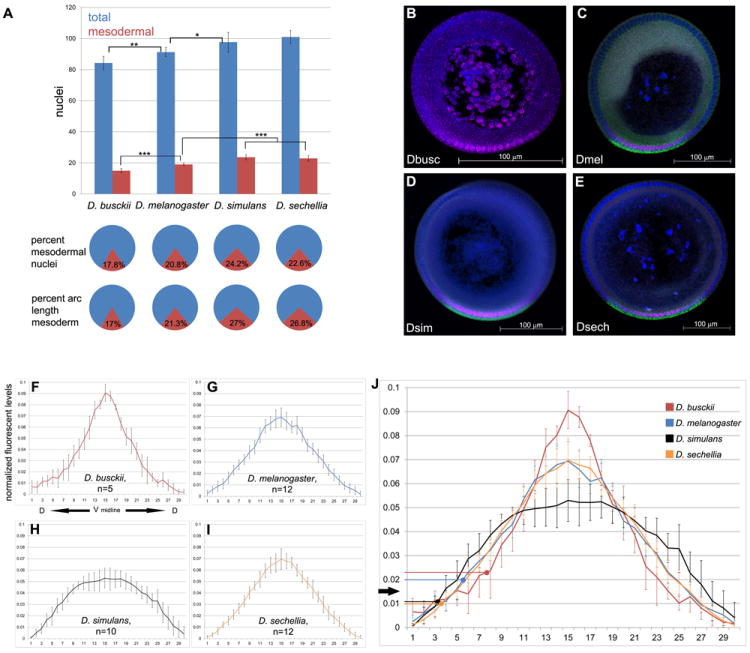
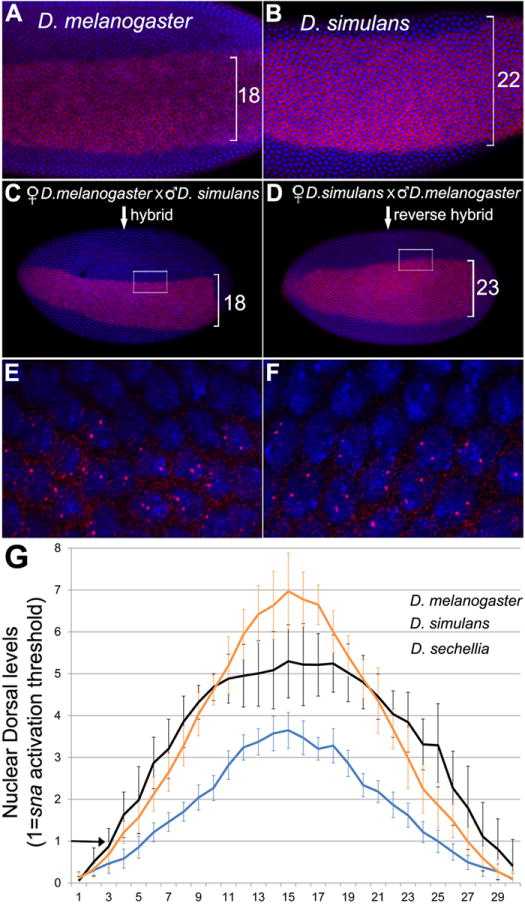
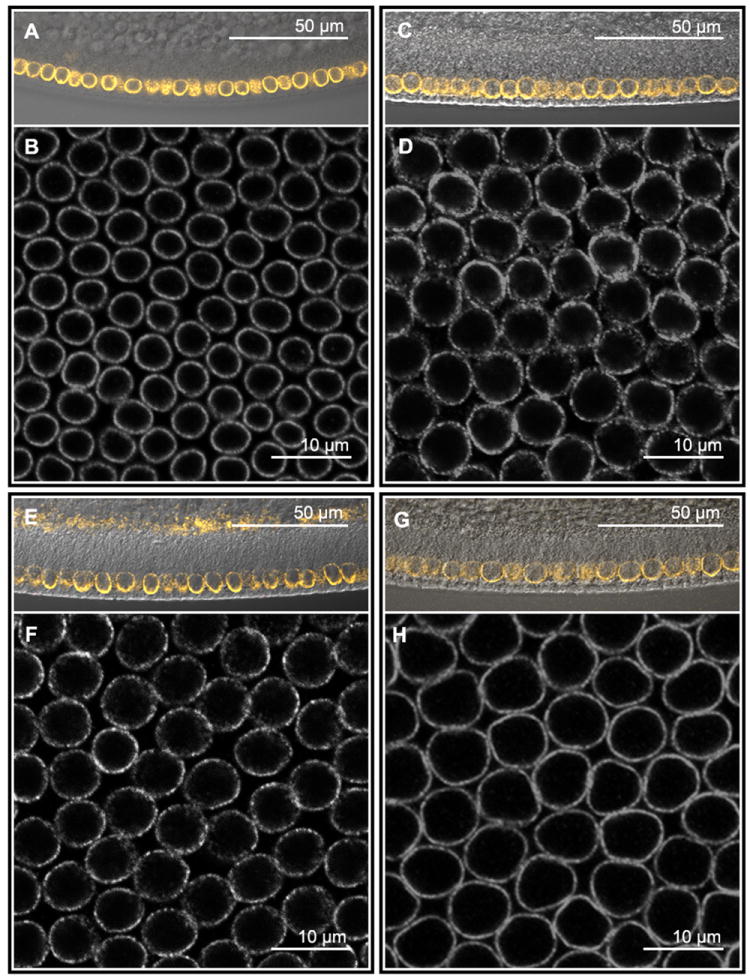
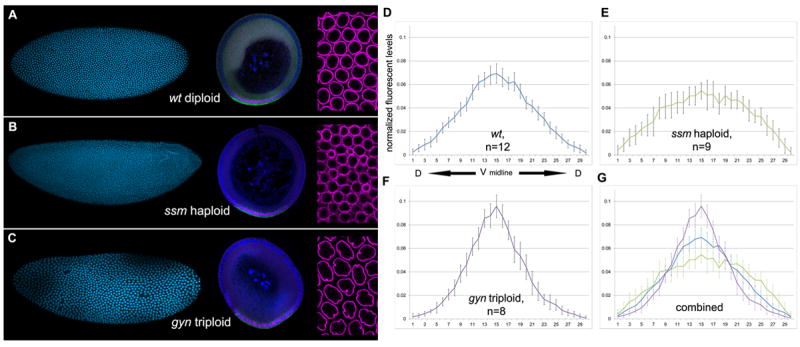
Specification of germ layers along the dorsoventral axis by morphogenetic gradients is an ideal model to study scaling properties of gradients and cell fate changes during evolution. Classical anatomical studies in divergent insects (e.g., flies and grasshoppers) revealed that the neuroectodermal size is conserved and originates similar numbers of neuroblasts of homologous identity. In contrast, mesodermal domains vary significantly in closely related Drosophila species. To further investigate the underlying mechanisms of scaling of germ layers across Drosophila species, we quantified the Dorsal (Dl)/NF-κB gradient, the main morphogenetic gradient that initiates separation of the mesoderm, neuroectoderm, and ectoderm. We discovered a variable range of Toll activation across species and found that Dl activates mesodermal genes at the same threshold levels in melanogaster sibling species. We also show that the Dl gradient distribution can be modulated by nuclear size and packing densities. We propose that variation in mesodermal size occurs at a fast evolutionary rate and is an important mechanism to define the ventral boundary of the neuroectoderm.


Figures

Figure 1
Figure 1. The distributions of nuclei, mesodermal domains and Dl levels changed across species
A) Histogram of average number of total nuclei (blue) and mesodermal nuclei (red) along the DV axis of blastoderm embryos. Bottom panel: pie charts with average percentage of nuclei that are mesodermal (red) and average percent of arc length corresponding to the mesoderm (red). Sample size for total nuclei counts are D. busckii n=12, D. melanogaster n=13, D. simulans n=17, D. sechellia n=13. Sample size for mesodermal nuclei: D. busckii n=13, D. melanogaster n=8, D. simulans n=11, D. sechellia n=10. Error bars are one standard deviation in both directions. Statistical significance (* = p<.05, ** = p<.01, *** = p<.001). (B-E) Blastoderm cross sections used for Dorsal gradient quantification, stained for Dorsal protein (magenta), sna mRNA (green, C-E) and DAPI nuclear dye (blue). B) D. busckii has the smallest embryo, followed by (B) D. melanogaster, (C) D. simulans and (D) D. sechellia. Ventral side is down. Scale bar: 100 μm. (F-J) Normalized graphs of average intensity levels of nuclear Dl protein (y-axis) per individual nucleus (x-axis). Graphs are centered on the ventral midline (x=15) based on sna expression domain, and extend dorsally from the center to the left (x=0) and right (x=30). (F) Average Dl distribution in D. busckii embryos (n=5). Note a sharper gradient with higher peak levels than D. melanogaster (G, n=12). In contrast, D. simulans Dl gradient (H, n=10) has a shallow profile, with lower peak levels and broader amplitude than D. melanogaster. (I) D. sechellia (n=12) gradient distribution is similar to D. melanogaster. J) Average distributions from all species combined onto one graph. Arrows indicate the Dl threshold levels for sna activation for the dorsal most sna+ nuclei at the border of mesoderm and neuroectoderm. Error bars are one standard deviation in both directions. See also Figure S1.
Figure 2
Figure 2. Sensitivity of mesodermal gene activation is identical among D. melanogaster sibling species
(A-D) Ventral view of whole mount blastoderm embryos stained for sna mRNA (red) and DAPI nuclear stain (blue). A) D. melanogaster. B) D. simulans. C) Hybrid embryo from D. melanogaster mother and D. simulans father. D) Hybrid embryo from D. simulans mother and D. melanogaster father. E, F) High magnification of boxed areas in C and D, respectively. Note the presence of two nuclear transcription dots per nucleus in cells along the border of sna expression, indicating that both copies of the sna gene from each species are activated. The abutting cells outside the mesoderm have both sna copies turned off. Similar results were obtained for twi (See Fig. S2) and hybrids between D. sechellia and D. melanogaster (not shown).
Figure 3
Figure 3. Drosophila species vary in nuclei size and densities
Anti-Lamin stainings of D. busckii (A, B), D. melanogaster (C, D), D. simulans (E, F) and D. sechellia (G, H) embryos. A, C, E, G) Sagittal view of embryos showing start of membrane growth using DIC transmitted light merged to Lamin staining (orange). B, D, F and H) Images of a single confocal plane corresponding to the center of nucleus were used to calculate average nuclear diameter, nuclear packing, and nuclear surface area (see Fig. S1 and methods). Ventral mesodermal nuclei of D. busckii (B) have the smallest size compared to the other species and the lowest density packing. D) D. melanogaster has nuclei slightly larger than (F) D. simulans. Nuclei of D. sechellia (H) have the largest size compared to the other species, and exhibit highest density packing along with D. melanogaster. Embryos were double stained for sna (not shown) to localize the ventral region from where the images were taken. See also figure S3.
Figure 4
Figure 4. The Dl gradient is modified by nuclear size and packing density
(A-C) Whole mount blastoderm embryos (left) and corresponding cross-sections (middle) stained with DAPI nuclear dye (cyan, left), anti-Dorsal (magenta) and sna mRNA (green) of (A) wt D. melanogaster, (B) ssm and (C) gyn mutants. Right panel: Note increasing size in nuclei and density packing from haploid embryos (B), to diploids (A), to triploids (C) in anti-Lamin staining preparations (magenta). (D-G) Normalized graphs of average intensity levels of nuclear Dl protein (y-axis) per individual nucleus (x-axis). Graphs are centered on the ventral midline (x=15) and extend dorsally from the center to the left (x=0) and right (x=30). (D) Average Dl distribution of wt D. melanogaster (n=12), (E) haploid ssm mutants (n=9), and (F) triploid gyn mutants (n=8). (G) Average distributions were combined onto one graph. Wild type D. melanogaster (blue line), haploid ssm (green), and triploid gyn (purple). Error bars are one standard deviation in both directions. See also figure S4.

References

    1. Doe CQ. Molecular markers for identified neuroblasts and ganglion mother cells in the Drosophila central nervous system. Development. 1992;116:855–863. - PubMed
    1. Thomas JB, Bastiani MJ, Bate M, Goodman CS. From grasshopper to Drosophila: a common plan for neuronal development. Nature. 1984;310:203–207. - PubMed
    1. Whitington P. Evolution of neural development in the arthropods. Seminars in Cell & Developmental Biology. 1996;7:605–614.
    1. Belu M, Mizutani CM. Variation in Mesoderm Specification across Drosophilids Is Compensated by Different Rates of Myoblast Fusion during Body Wall Musculature Development. PLoS ONE. 2011;6:e28970. - PMC - PubMed
    1. Hong J-W, Hendrix DA, Papatsenko D, Levine MS. How the Dorsal gradient works: insights from postgenome technologies. Proc Natl Acad Sci U S A. 2008;105:20072–20076. - PMC - PubMed

Publication types

MeSH terms

LinkOut - more resources