

A meta-analysis identifies new loci associated with body mass index in individuals of African ancestry
- PMID: 23583978
- PMCID: PMC3694490
- DOI: 10.1038/ng.2608
A meta-analysis identifies new loci associated with body mass index in individuals of African ancestry
Abstract
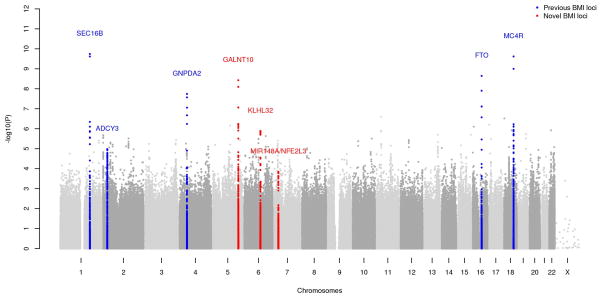
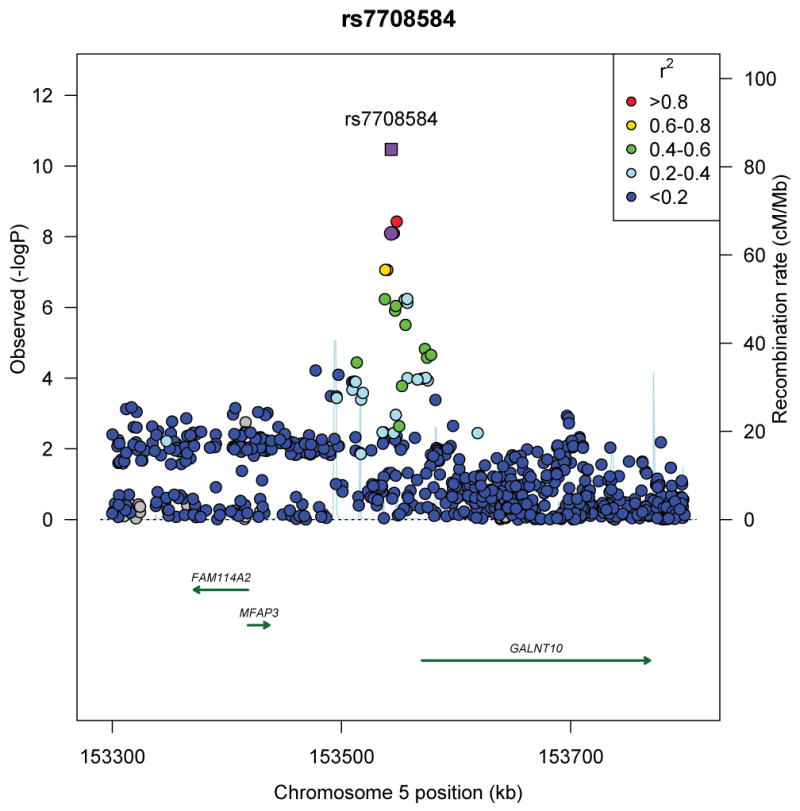
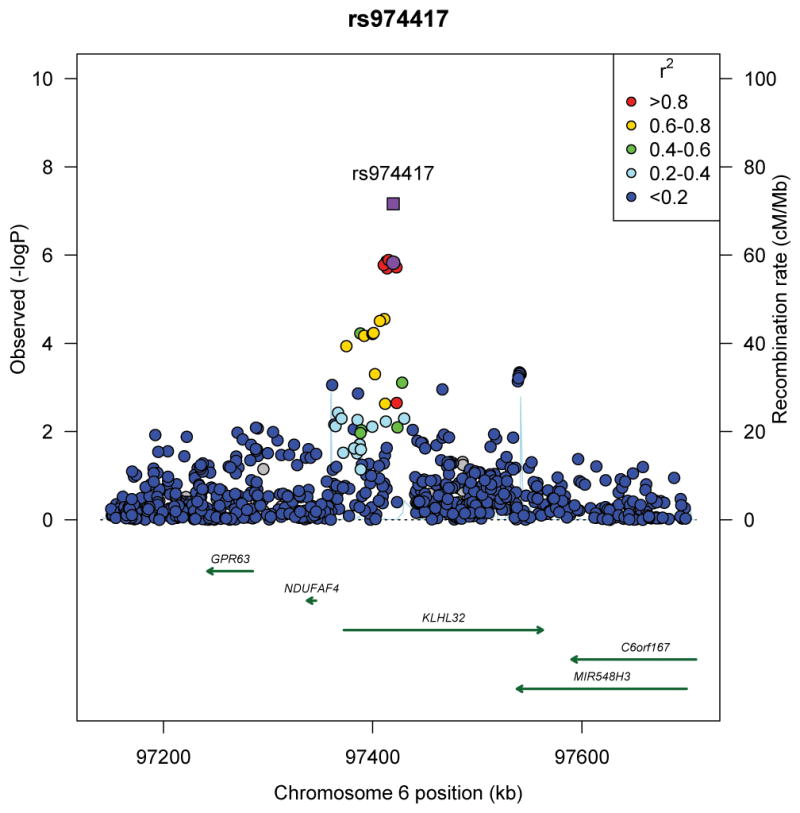
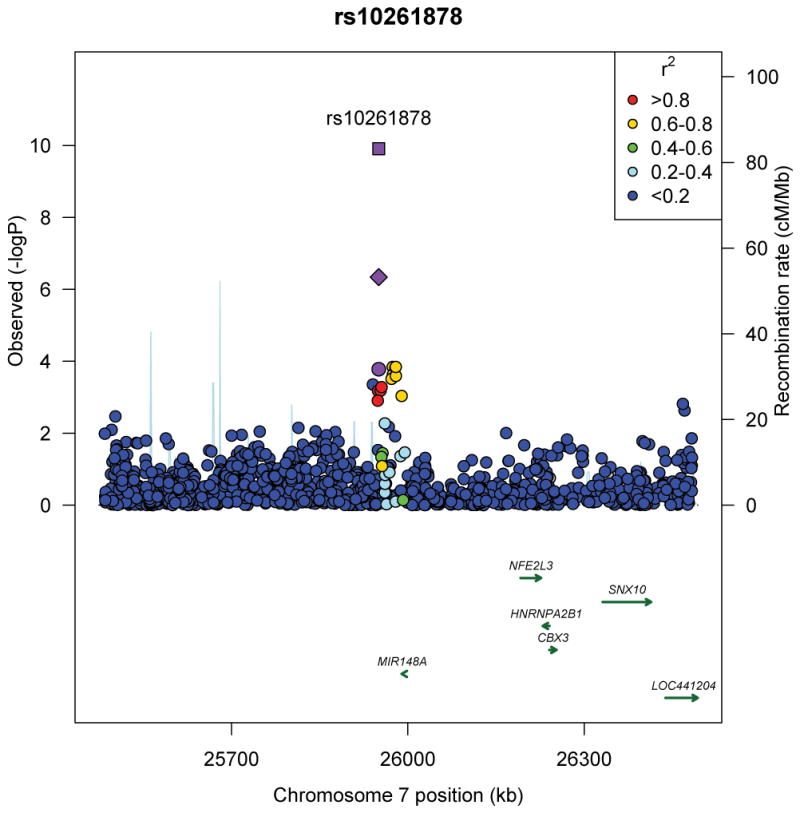
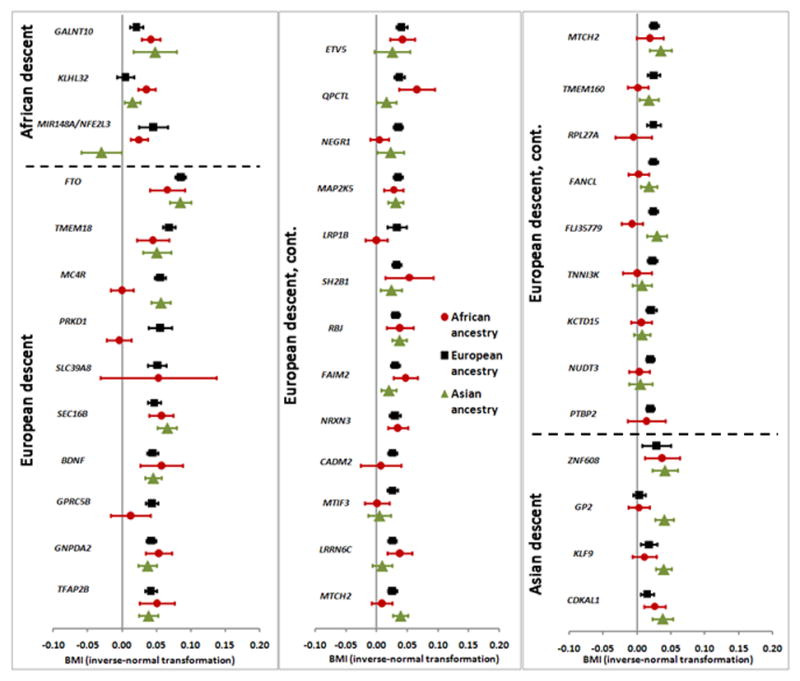
Genome-wide association studies (GWAS) have identified 36 loci associated with body mass index (BMI), predominantly in populations of European ancestry. We conducted a meta-analysis to examine the association of >3.2 million SNPs with BMI in 39,144 men and women of African ancestry and followed up the most significant associations in an additional 32,268 individuals of African ancestry. We identified one new locus at 5q33 (GALNT10, rs7708584, P = 3.4 × 10(-11)) and another at 7p15 when we included data from the GIANT consortium (MIR148A-NFE2L3, rs10261878, P = 1.2 × 10(-10)). We also found suggestive evidence of an association at a third locus at 6q16 in the African-ancestry sample (KLHL32, rs974417, P = 6.9 × 10(-8)). Thirty-two of the 36 previously established BMI variants showed directionally consistent effect estimates in our GWAS (binomial P = 9.7 × 10(-7)), five of which reached genome-wide significance. These findings provide strong support for shared BMI loci across populations, as well as for the utility of studying ancestrally diverse populations.
Figures
References
-
- Flegal KM, Carroll MD, Kit BK, Ogden CL. Prevalence of obesity and trends in the distribution of body mass index among US adults, 1999–2010. Jama. 2012;307:491–7. - PubMed
-
- Thorleifsson G, et al. Genome-wide association yields new sequence variants at seven loci that associate with measures of obesity. Nat Genet. 2009;41:18–24. - PubMed
Publication types
MeSH terms
Grants and funding
- U01-HL054512/HL/NHLBI NIH HHS/United States
- ES011126/ES/NIEHS NIH HHS/United States
- U01 HL054472/HL/NHLBI NIH HHS/United States
- UL1RR025005/RR/NCRR NIH HHS/United States
- CA54281/CA/NCI NIH HHS/United States
- HHSN268201100001C/WH/WHI NIH HHS/United States
- N02-HL-6-4278/HL/NHLBI NIH HHS/United States
- R01 HL071025/HL/NHLBI NIH HHS/United States
- R01-HL-088215/HL/NHLBI NIH HHS/United States
- UL1 RR033176/RR/NCRR NIH HHS/United States
- R01 AI061774/AI/NIAID NIH HHS/United States
- R01 HL053353/HL/NHLBI NIH HHS/United States
- U01 HL054471/HL/NHLBI NIH HHS/United States
- U19 CA148127/CA/NCI NIH HHS/United States
- K23 DK080145/DK/NIDDK NIH HHS/United States
- P20 GM103534/GM/NIGMS NIH HHS/United States
- N01-HC-95162/HC/NHLBI NIH HHS/United States
- CA73629/CA/NCI NIH HHS/United States
- N01-HC-45205/HC/NHLBI NIH HHS/United States
- UL1RR033176/RR/NCRR NIH HHS/United States
- RC2 CA148085/CA/NCI NIH HHS/United States
- Z01-AG000513/AG/NIA NIH HHS/United States
- P30 CA016672/CA/NCI NIH HHS/United States
- ES007784/ES/NIEHS NIH HHS/United States
- R01 HG003054/HG/NHGRI NIH HHS/United States
- N01-HC-05187/HC/NHLBI NIH HHS/United States
- N01 HC048050/HC/NHLBI NIH HHS/United States
- CA77305/CA/NCI NIH HHS/United States
- UL1TR000124/TR/NCATS NIH HHS/United States
- N01 HC095170/HC/NHLBI NIH HHS/United States
- CA88164/CA/NCI NIH HHS/United States
- R01-HL-071252/HL/NHLBI NIH HHS/United States
- R01 ES006717/ES/NIEHS NIH HHS/United States
- N01 HC048047/HC/NHLBI NIH HHS/United States
- R01 CA089085/CA/NCI NIH HHS/United States
- R01 HL046380/HL/NHLBI NIH HHS/United States
- S06GM008016-380111/GM/NIGMS NIH HHS/United States
- R01 HL071251/HL/NHLBI NIH HHS/United States
- R01 HL087698/HL/NHLBI NIH HHS/United States
- R01 HL101161/HL/NHLBI NIH HHS/United States
- CA127298/CA/NCI NIH HHS/United States
- R01-HL086718/HL/NHLBI NIH HHS/United States
- CA092579/CA/NCI NIH HHS/United States
- R01-HL-071258/HL/NHLBI NIH HHS/United States
- UL1 TR000150/TR/NCATS NIH HHS/United States
- R01 CA133996/CA/NCI NIH HHS/United States
- U10 CA037429/CA/NCI NIH HHS/United States
- R01 CA142996/CA/NCI NIH HHS/United States
- HHSC268200782096C/PHS HHS/United States
- U01 CA69417/CA/NCI NIH HHS/United States
- N01-HC-85085/HC/NHLBI NIH HHS/United States
- R01HL59367/HL/NHLBI NIH HHS/United States
- R01 HL071259/HL/NHLBI NIH HHS/United States
- UL1 RR025005/RR/NCRR NIH HHS/United States
- UL1-RR-025005/RR/NCRR NIH HHS/United States
- P50 CA125183/CA/NCI NIH HHS/United States
- CA1326792/CA/NCI NIH HHS/United States
- R01 AG015928/AG/NIA NIH HHS/United States
- K23 AR052364/AR/NIAMS NIH HHS/United States
- N01 HC048048/HC/NHLBI NIH HHS/United States
- N01 AG062101/AG/NIA NIH HHS/United States
- S06GM008016-320107/GM/NIGMS NIH HHS/United States
- R01 CA141712/CA/NCI NIH HHS/United States
- N02 HL064278/HL/NHLBI NIH HHS/United States
- HHSN268201200036C/HL/NHLBI NIH HHS/United States
- N01 HC075150/HC/NHLBI NIH HHS/United States
- U01 HG004790/HG/NHGRI NIH HHS/United States
- N01-HC-48047/HC/NHLBI NIH HHS/United States
- R01-DK-8925601/DK/NIDDK NIH HHS/United States
- R01 CA098663/CA/NCI NIH HHS/United States
- R01 CA121197/CA/NCI NIH HHS/United States
- R01 HL071252/HL/NHLBI NIH HHS/United States
- Z01HG200362/HG/NHGRI NIH HHS/United States
- M01RR00080/RR/NCRR NIH HHS/United States
- N01-HC-85081/HC/NHLBI NIH HHS/United States
- HHSN26820110009C/PHS HHS/United States
- N01 HG025487/ES/NIEHS NIH HHS/United States
- R01 HL087660/HL/NHLBI NIH HHS/United States
- HHSN268201100011C/HL/NHLBI NIH HHS/United States
- R01 HL059367/HL/NHLBI NIH HHS/United States
- N01-HC-95163/HC/NHLBI NIH HHS/United States
- R01-HL-071250/HL/NHLBI NIH HHS/United States
- N01 HC015103/HC/NHLBI NIH HHS/United States
- N01-HC-95168/HC/NHLBI NIH HHS/United States
- U01 HL054509/HL/NHLBI NIH HHS/United States
- U01 CA127298/CA/NCI NIH HHS/United States
- R01 HL085251/HL/NHLBI NIH HHS/United States
- UL1-RR-024156/RR/NCRR NIH HHS/United States
- R01 CA092447/CA/NCI NIH HHS/United States
- R01 CA073629/CA/NCI NIH HHS/United States
- R01DK075787/DK/NIDDK NIH HHS/United States
- HHSN271201100004C/AG/NIA NIH HHS/United States
- UL1 RR024156/RR/NCRR NIH HHS/United States
- R01 AI079139/AI/NIAID NIH HHS/United States
- Z01 HG200362/ImNIH/Intramural NIH HHS/United States
- R01 HL074166/HL/NHLBI NIH HHS/United States
- P30 CA016086/CA/NCI NIH HHS/United States
- R37 HL045508/HL/NHLBI NIH HHS/United States
- N01-HC-45204/HC/NHLBI NIH HHS/United States
- R01 HL071250/HL/NHLBI NIH HHS/United States
- N01 HC065226/HC/NHLBI NIH HHS/United States
- R01 HL086694/HL/NHLBI NIH HHS/United States
- R01 CA127219/CA/NCI NIH HHS/United States
- N01-HC-95159/HC/NHLBI NIH HHS/United States
- N01 HC045205/HC/NHLBI NIH HHS/United States
- CA056678/CA/NCI NIH HHS/United States
- N01 HC095172/HC/NHLBI NIH HHS/United States
- 1R01AG032098-01A1/AG/NIA NIH HHS/United States
- R01 HL087652/HL/NHLBI NIH HHS/United States
- AG-20098/AG/NIA NIH HHS/United States
- N01-HC-95095/HC/NHLBI NIH HHS/United States
- U01 HG004424/HG/NHGRI NIH HHS/United States
- HL54515/HL/NHLBI NIH HHS/United States
- UL1 TR000124/TR/NCATS NIH HHS/United States
- N01 AG062106/AG/NIA NIH HHS/United States
- R01-HL-071251/HL/NHLBI NIH HHS/United States
- HHSN268200625226C/PHS HHS/United States
- U01 HG004402/HG/NHGRI NIH HHS/United States
- N01-HC-95165/HC/NHLBI NIH HHS/United States
- R01 DK075787/DK/NIDDK NIH HHS/United States
- R01-DK075787/DK/NIDDK NIH HHS/United States
- ES10126/ES/NIEHS NIH HHS/United States
- R01 DK075681/DK/NIDDK NIH HHS/United States
- N01-HC-85086/HC/NHLBI NIH HHS/United States
- N01 HC095171/HC/NHLBI NIH HHS/United States
- P50 CA058223/CA/NCI NIH HHS/United States
- R01 CA100374/CA/NCI NIH HHS/United States
- HG004726/HG/NHGRI NIH HHS/United States
- CA68578/CA/NCI NIH HHS/United States
- R01 CA056678/CA/NCI NIH HHS/United States
- R01 DK087914/DK/NIDDK NIH HHS/United States
- AG-027058/AG/NIA NIH HHS/United States
- CA63464/CA/NCI NIH HHS/United States
- N01-HC-48050/HC/NHLBI NIH HHS/United States
- R01 HL105756/HL/NHLBI NIH HHS/United States
- U01HG004402/HG/NHGRI NIH HHS/United States
- N01 HC095095/HC/NHLBI NIH HHS/United States
- HHSN26820110006C/PHS HHS/United States
- HL 46380/HL/NHLBI NIH HHS/United States
- N01-HC-85082/HC/NHLBI NIH HHS/United States
- CA082664/CA/NCI NIH HHS/United States
- R01 HL071051/HL/NHLBI NIH HHS/United States
- R01 CA058420/CA/NCI NIH HHS/United States
- P30 CA060553/CA/NCI NIH HHS/United States
- N01-HC-35129/HC/NHLBI NIH HHS/United States
- R01 CA077305/CA/NCI NIH HHS/United States
- HHSN268201100004C/WH/WHI NIH HHS/United States
- N01 HC-55222/HC/NHLBI NIH HHS/United States
- R01 DK066358/DK/NIDDK NIH HHS/United States
- HHSN26820110007C/PHS HHS/United States
- R01 DK084350/DK/NIDDK NIH HHS/United States
- P20 MD006899/MD/NIMHD NIH HHS/United States
- R01 HD056465/HD/NICHD NIH HHS/United States
- HHSN26820110008C/PHS HHS/United States
- R01-HL-071259/HL/NHLBI NIH HHS/United States
- R01HL087641/HL/NHLBI NIH HHS/United States
- CA164973/CA/NCI NIH HHS/United States
- R01 CA055769/CA/NCI NIH HHS/United States
- CA148085/CA/NCI NIH HHS/United States
- UM1 CA164974/CA/NCI NIH HHS/United States
- N01 HC055222/HL/NHLBI NIH HHS/United States
- HL087660/HL/NHLBI NIH HHS/United States
- HL54496/HL/NHLBI NIH HHS/United States
- RC1 HL100245/HL/NHLBI NIH HHS/United States
- N01 AG062103/AG/NIA NIH HHS/United States
- N01-HC-95164/HC/NHLBI NIH HHS/United States
- R01 HL55673/HL/NHLBI NIH HHS/United States
- N01-HC-95169/HC/NHLBI NIH HHS/United States
- U01 NS041588/NS/NINDS NIH HHS/United States
- R01 CA063464/CA/NCI NIH HHS/United States
- UL1 TR000439/TR/NCATS NIH HHS/United States
- R01-HL-071205/HL/NHLBI NIH HHS/United States
- N01 HC045204/HC/NHLBI NIH HHS/United States
- RFA CA-06-503/CA/NCI NIH HHS/United States
- N01 HC005187/HC/NHLBI NIH HHS/United States
- R01 CA141716/CA/NCI NIH HHS/United States
- HHSN268201100012C/HL/NHLBI NIH HHS/United States
- R01 LM010098/LM/NLM NIH HHS/United States
- HHSN26820110005C/PHS HHS/United States
- N01-HC-48049/HC/NHLBI NIH HHS/United States
- N01-HC-85083/HC/NHLBI NIH HHS/United States
- N01-HC-75150/HC/NHLBI NIH HHS/United States
- CA100374/CA/NCI NIH HHS/United States
- N01 HC045134/HC/NHLBI NIH HHS/United States
- R01-HL-087700/HL/NHLBI NIH HHS/United States
- N01-HC-85080/HC/NHLBI NIH HHS/United States
- N01-HC-95160/HC/NHLBI NIH HHS/United States
- R01 CA082664/CA/NCI NIH HHS/United States
- KL2 TR000446/TR/NCATS NIH HHS/United States
- N01 HC095169/HC/NHLBI NIH HHS/United States
- R01 HL080295/HL/NHLBI NIH HHS/United States
- R01-DK-075681/DK/NIDDK NIH HHS/United States
- HHSN268200782096C/HG/NHGRI NIH HHS/United States
- U01 HL072518/HL/NHLBI NIH HHS/United States
- R01 CA054281/CA/NCI NIH HHS/United States
- N01-HC-95171/HC/NHLBI NIH HHS/United States
- HL54473/HL/NHLBI NIH HHS/United States
- U01 HG005157/HG/NHGRI NIH HHS/United States
- HHSN268201100046C/HL/NHLBI NIH HHS/United States
- HHSN268201100003C/WH/WHI NIH HHS/United States
- R01 HL088215/HL/NHLBI NIH HHS/United States
- R01 CA088164/CA/NCI NIH HHS/United States
- R01-HL053353/HL/NHLBI NIH HHS/United States
- HL100245/HL/NHLBI NIH HHS/United States
- M01 RR07122/RR/NCRR NIH HHS/United States
- R01 HL079055/HL/NHLBI NIH HHS/United States
- N01-HC-95172/HC/NHLBI NIH HHS/United States
- R01 HL059684/HL/NHLBI NIH HHS/United States
- CA140388/CA/NCI NIH HHS/United States
- R01 HL086718/HL/NHLBI NIH HHS/United States
- UL1 TR000055/TR/NCATS NIH HHS/United States
- CA092447/CA/NCI NIH HHS/United States
- 1UL1RR024975-01/RR/NCRR NIH HHS/United States
- DK063491/DK/NIDDK NIH HHS/United States
- R01 HL071205/HL/NHLBI NIH HHS/United States
- R01 DK064695/DK/NIDDK NIH HHS/United States
- N01-HC-45133/HC/NHLBI NIH HHS/United States
- R01 DK053591/DK/NIDDK NIH HHS/United States
- CA68485/CA/NCI NIH HHS/United States
- UL1 RR024975/RR/NCRR NIH HHS/United States
- N01-HC-95100/HC/NHLBI NIH HHS/United States
- N01-HC-85079/HC/NHLBI NIH HHS/United States
- N01-HC-95161/HC/NHLBI NIH HHS/United States
- R01-HL-071051/HL/NHLBI NIH HHS/United States
- K07 CA136969/CA/NCI NIH HHS/United States
- R01-HL074166/HL/NHLBI NIH HHS/United States
- HHSN268201100002C/WH/WHI NIH HHS/United States
- T32 DK007734/DK/NIDDK NIH HHS/United States
- HL54495/HL/NHLBI NIH HHS/United States
- R01 ES011126/ES/NIEHS NIH HHS/United States
- CA58223/CA/NCI NIH HHS/United States
- N01-HC-85239/HC/NHLBI NIH HHS/United States
- AG-023629/AG/NIA NIH HHS/United States
- N01 HC085079/HC/NHLBI NIH HHS/United States
- R01 CA111646/CA/NCI NIH HHS/United States
- R01 HL117078/HL/NHLBI NIH HHS/United States
- R24 HD050924/HD/NICHD NIH HHS/United States
- N02-HL-64278/HL/NHLBI NIH HHS/United States
- N01-HC-95166/HC/NHLBI NIH HHS/United States
- R01 HL087641/HL/NHLBI NIH HHS/United States
- R01 CA114379/CA/NCI NIH HHS/United States
- N01-HC-48048/HC/NHLBI NIH HHS/United States
- R01 AG023629/AG/NIA NIH HHS/United States
- U01 HL054512/HL/NHLBI NIH HHS/United States
- 2M01RR010284/RR/NCRR NIH HHS/United States
- R01 CA092579/CA/NCI NIH HHS/United States
- U01 HG005152/HG/NHGRI NIH HHS/United States
- R01 HL058625/HL/NHLBI NIH HHS/United States
- R01 AG027058/AG/NIA NIH HHS/United States
- R01 HL087700/HL/NHLBI NIH HHS/United States
- UM1 CA182883/CA/NCI NIH HHS/United States
- N01-HC-95170/HC/NHLBI NIH HHS/United States
- SC1 HL095100/HL/NHLBI NIH HHS/United States
- U01 HL054495/HL/NHLBI NIH HHS/United States
- R01 HL071258/HL/NHLBI NIH HHS/United States
- HL54509/HL/NHLBI NIH HHS/United States
- R37-HL045508/HL/NHLBI NIH HHS/United States
- S06GM08016/GM/NIGMS NIH HHS/United States
- HHSN26800625226C/PHS HHS/United States
- HL101161/HL/NHLBI NIH HHS/United States
- HL54471/HL/NHLBI NIH HHS/United States
- R01 HL055673/HL/NHLBI NIH HHS/United States
- N01-HD-3-3175/HD/NICHD NIH HHS/United States
- HHSN268201100010C/HL/NHLBI NIH HHS/United States
- N01-HC-85084/HC/NHLBI NIH HHS/United States
- U01 HL054473/HL/NHLBI NIH HHS/United States
- P60 AR062755/AR/NIAMS NIH HHS/United States
- N01 HC095159/HC/NHLBI NIH HHS/United States
- N01-HC-95167/HC/NHLBI NIH HHS/United States
- R01HL086694/HL/NHLBI NIH HHS/United States
- HL54472/HL/NHLBI NIH HHS/United States
- N01-HC-65226/HC/NHLBI NIH HHS/United States
- U01 HG004726/HG/NHGRI NIH HHS/United States
- U01 HG006830/HG/NHGRI NIH HHS/United States
- R01 CA100598/CA/NCI NIH HHS/United States
- R01-HG003054/HG/NHGRI NIH HHS/United States
LinkOut - more resources
Full Text Sources
Other Literature Sources
Medical
Molecular Biology Databases
