

Meta-Analysis
doi: 10.1038/ng.2609.
Epub 2013 Apr 14.
Genome-wide association study identifies multiple susceptibility loci for pulmonary fibrosis
Affiliations
- PMID: 23583980
- PMCID: PMC3677861
- DOI: 10.1038/ng.2609
Item in Clipboard
Meta-Analysis
Genome-wide association study identifies multiple susceptibility loci for pulmonary fibrosis
Nat Genet.
2013 Jun.
Erratum in
- Nat Genet. 2013 Nov;45(11):1409
Abstract
We performed a genome-wide association study of non-Hispanic, white individuals with fibrotic idiopathic interstitial pneumonias (IIPs; n = 1,616) and controls (n = 4,683), with follow-up replication analyses in 876 cases and 1,890 controls. We confirmed association with TERT at 5p15, MUC5B at 11p15 and the 3q26 region near TERC, and we identified seven newly associated loci (Pmeta = 2.4 × 10(-8) to 1.1 × 10(-19)), including FAM13A (4q22), DSP (6p24), OBFC1 (10q24), ATP11A (13q34), DPP9 (19p13) and chromosomal regions 7q22 and 15q14-15. Our results suggest that genes involved in host defense, cell-cell adhesion and DNA repair contribute to risk of fibrotic IIPs.
Figures
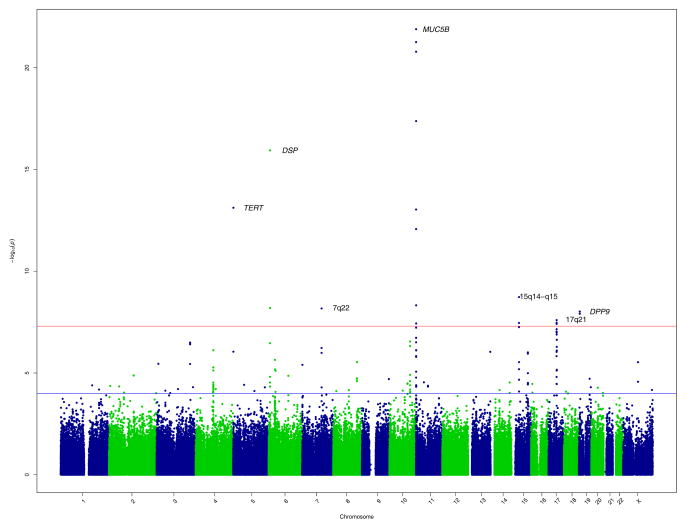
GWAS results at 439,828 SNPs with 1616 cases and 4683 controls under additive model. SNPs above red line were genome-wide significant at P < 5×10⁻⁸. These SNPs and SNPs between red and blue lines, corresponding to 5×10⁻⁸ < P-value <.0001, were selected for follow-up in 876 cases and 1890 controls.
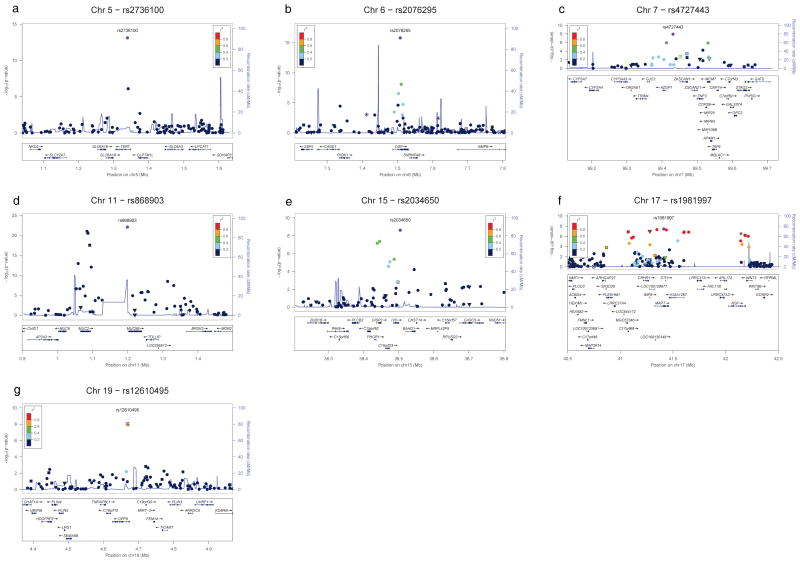
Locus-specific plots corresponding to discovery GWAS results for all loci reaching genome-wide significance in the GWAS discovery analysis and meta-analysis of the discovery and replication results (a–g). For each plot, the –log10
P values (y axis) of the SNPs are shown according to their chromosomal positions (x axis). The significant loci are on chromosomes 5p15 (a), 6p24 (b), 7q22 (c), 11p15 (d), 15q14-15 (e), 17q21 (f), and 19p13 (g). The estimated recombination rates (cM/Mb) from the HapMap Project (NCBI Build 36) are shown as light blue lines, and the genomic locations of genes within the regions of interest in the NCBI Build 36 human assembly are shown as arrows. SNPs shown in red, orange, green, light blue and blue have r2 ≥ 0.8, r2 ≥ 0.6, r2 ≥ 0.4, r2 ≥ 0.2 and r2 < 0.2 with the most highly-associated SNP, respectively. SNP annotation key: Circles, squares, triangles, star (*), and squares with an x represent no annotation, synonymous or 3′ UTR, nonsynonymous, TFBScons and MCS44 placental, respectively. Genotyped SNPs shown; analogous plots with imputed SNP genotypes are shown in Supplementary Figure 2.
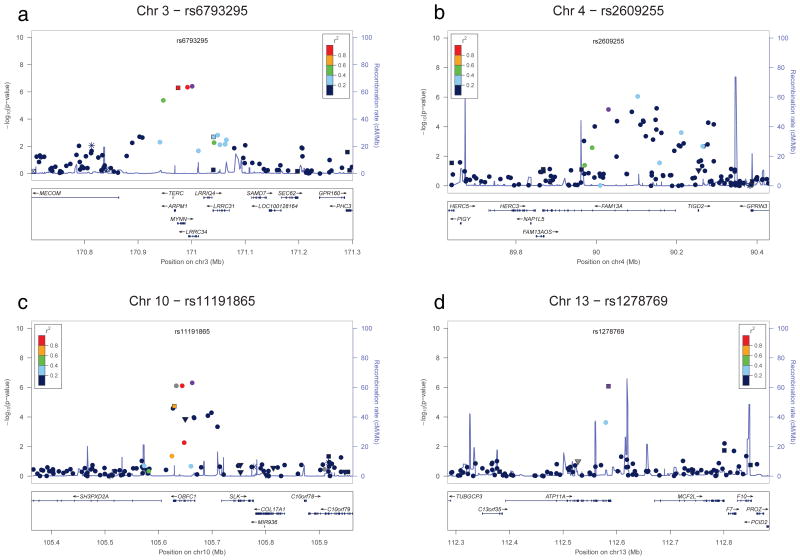
Locus-specific plots corresponding to discovery GWAS results for four additional loci reaching genome-wide significance after the meta-analysis of the discovery and replication results (a–d). For each plot, the –log10
P values (y axis) of the SNPs are shown according to their chromosomal positions (x axis). The significant loci are on chromosomes 3q26 (a), 4q22 (b), 10q24 (c), and 13q34 (d). The estimated recombination rates (cM/Mb) from the HapMap Project (NCBI Build 36) are shown as light blue lines, and the genomic locations of genes within the regions of interest in the NCBI Build 36 human assembly are shown as arrows. SNPs shown in red, orange, green, light blue and blue have r2 ≥ 0.8, r2 ≥ 0.6, r2 ≥ 0.4, r2 ≥ 0.2 and r2 < 0.2 with the most highly-associated SNP, respectively. SNP annotation key: Circles, squares, triangles, star (*), and squares with an x represent no annotation, synonymous or 3′ UTR, nonsynonymous, TFBScons and MCS44 placental, respectively. Genotyped SNPs shown; analogous plots with imputed SNP genotypes are shown in Supplementary Figure 3.
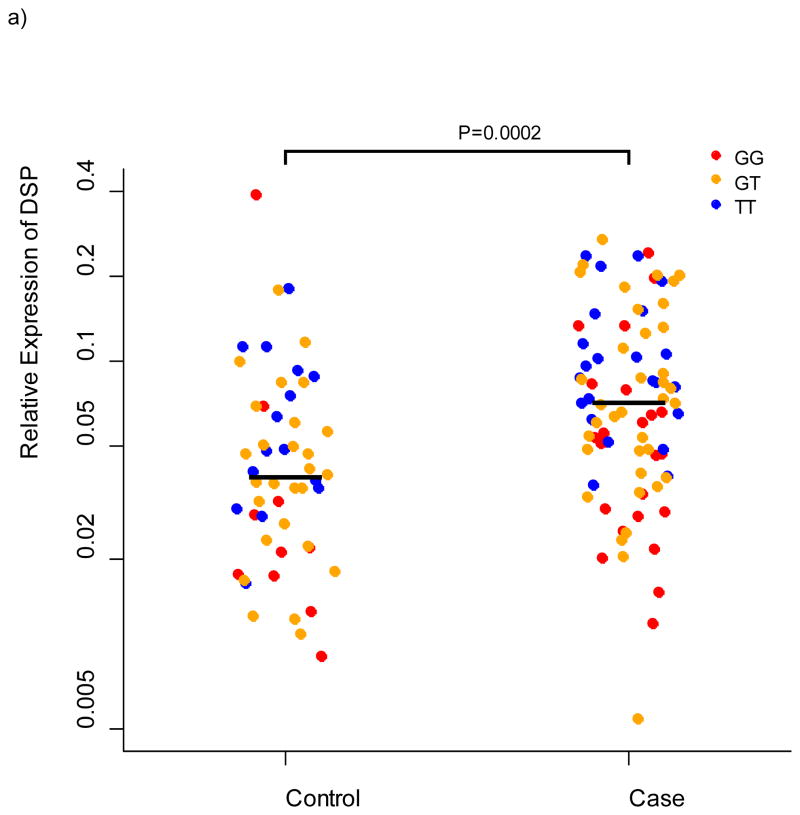
Relative expression of DSP in lung tissue from 100 cases and 94 controls. a) relative expression by case/control status b) relative expression by genotype at rs2076295 in DSP.
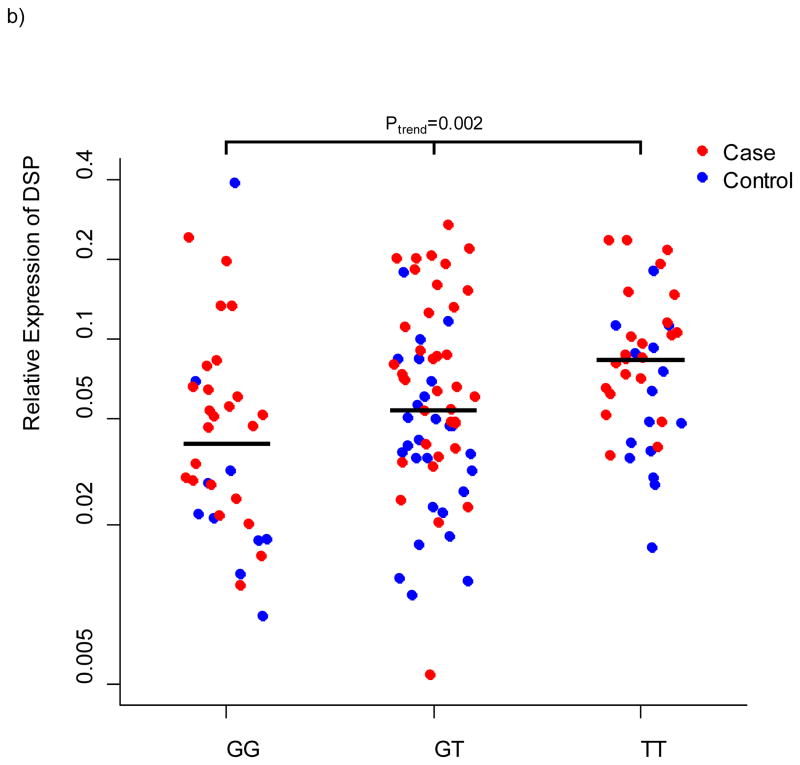
Relative expression of DSP in lung tissue from 100 cases and 94 controls. a) relative expression by case/control status b) relative expression by genotype at rs2076295 in DSP.
References
-
- American Thoracic Society/European Respiratory Society International Multidisciplinary Consensus Classification of the Idiopathic Interstitial Pneumonias. This joint statement of the American Thoracic Society (ATS), and the European Respiratory Society (ERS) was adopted by the ATS board of directors, June 2001 and by the ERS Executive Committee. Am J Respir Crit Care Med. 2001 Jun;165:277–304. 2002. - PubMed
-
- Hubbard R, et al. Exposure to commonly prescribed drugs and the etiology of cryptogenic fibrosing alveolitis: a case-control study. Am J Respir Crit Care Med. 1998;157:743–7. - PubMed
-
- Raghu G. Idiopathic pulmonary fibrosis: new evidence and an improved standard of care in 2012. Lancet. 2012;380:699–701. - PubMed
-
- Armanios MY, et al. Telomerase mutations in families with idiopathic pulmonary fibrosis. N Engl J Med. 2007;356:1317–26. - PubMed
Publication types
MeSH terms
Grants and funding
- U01-HL108642/HL/NHLBI NIH HHS/United States
- U01 HL089897/HL/NHLBI NIH HHS/United States
- R01-HL095393/HL/NHLBI NIH HHS/United States
- U01-HL089856/HL/NHLBI NIH HHS/United States
- 097117/Wellcome Trust/United Kingdom
- P01-HL092870/HL/NHLBI NIH HHS/United States
- RC2-HL101715/HL/NHLBI NIH HHS/United States
- RC2 HL101715/HL/NHLBI NIH HHS/United States
- P01 HL092870/HL/NHLBI NIH HHS/United States
- P50-HL0894932/HL/NHLBI NIH HHS/United States
- U01 HL108642/HL/NHLBI NIH HHS/United States
- U01 HL089856/HL/NHLBI NIH HHS/United States
- I01 BX001534/BX/BLRD VA/United States
- U01-HL089897/HL/NHLBI NIH HHS/United States
- R01-HL097163/HL/NHLBI NIH HHS/United States
- P50 HL084932/HL/NHLBI NIH HHS/United States
- R01 HL097163/HL/NHLBI NIH HHS/United States
- R01 HL095393/HL/NHLBI NIH HHS/United States
LinkOut - more resources
Full Text Sources
Other Literature Sources
Molecular Biology Databases
Miscellaneous
