. 2013 May;19(5):619-25.
doi: 10.1038/nm.3175. Epub 2013 Apr 14.

A colorectal cancer classification system that associates cellular phenotype and responses to therapy

Affiliations

A colorectal cancer classification system that associates cellular phenotype and responses to therapy

Anguraj Sadanandam et al. Nat Med. 2013 May.

Abstract

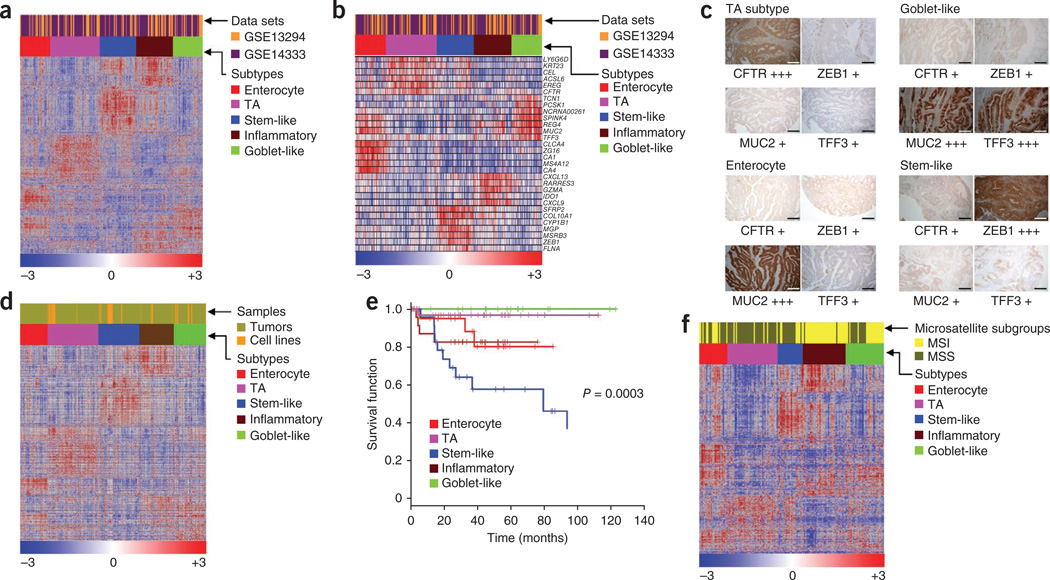
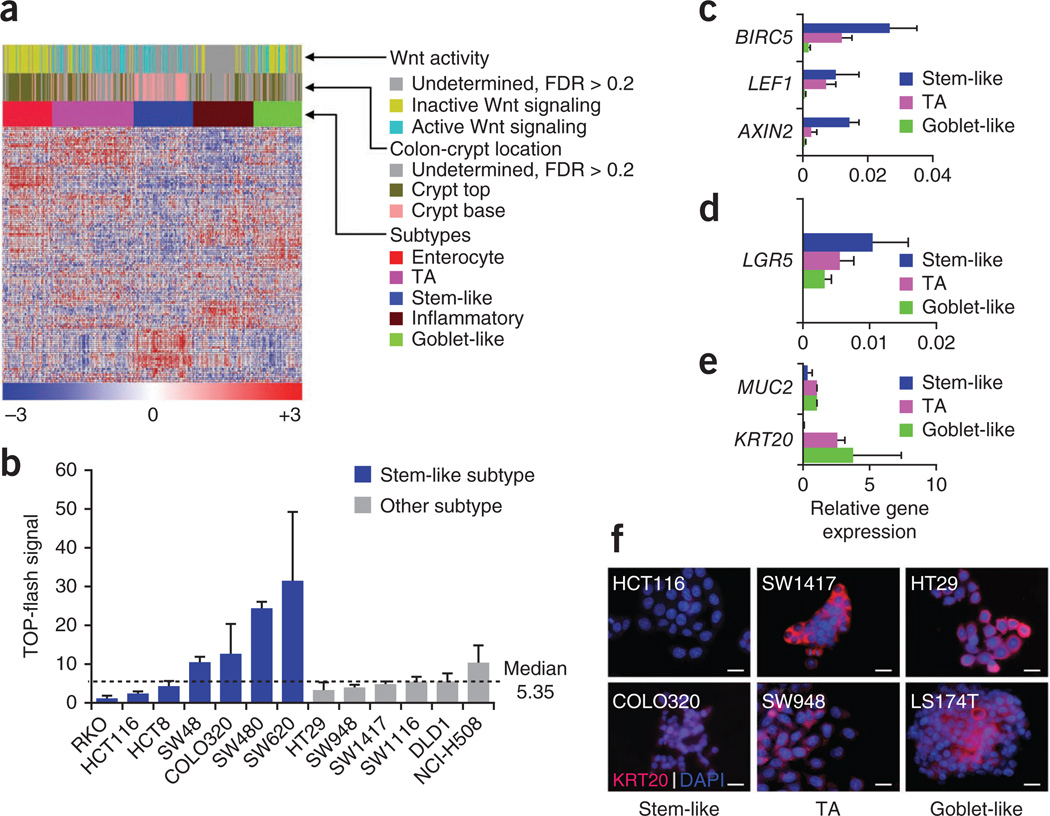
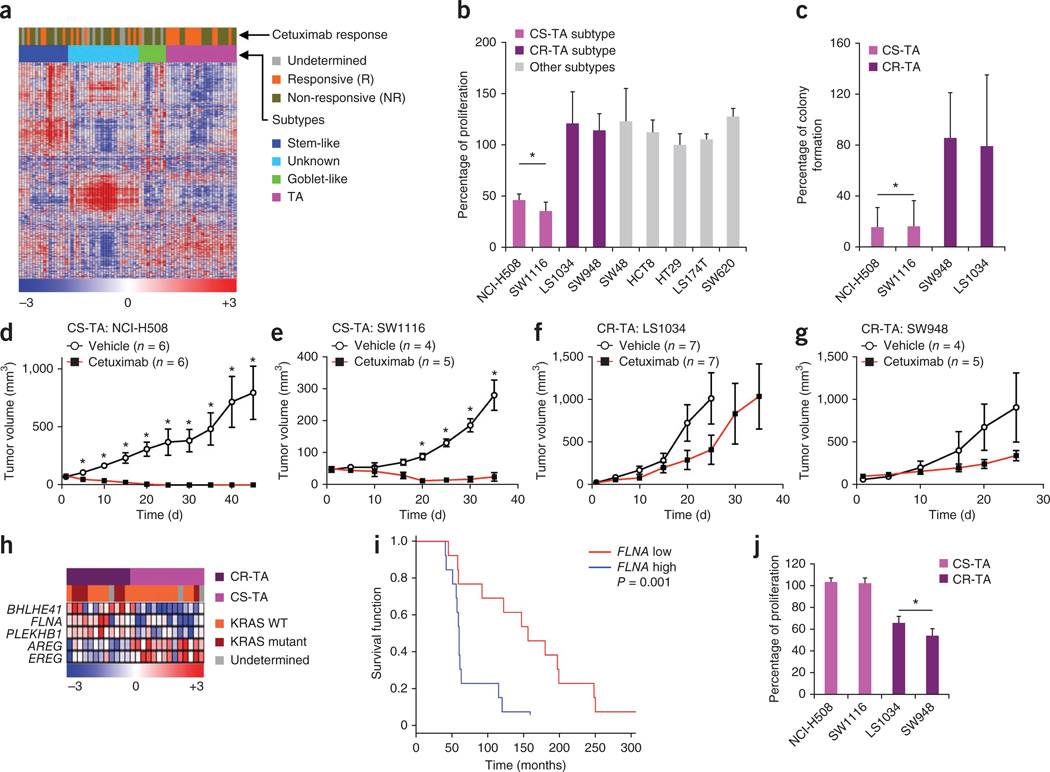
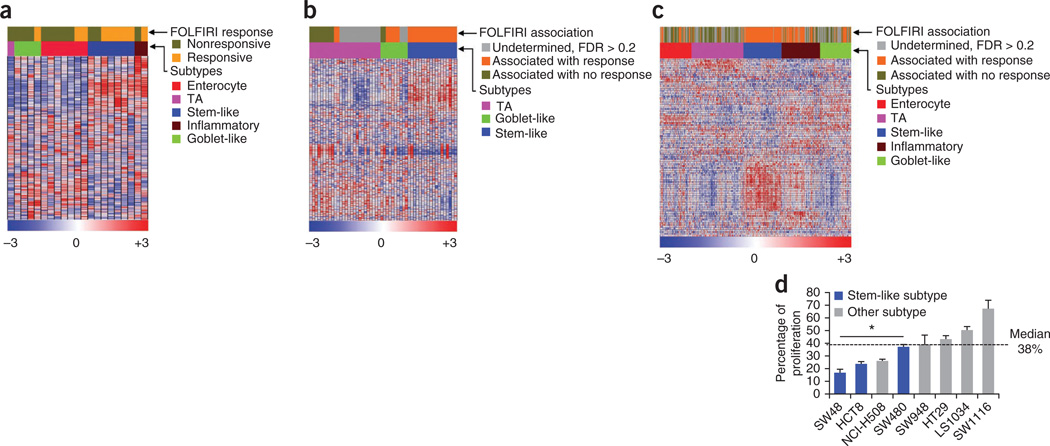
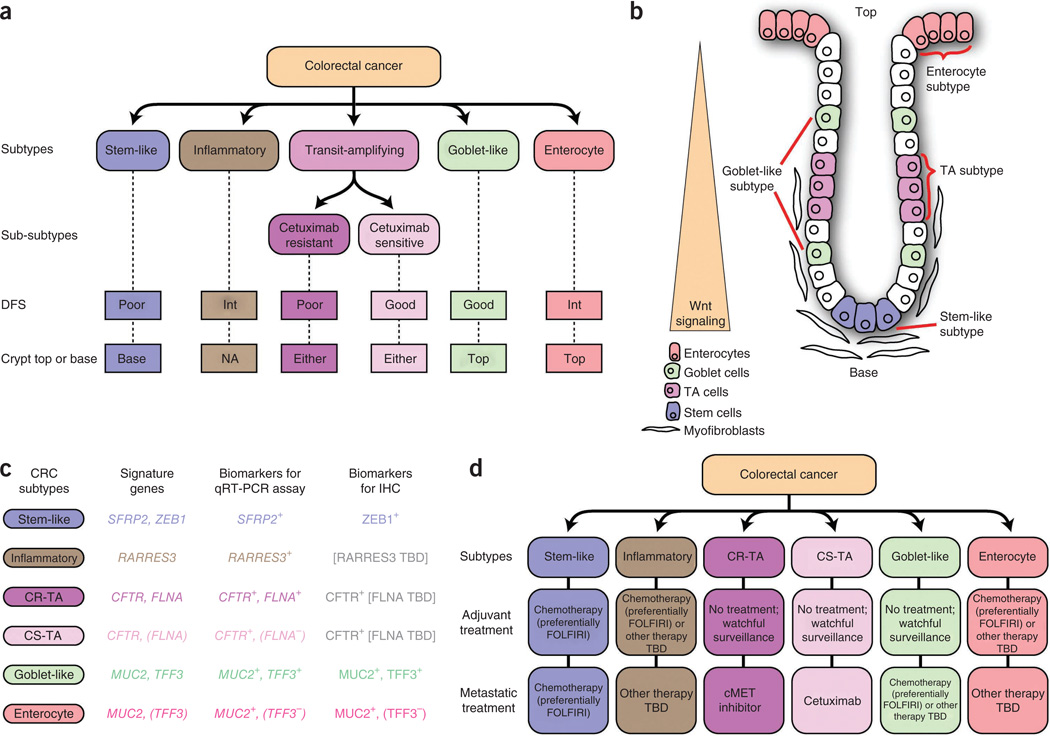
Colorectal cancer (CRC) is a major cause of cancer mortality. Whereas some patients respond well to therapy, others do not, and thus more precise, individualized treatment strategies are needed. To that end, we analyzed gene expression profiles from 1,290 CRC tumors using consensus-based unsupervised clustering. The resultant clusters were then associated with therapeutic response data to the epidermal growth factor receptor-targeted drug cetuximab in 80 patients. The results of these studies define six clinically relevant CRC subtypes. Each subtype shares similarities to distinct cell types within the normal colon crypt and shows differing degrees of 'stemness' and Wnt signaling. Subtype-specific gene signatures are proposed to identify these subtypes. Three subtypes have markedly better disease-free survival (DFS) after surgical resection, suggesting these patients might be spared from the adverse effects of chemotherapy when they have localized disease. One of these three subtypes, identified by filamin A expression, does not respond to cetuximab but may respond to cMET receptor tyrosine kinase inhibitors in the metastatic setting. Two other subtypes, with poor and intermediate DFS, associate with improved response to the chemotherapy regimen FOLFIRI in adjuvant or metastatic settings. Development of clinically deployable assays for these subtypes and of subtype-specific therapies may contribute to more effective management of this challenging disease.


Figures

Figure 1
Figure 1
Classification of colorectal tumors and cell lines into subtypes. (a,b) Heatmaps showing CRC subtypes in tumors (from two merged core data sets: GSE13294 and GSE14333) defined by CRCassigner-786 (a) and CRCassigner-30 gene signatures (b). (c) Immunohistochemistry assays of patient CRC samples using candidate CRC subtype-specific markers (four from the CRCassigner-7) to assign subtypes. For immunohistochemistry, each subtype-specific marker was scored +, ++ or +++ for weak, moderate or strong intensity of staining, respectively; see Supplementary Methods and Supplementary Table 1d for more information. Scale bar represents 100 µm. (d) Heatmap showing CRC tumor subtypes from the core tumor data sets described in a and b merged with cancer cell line data,. (e) Differential DFS amongst the CRC subtypes from untreated patients from the GSE14333 data set plotted as Kaplan-Meier survival curves. (f) Heatmap depicting known MSI or MSS status for each of the colorectal tumor subtype samples from the data set GSE13294. CFTR, cystic fibrosis transmembrane conductance regulator; MUC2, mucin 2; TA, transit amplifying; TFF3, trefoil factor 3; ZEB1, zing finger E-box–binding homeobox-1.
Figure 2
Figure 2
Cellular phenotype and Wnt signaling in the CRC subtypes. (a) Heatmap showing association of colon-crypt location (top or base) and Wnt activity in the patient colorectal tumors from the core data sets revealed by applying specific signatures, using the NTP algorithm. In these analyses, statistics include only those samples that were predicted with FDR < 0.2 (see Supplementary Results and Discussion for statistics from all samples including those with FDR > 0.2). (b) TOP-flash assay depicting Wnt activity in CRC cell lines. (c–e) qRT-PCR analysis depicting the average expression of Wnt signaling pathway (c), stem cell (d) and differentiation-specific (e) markers in a set of CRC subtype-representative cancer cell lines (HT29 and LS174T for goblet-like; LS1034, NCI-H508 and SW948 for transit-amplifying; and SW48, HCT8 and SW620 for the stem-like subtype). The qRT-PCR data is plotted relative to the housekeeping gene RPL13A. Error bars represent the s.d. of technical replicates from a representative experiment. (f) Immunostaining analyses for the differentiation markers KRT20 are presented in red, and nuclei are counterstained with DAPI (blue). HCT116 and COLO320 belong to the stem-like, SW1417 and SW948 belong to transit-amplifying, and HT29 and LS174T belong to the goblet-like subtypes. Scale bar represents 15 µm.
Figure 3
Figure 3
Differential sensitivity among CRC subtypes to cetuximab. (a) Heatmap showing individual responses of patients with metastatic CRC (Khambata-Ford data set) to cetuximab treatment and their association with subtypes. (b) Cetuximab response in CRC subtype–specific cell lines is plotted as percentage of proliferation of treated cells (cetuximab, 62.5 µg ml−1) normalized to vehicle-treated control. (c) Cetuximab response in transit-amplifying sub-subtype specific cell lines are plotted as percentage colony formation of treated cells (cetuximab, 15.6 µg ml−1) normalized to vehicle-treated cells. (d–g) Cetuximab response in transit-amplifying sub-subtype–specific xenograft tumors using the CS-TA cell lines NCI-H508 (d) and SW1116 (e) and the CR-TA cell lines LS1034 (f) and SW948 (g). (h) Heatmap depicting differential gene expression patterns and the KRAS mutation status between CR-TA and CS-TA subtypes (Khambata-Ford data set). (i) Kaplan-Meier curve of differential DFS based on FLNA expression in transit-amplifying subtype samples (Khambata-Ford data set). The expression of FLNA was median-centered across all the 80 samples that belong to different subtypes; those above median were considered as ‘FLNA high’, and those below the median were considered as ‘FLNA low’. (j) Differential response to the cMET inhibitor PHA-665752 (625 nM) in CR-TA and CS-TA subtype-specific cell lines, plotted relative to vehicle-treated cells. Error bars represent the s.d. of technical replicates (triplicates in b,c and j, where as the sample sizes are indicated for d–g in the figure) from a representative experiment. *P < 0.05.
Figure 4
Figure 4
Specific response to chemotherapy in CRC subtypes. (a) Heatmap showing individual responses of patients with primary CRC (Del Rio data set, n = 21) to FOLFIRI treatment and their association with subtypes. The subtypes in the Del Rio data set were identified after merging the data set with the core CRC data sets (Supplementary Fig. 8c). Complete and partial responses and stable disease were considered as beneficial response, whereas progressive disease was deemed as no response. (b,c) Heatmaps showing association of individual patient CRC responses in the Khambata-Ford data set (metastases) (b) and in the core data sets (includes samples from all of the Dukes’ stages) (c) to FOLFIRI by applying published FOLFIRI response signatures using the NTP algorithm. In these analyses, statistics include only those samples that were predicted with FDR < 0.2. (d) CRC subtype–specific cell line response to FOLFIRI components. Namely, the combination of 5-FU (239 µM) and irinotecan (22.5 µM), plotted as percentage cellular proliferation and normalized to vehicle-treated cells. Error bars represent the s.d. of technical replicates from a representative experiment. *P < 0.05. TA, transit amplifying.
Figure 5
Figure 5
Summary, including clinically deployable markers and potential subtype-guided therapies for CRC. (a) Salient characteristics of the six CRC subtypes. Int, intermediate DFS; Either, either crypt top or base; NA, no clear association. (b) CRC subtype phenotypes correlated with colon-crypt location and Wnt signaling. (c) Summary of subtype-specific candidate biomarkers (CRCassigner-7) that were tested using qRT-PCR and immunohistochemistry (IHC), and (d) subtype guided therapeutic strategies suggested by the association studies. ZEB1 was not useful for qRT-PCR because ZEB1 is expressed both by fibroblast and tumor cells. The expression of ZEB1 specifically in tumor cells was evaluated using immunohistochemistry as in Figure 1c. TBD, to be determined.

Comment in

References

    1. Andre T, et al. CPT-11 (irinotecan) addition to bimonthly, high-dose leucovorin and bolus and continuous-infusion 5-fuorouracil (FOLFIRI) for pretreated metastatic colorectal cancer. GERCOR. Eur. J. Cancer. 1999;35:1343–1347. - PubMed
    1. Verhaak RG, et al. Integrated genomic analysis identifes clinically relevant subtypes of glioblastoma characterized by abnormalities in PDGFRA, IDH1, EGFR, and NF1. Cancer Cell. 2010;17:98–110. - PMC - PubMed
    1. Markert EK, Mizuno H, Vazquez A, Levine AJ. Molecular classifcation of prostate cancer using curated expression signatures. Proc. Natl. Acad. Sci. USA. 2011;108:21276–21281. - PMC - PubMed
    1. Perou CM, et al. Molecular portraits of human breast tumours. Nature. 2000;406:747–752. - PubMed
    1. Collisson EA, et al. Subtypes of pancreatic ductal adenocarcinoma and their differing responses to therapy. Nat. Med. 2011;17:500–503. - PMC - PubMed

Publication types

MeSH terms