. 2013 Jun;9(6):374-82.
doi: 10.1038/nchembio.1230. Epub 2013 Apr 14.

Chemical modulation of chaperone-mediated autophagy by retinoic acid derivatives

Affiliations

Chemical modulation of chaperone-mediated autophagy by retinoic acid derivatives

Jaime Anguiano et al. Nat Chem Biol. 2013 Jun.

Erratum in

  • Nat Chem Biol. 2013 Nov;9(11):746

Abstract

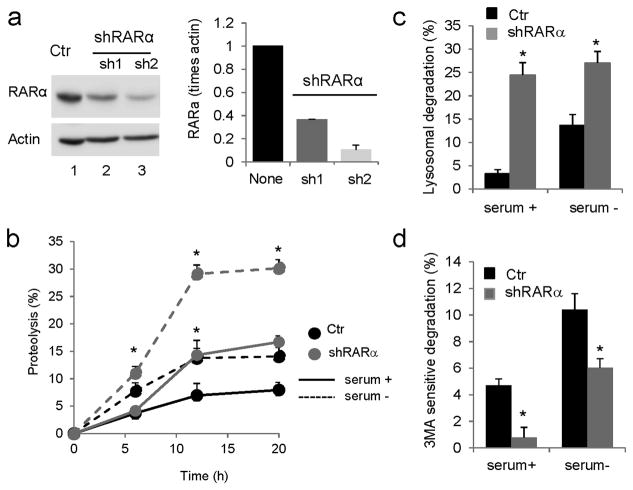
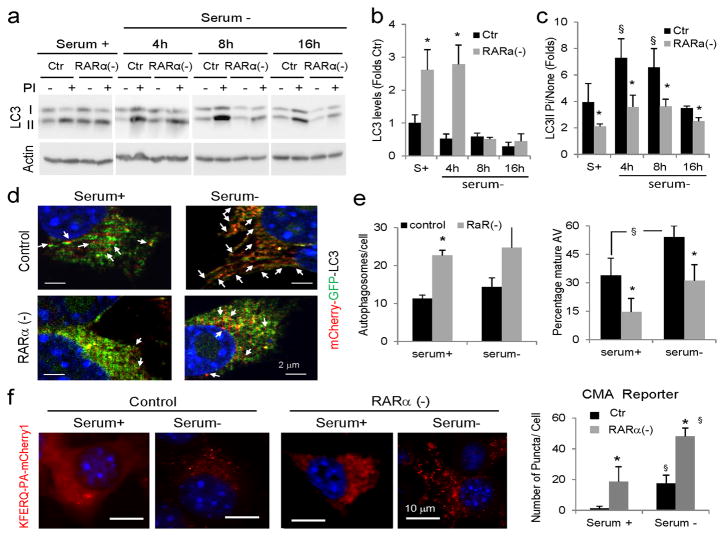
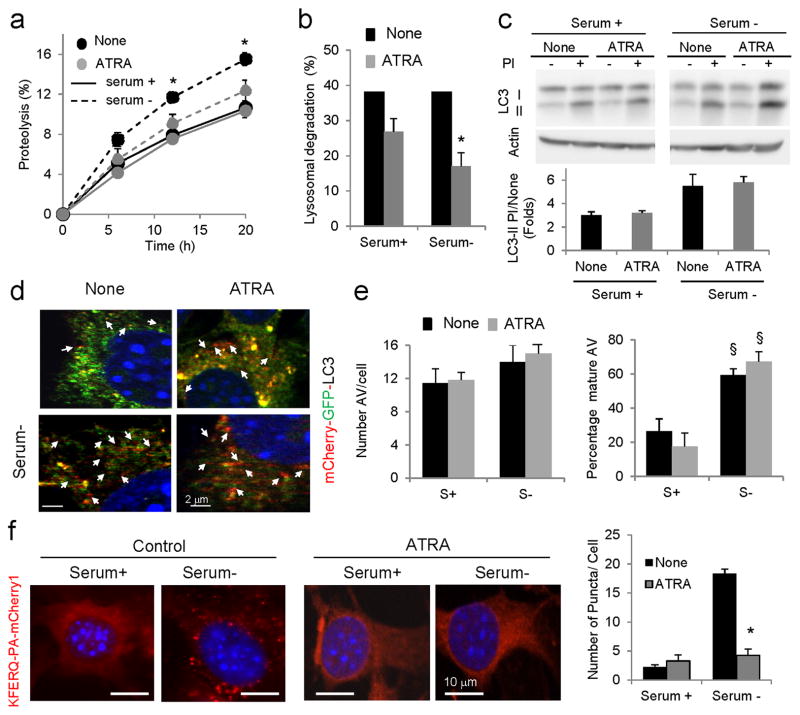
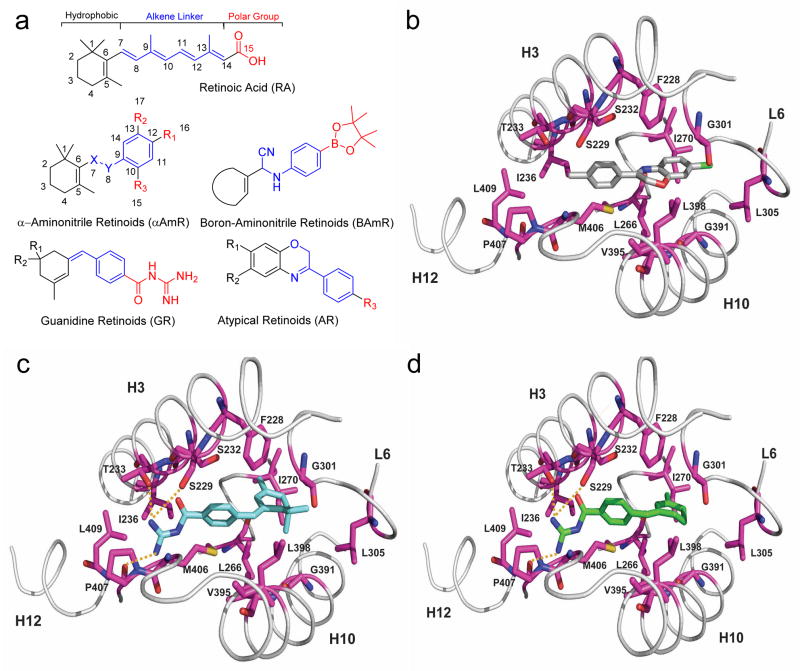
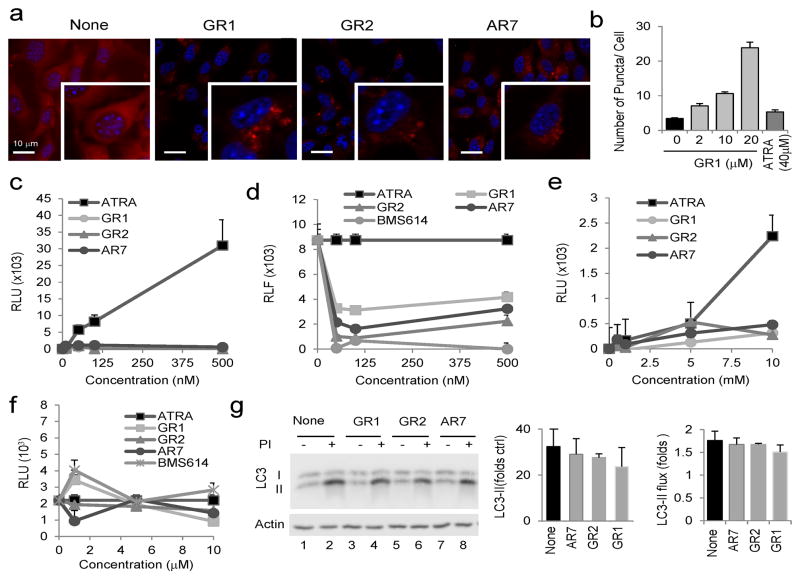
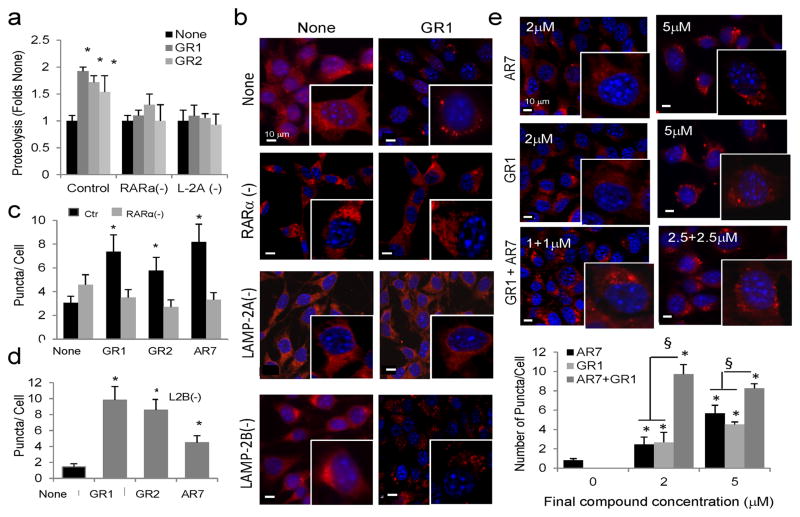
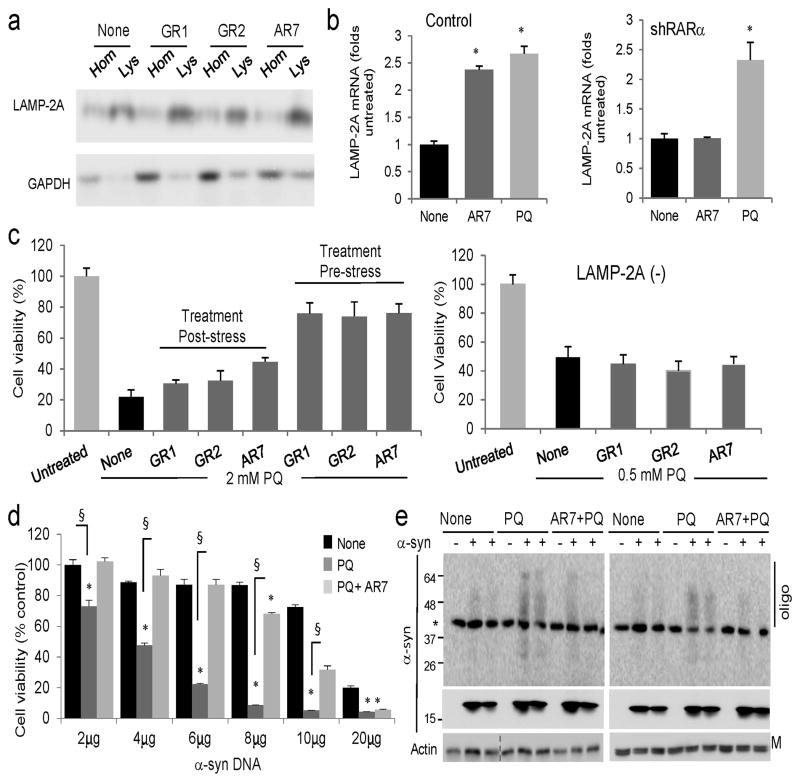
Chaperone-mediated autophagy (CMA) contributes to cellular quality control and the cellular response to stress through the selective degradation of cytosolic proteins in lysosomes. A decrease in CMA activity occurs in aging and in age-related disorders (for example, neurodegenerative diseases and diabetes). Although prevention of this age-dependent decline through genetic manipulation in mice has proven beneficial, chemical modulation of CMA is not currently possible, owing in part to the lack of information on the signaling mechanisms that modulate this pathway. In this work, we report that signaling through retinoic acid receptor α (RARα) inhibits CMA and apply structure-based chemical design to develop synthetic derivatives of all-trans-retinoic acid to specifically neutralize this inhibitory effect. We demonstrate that chemical enhancement of CMA protects cells from oxidative stress and from proteotoxicity, supporting a potential therapeutic opportunity when reduced CMA contributes to cellular dysfunction and disease.


Conflict of interest statement

Competing financial interests

The authors declare that they have no competing interests.

Figures

Figure 1
Figure 1. Effect of knockdown of RARα on intracellular turnover of long-lived proteins
(a) Knockdown of RARα in NIH3T3 mouse fibroblasts was conducted using two different shRNAs, sh1 and sh2. Ctr: control. Left: Representative immunoblot. Actin is shown as loading control and full-length blots are shown in Supplementary Figure 21. Right: Levels of RARα in control and knockdown cells determined by densitometric quantification of immunoblots represented by the one shown on the left. Values are normalized for actin and expressed as times control (none) values. (n=3) (b) Rates of degradation of long-lived proteins in control and RARα-knockdown cells maintained in the presence or absence of serum for 12 h. Values are expressed as percentage of proteolysis. (n=3) (c, d) Percentage of lysosomal (c) and macroautophagy (d) degradation in cells assayed as in b, but treated with inhibitors of lysosomal proteolysis (c) or with 3-methyladenine to block macroautophagy (d). Values are expressed as percentage of total protein degradation sensitive to the lysosomal inhibitors (n=3). All values are mean±S.E. and differences with control are significant for *p<0.05.
Figure 2
Figure 2. Effect of knockdown of RARα on autophagic pathways
(a) Immunoblot for LC3-II of mouse fibroblasts control (ctr) or knocked-down for RARα (RARα(−)) maintained in the presence or absence of serum for the indicated times. Where indicated, protease inhibitors (PI) against lysosomal proteolysis were added. Actin is shown as loading control. (b) Levels of LC3-II determined by densitometric quantification of immunoblots. Values are expressed as folds values in serum supplemented control cells (n=4). (c) Ratio of levels of LC3-II in cells treated with PI compared to untreated cells. Values are expressed as fold untreated (n=4). (d,e) Autophagic flux in the same cells expressing mCherry-GFP-LC3 and maintained in the presence or absence of serum: (d) representative merged channels images. Arrows: autolysosomes (red); (e) Quantification of number of autophagosomes (mCherry and GFP positive) per cell (left) and percentage of autolysosomes (mCherry positive and GFP negative; right) in > 50 cells in at least 4 different fields. (f) Control and RARα(−) cells were transfected with the KFERQ-mcherry1 photoactivable reporter and after photoactivation were maintained in media with or without serum. Left: representative images. Inset show higher magnification images. Right: Quantification of the number of puncta per cell in > 50 cells in at least 4 different fields. Nuclei are labeled with DAPI. All values are mean±S.E. Differences with control (*) or with serum supplemented cells (§) are significant for p<0.05. Full-field fluorescence images and full-length blots are shown in Supplementary Figures 2 and 21, respectively.
Figure 3
Figure 3. Effect of ATRA on autophagy
(a) Rates of degradation of long-lived proteins in mouse fibroblasts untreated (None) or treated with (40μM) ATRA and maintained in the presence or absence of serum. Values are expressed as a percentage of proteolysis. (n=3) (b) Percentage of lysosomal degradation calculated after treatment with inhibitors of lysosomal proteolysis for 12 h (n=3). (c) Immunoblot for LC3-II of the same cells maintained in the presence or absence of serum and protease inhibitors (PI). Left: representative immunoblot. Actin is shown as loading control. Bottom: Ratio of levels of LC3-II in cells treated with PI compared to untreated cells. Values are expressed as fold untreated (n=4). (d, e) Autophagic flux in untreated and ATRA-treated cells expressing mCherry-GFP-LC3 and maintained in the presence or absence of serum: (d) representative merged channels images. Arrows: autolysosomes (red); (e) Number of autophagosomes (left) and percentage of autolysosomes (right) after quantification of > 50 cells. (f) Mouse fibroblasts expressing the KFERQ-mcherry1 photoactivable reporter with or without ATRA and after photoactivation maintained in the presence or absence of serum. Left: Representative images. Nuclei are labeled with DAPI. Insets: high magnification images. Right: Quantification of the number of puncta per cell in > 50 cells. All values are mean±S.E. and differences with untreated (*) or with serum-supplemented cells (§) are significant for p<0.01. Full-field fluorescence images and full-length blots are shown in Supplementary Figures 3 and 21, respectively.
Figure 4
Figure 4. Design, synthesis and molecular docking of RARα-targeting compounds
(a) Molecular structure of ATRA (top) highlighting three different regions: the hydrophobic ring (black), the polyene linker “connector” (blue), and the carboxylic acid moiety (red). The basic structure of the four families of compounds generated through modifications of ATRA using structure-based chemical design strategies are shown. Numbering is shown in the retinoic acid and the α-aminonitrile retinoid backbone to indicate how these positions have been conserved in the new molecules. (b–d) Molecular docking of AR7 (b), GR1 (c) and GR2 (d) in the RARα-binding pocket. A close view of the RARα-binding pocket in ribbon (gray) and interacting residues in stick (magenta) for each compound docked in the lowest-energy conformation for docking pose I is shown. Compounds are docked to a hydrophobic region of the RARα-binding pocket formed by h3, h10 and h12. Hydrogen bonds are formed from the guanidinium group of GR1 and GR2 to side-chain hydroxyls of Ser229 and Thr233, and backbone carbonyl oxygen of Pro407 (yellow dotted lines).
Figure 5
Figure 5. Effect of the chemical activators of CMA on RARα activity
(a) Mouse fibroblasts expressing the KFERQ-mcherry1 photoactivable reporter with or without the indicated compounds (20μM) imaged 16 h after photoactivation. Insets: higher magnification images. Nuclei are labeled with DAPI. (b) Quantification of the effect of increasing concentrations of GR1 on the same cells. Untreated cells and cells treated with 40μM ATRA are also shown. Representative images are shown in Supplementary Figure 7. Graph shows the average number of fluorescent puncta per cell, quantified in > 50 cells. All values are mean±S.E. (c–f) Mouse fibroblasts were co-transfected with the hRARα receptor (c, d) or the hRXR receptor (e,f), a relevant reporter luciferase plasmid and the non-retinoid regulated renilla reporter to control for transfection. Values show luciferase units detected in cells subjected to: (c, e) the indicated concentrations of ATRA and the three retinoid derivatives for 12 h. (d, f) 100 nM (d) or 10 μM (f) ATRA alone (ATRA) or in the presence of the indicated concentrations of the three retinoid derivatives or the antagonist BMS614. Values show luciferase intensity expressed as percentage of that in cells treated only with ATRA and Kis are shown on the right (n=4–6). (g) Immunoblot for LC3 of cells treated with 20μM of the retinoid derivatives and protease inhibitors (PI), as labeled. Actin is shown as loading control and full-length blots are shown in Supplementary Figure 21. Levels of LC3-II in untreated cells (left) and increase after PI treatment (LC3-II flux) (right) were calculated from the densitometric quantification of immunoblots. Values are mean±S.E. (n=3).
Figure 6
Figure 6. Characterization of the effect of the retinoid derivatives on CMA
(a) Rates of degradation of long-lived proteins in mouse fibroblasts control or knocked-down (−) for RARα or for LAMP-2A and left untreated (None) or treated with (20μM) the indicated compounds. Values are expressed as fold-change in the proteolytic rate compared to untreated cells for each group. (n=3) (bd) Mouse fibroblasts control (Ctr) knocked-down (−) for RARα, LAMP-2A or LAMP-2B were transfected with the KFERQ-mcherry1 photoactivable reporter with or without the indicated compounds (20μM). (b) Representative fields and high magnification insets for GR1. Nuclei are labeled with DAPI. Representative fields for GR2 and AR7 are shown in Supplementary Figure 13. (c, d) Average number of fluorescent puncta per cell quantified in > 50 cells in at least 4 different fields. No puncta were detected in LAMP-2A(−) cells. (e) Mouse fibroblasts transfected with the KFERQ-mcherry1 photoactivable reporter with or without the indicated concentrations of AR7, GR1 or with both compounds to reach the same final concentration, as indicated. Top: Representative fields and high magnification insets. Nuclei are labeled with DAPI. Bottom: Quantification of the number of fluorescent puncta per field in each condition. Values are mean±s.em. (n > 50 cells). All values are mean±S.E. Differences with untreated samples (*) or between single and combined treatments (§) are significant for p<0.01.
Figure 7
Figure 7. Effect of the retinoid derivatives in the cellular response against different stressors
(a) Immunoblot for the indicated proteins in homogenates (Hom) and lysosomes (Lys) isolated from cells untreated (none) or treated for 12 h with 20μM of the indicated compounds. (b) mRNA levels of LAMP-2A in mouse fibroblasts control (Ctr) or knocked down (−) for RARα, and treated with AR7 or paraquat (PQ) as in a (n=4–5). (c) Cellular viability of control (left) or LAMP-2A(−) (right) fibroblasts exposed to 2 mM or 0.5 mM PQ, respectively, and treated with the indicated compounds for 12 h before or after the PQ treatment. (n=3). (d) Viability of mouse fibroblasts transfected with the indicated concentrations of a plasmid encoding α-synuclein and left untreated (none) or treated with 1 mM PQ alone or in the presence of 20μM AR7. (n=3). (e) Immunoblot for α-synuclein in the same cells as d. Top: higher exposure blot to highlight oligomeric (Oligo) species. *nonspecific band. M: monomer; All values are mean±S.E. Differences with cells untreated (*) or treated only with PQ (§) were significant for p<0.001. Full-length blots are shown in Supplementary Figure 21.

References

    1. Mizushima N, Levine B, Cuervo AM, Klionsky DJ. Autophagy fights disease through cellular self-digestion. Nature. 2008;451:1069–75. - PMC - PubMed
    1. Yang Z, Klionsky DJ. An overview of the molecular mechanism of autophagy. Curr Top Microbiol Immunol. 2009;335:1–32. - PMC - PubMed
    1. Mizushima N. Autophagy in Protein and Organelle Turnover. Cold Spring Harb Symp Quant Biol. 2011 - PubMed
    1. Wong E, Cuervo AM. Autophagy gone awry in neurodegenerative diseases. Nature Neuroscience. 2010;13:805–811. - PMC - PubMed
    1. Arias E, Cuervo AM. Chaperone-mediated autophagy in protein quality control. Curr Opin Cell Biol. 2010;23:184–9. - PMC - PubMed

Publication types