. 2013 May 1;41(10):5189-98.
doi: 10.1093/nar/gkt211. Epub 2013 Apr 12.

Accurate detection of differential RNA processing

Affiliations

Accurate detection of differential RNA processing

Philipp Drewe et al. Nucleic Acids Res. .

Abstract

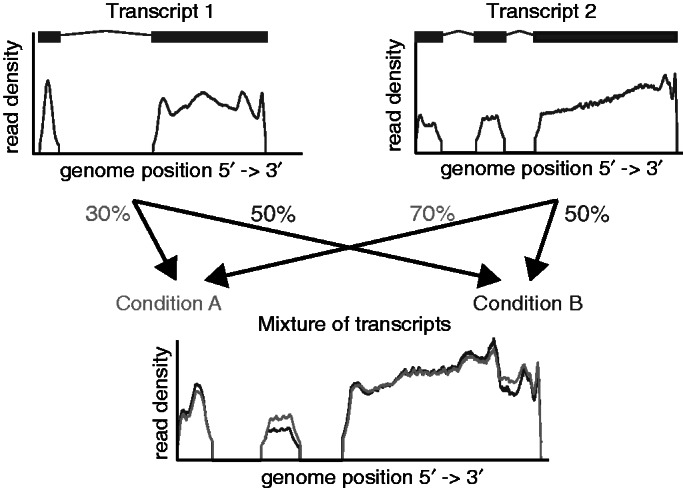
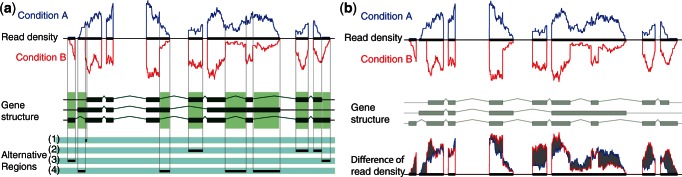
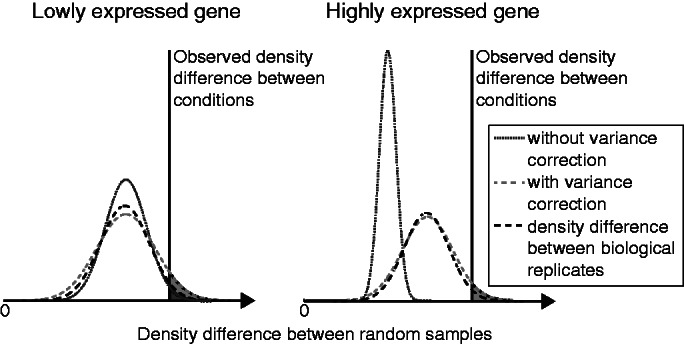
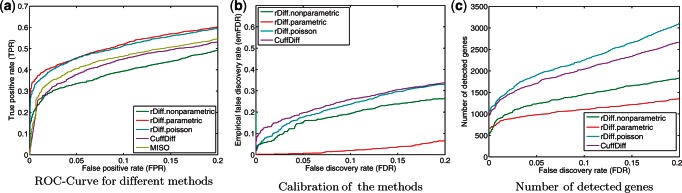
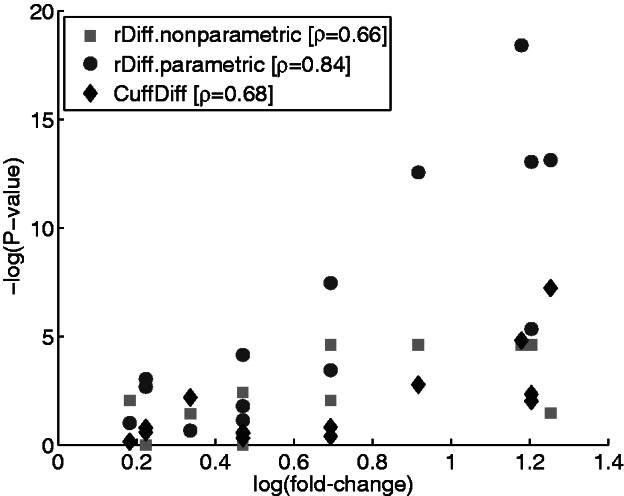
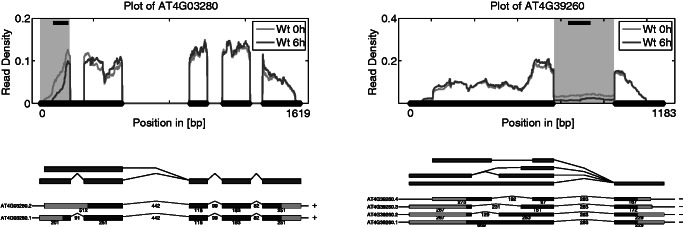
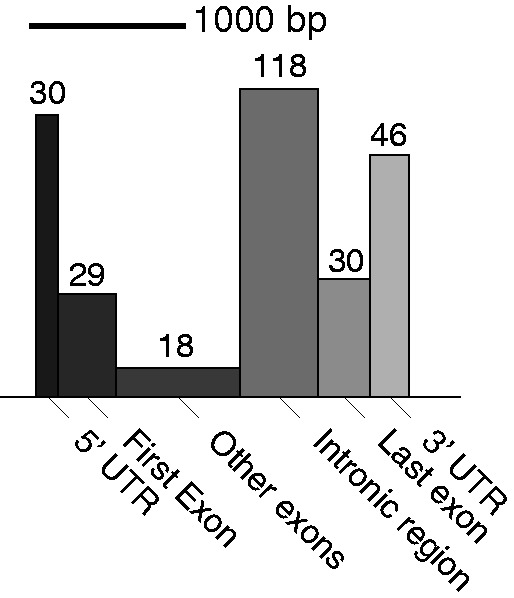
Deep transcriptome sequencing (RNA-Seq) has become a vital tool for studying the state of cells in the context of varying environments, genotypes and other factors. RNA-Seq profiling data enable identification of novel isoforms, quantification of known isoforms and detection of changes in transcriptional or RNA-processing activity. Existing approaches to detect differential isoform abundance between samples either require a complete isoform annotation or fall short in providing statistically robust and calibrated significance estimates. Here, we propose a suite of statistical tests to address these open needs: a parametric test that uses known isoform annotations to detect changes in relative isoform abundance and a non-parametric test that detects differential read coverages and can be applied when isoform annotations are not available. Both methods account for the discrete nature of read counts and the inherent biological variability. We demonstrate that these tests compare favorably to previous methods, both in terms of accuracy and statistical calibrations. We use these techniques to analyze RNA-Seq libraries from Arabidopsis thaliana and Drosophila melanogaster. The identified differential RNA processing events were consistent with RT-qPCR measurements and previous studies. The proposed toolkit is available from http://bioweb.me/rdiff and enables in-depth analyses of transcriptomes, with or without available isoform annotation.


Figures

Figure 1.
Figure 1.
On the top, two transcripts are shown together with the read density one would observe if they were present isolated from each other. On the bottom, the read densities for two mixtures of the transcripts are shown. The mixture for the conditions A (light gray) and B (dark gray) is different, which is reflected by the difference of the read densities.
Figure 2.
Figure 2.
(a) The alternative regions used by rDiff.parametric. Alternative regions are defined as regions in the genome that are not contained in all transcripts of a gene but at least one, according to the gene structure. In a second step, all regions are merged, which are in the same subgroups of transcripts, to obtain the so-called alternative regions. (b) Test statistic used by rDiff.nonparametric. Shown are the two read densities in the two conditions A and B and their difference in gray and the underlying gene structure in light green.
Figure 3.
Figure 3.
Illustration of variance of the read density difference (see gray area in Figure 2b) between random samples from the null distribution. The distribution difference between two biological samples is shown as a dashed black curve, the one between two random samples when not correcting for biological variance in dark gray dashed and when correcting for biological variance in light gray dashed. The resulting P-value for rDiff.nonparametric corresponds to the gray area of surface, which is the fraction of random samples that have a bigger difference than the difference observed between the two conditions. For highly expressed genes, when not correcting for biological variance, the density difference between random samples converges to zero, thus leading to an unrealistically small P-value.
Figure 4.
Figure 4.
Comparison of rDiff with MISO and CuffDiff. (a) ROC curve for rDiff, MISO and CuffDiff. (b) Comparison of the empirical false discovery rate (empFDR) and the FDR based on P-values provided by the methods, for rDiff and CuffDiff. This was not possible for MISO, as it did not provide P-values. (c) Number of detected genes as a function of the FDR cut-off.
Figure 5.
Figure 5.
Plot of the −log(P-value) against the log(fold-change) measured by RT-qPCR. The P-values for rDiff.nonparametric are shown in light gray, for rDiff.parametric in dark gray and for CuffDiff in black. Spearman’s correlation coefficient ρ for the two methods is given in the legend.
Figure 6.
Figure 6.
Examples of two genes detected by rDiff.nonparametric with a minimal P-value of 0.01. Shown is the read density on top. The gray area indicates the region in which the change was detected, and the black bar in the upper part of the plot shows the 100-bp region which showed the biggest difference. Below the read densities is the splice graph in dark gray and the transcripts in black. The light gray indicates the UTRs.
Figure 7.
Figure 7.
Categorization of the most differential 100 bp between the time points 0 h and 1 h according to the gene structure, in genes detected by rDiff.nonparametric with an FDR smaller than 10%. The width of the boxes is the average length of those regions, and the area equals the total number of detected differential cases.

References

    1. Wang Z, Gerstein M, Snyder M. RNA-Seq: a revolutionary tool for transcriptomics. Nat. Rev. Genet. 2009;10:57–63. - PMC - PubMed
    1. Mortazavi A, Williams BA, McCue K, Schaeffer L, Wold B. Mapping and quantifying mammalian transcriptomes by RNA-Seq. Nat. Methods. 2008;5:621–628. - PubMed
    1. Marioni J, Mason C, Mane S, Stephens M, Gilad Y. RNA-seq: an assessment of technical reproducibility and comparison with gene expression arrays. Genome Res. 2008;18:1509–1517. - PMC - PubMed
    1. Wang L, Feng Z, Wang X, Wang X, Zhang X. DEGseq: an R package for identifying differentially expressed genes from RNA-seq data. Bioinformatics. 2010;26:136–138. - PubMed
    1. Robinson MD, Smyth GK. Moderated statistical tests for assessing differences in tag abundance. Bioinformatics. 2007;23:2881–2887. - PubMed

Publication types

MeSH terms