

Evolution of pan-genomes of Escherichia coli, Shigella spp., and Salmonella enterica
- PMID: 23585535
- PMCID: PMC3697250
- DOI: 10.1128/JB.02285-12
Evolution of pan-genomes of Escherichia coli, Shigella spp., and Salmonella enterica
Abstract
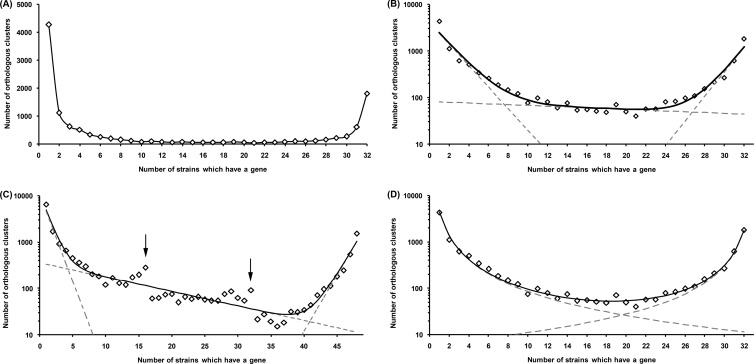
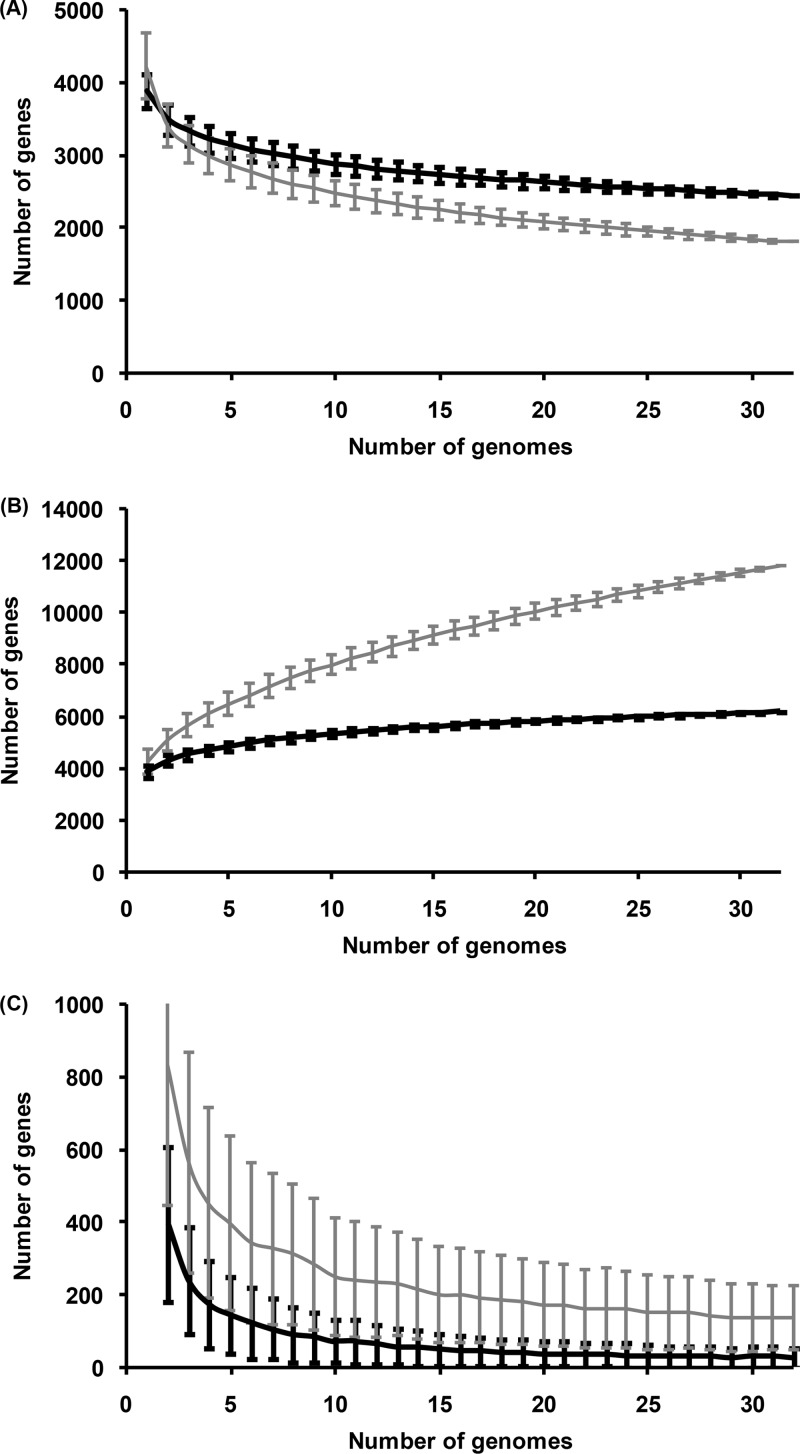
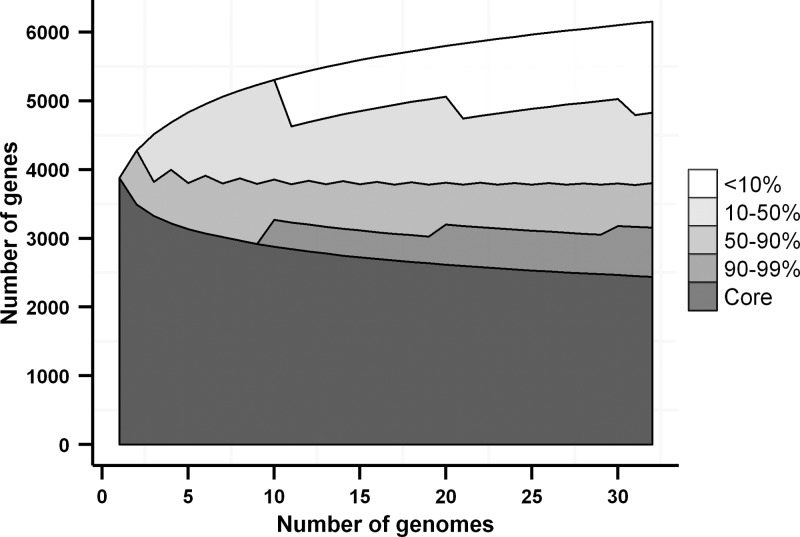
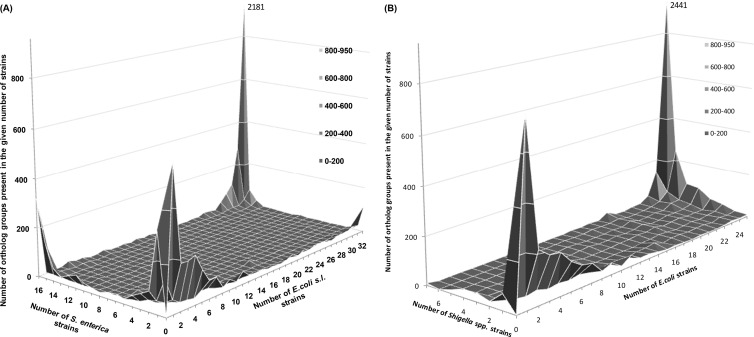
Multiple sequencing of genomes belonging to a bacterial species allows one to analyze and compare statistics and dynamics of the gene complements of species, their pan-genomes. Here, we analyzed multiple genomes of Escherichia coli, Shigella spp., and Salmonella enterica. We demonstrate that the distribution of the number of genomes harboring a gene is well approximated by a sum of two power functions, describing frequent genes (present in many strains) and rare genes (present in few strains). The virtual absence of Shigella-specific genes not present in E. coli genomes confirms previous observations that Shigella is not an independent genus. While the pan-genome size is increasing with each new strain, the number of genes present in a fixed fraction of strains stabilizes quickly. For instance, slightly fewer than 4,000 genes are present in at least half of any group of E. coli genomes. Comparison of S. enterica and E. coli pan-genomes revealed the existence of a common periphery, that is, genes present in some but not all strains of both species. Analysis of phylogenetic trees demonstrates that rare genes from the periphery likely evolve under horizontal transfer, whereas frequent periphery genes may have been inherited from the periphery genome of the common ancestor.
Figures
Similar articles
-
A phylogenomic analysis of Escherichia coli / Shigella group: implications of genomic features associated with pathogenicity and ecological adaptation.BMC Evol Biol. 2012 Sep 7;12:174. doi: 10.1186/1471-2148-12-174. BMC Evol Biol. 2012. PMID: 22958895 Free PMC article.
-
Investigating the Relatedness of Enteroinvasive Escherichia coli to Other E. coli and Shigella Isolates by Using Comparative Genomics.Infect Immun. 2016 Jul 21;84(8):2362-2371. doi: 10.1128/IAI.00350-16. Print 2016 Aug. Infect Immun. 2016. PMID: 27271741 Free PMC article.
-
Detection and Identification of Salmonella enterica, Escherichia coli, and Shigella spp. via PCR-electrospray ionization mass spectrometry: isolate testing and analysis of food samples.Appl Environ Microbiol. 2012 Dec;78(23):8403-11. doi: 10.1128/AEM.02272-12. Epub 2012 Sep 21. Appl Environ Microbiol. 2012. PMID: 23001674 Free PMC article.
-
The genomic signatures of Shigella evolution, adaptation and geographical spread.Nat Rev Microbiol. 2016 Apr;14(4):235-50. doi: 10.1038/nrmicro.2016.10. Epub 2016 Feb 29. Nat Rev Microbiol. 2016. PMID: 26923111 Review.
-
Comparison of 61 sequenced Escherichia coli genomes.Microb Ecol. 2010 Nov;60(4):708-20. doi: 10.1007/s00248-010-9717-3. Epub 2010 Jul 11. Microb Ecol. 2010. PMID: 20623278 Free PMC article. Review.
Cited by
-
PAN2HGENE-tool for comparative analysis and identifying new gene products.PLoS One. 2021 May 28;16(5):e0252414. doi: 10.1371/journal.pone.0252414. eCollection 2021. PLoS One. 2021. PMID: 34048479 Free PMC article.
-
Why? - Successful Pseudomonas aeruginosa clones with a focus on clone C.FEMS Microbiol Rev. 2020 Nov 24;44(6):740-762. doi: 10.1093/femsre/fuaa029. FEMS Microbiol Rev. 2020. PMID: 32990729 Free PMC article. Review.
-
Epi-Gene: An R-Package for Easy Pan-Genome Analysis.Biomed Res Int. 2021 Sep 20;2021:5585586. doi: 10.1155/2021/5585586. eCollection 2021. Biomed Res Int. 2021. Retraction in: Biomed Res Int. 2024 Mar 20;2024:9830450. doi: 10.1155/2024/9830450. PMID: 34595238 Free PMC article. Retracted.
-
Different evolutionary trends form the twilight zone of the bacterial pan-genome.Microb Genom. 2021 Sep;7(9):000670. doi: 10.1099/mgen.0.000670. Microb Genom. 2021. PMID: 34559043 Free PMC article.
-
Horizontally Acquired Genes Are Often Shared between Closely Related Bacterial Species.Front Microbiol. 2017 Aug 25;8:1536. doi: 10.3389/fmicb.2017.01536. eCollection 2017. Front Microbiol. 2017. PMID: 28890711 Free PMC article.
References
-
- Welch RA, Burland V, Plunkett G, III, Redford P, Roesch P, Rasko D, Buckles EL, Liou SR, Boutin A, Hackett J, Stroud D, Mayhew GF, Rose DJ, Zhou S, Schwartz DC, Perna NT, Mobley HL, Donnenberg MS, Blattner FR. 2002. Extensive mosaic structure revealed by the complete genome sequence of uropathogenic Escherichia coli. Proc. Natl. Acad. Sci. U. S. A. 99:17020–17024 - PMC - PubMed
-
- Tettelin H, Masignani V, Cieslewicz MJ, Donati C, Medini D, Ward NL, Angiuoli SV, Crabtree J, Jones AL, Durkin AS, Deboy RT, Davidsen TM, Mora M, Scarselli M, Margarit y Ros I, Peterson JD, Hauser CR, Sundaram JP, Nelson WC, Madupu R, Brinkac LM, Dodson RJ, Rosovitz MJ, Sullivan SA, Daugherty SC, Haft DH, Selengut J, Gwinn ML, Zhou L, Zafar N, Khouri H, Radune D, Dimitrov G, Watkins K, O'Connor KJ, Smith S, Utterback TR, White O, Rubens CE, Grandi G, Madoff LC, Kasper DL, Telford JL, Wessels MR, Rappuoli R, Fraser CM. 2005. Genome analysis of multiple pathogenic isolates of Streptococcus agalactiae: implications for the microbial “pan-genome”. Proc. Natl. Acad. Sci. U. S. A. 102:13950–13955 - PMC - PubMed
-
- Lapierre P, Gogarten JP. 2009. Estimating the size of the bacterial pan-genome. Trends Genet. 25:107–110 - PubMed
-
- Rasko DA, Rosovitz MJ, Myers GS, Mongodin EF, Fricke WF, Gajer P, Crabtree J, Sebaihia M, Thomson NR, Chaudhuri R, Henderson IR, Sperandio V, Ravel J. 2008. The pangenome structure of Escherichia coli: comparative genomic analysis of E. coli commensal and pathogenic isolates. J. Bacteriol. 190:6881–6893 - PMC - PubMed
Publication types
MeSH terms
LinkOut - more resources
Full Text Sources
Other Literature Sources
Miscellaneous
