. 2013 May 15;190(10):4971-81.
doi: 10.4049/jimmunol.1202625. Epub 2013 Apr 12.

Local "on-demand" generation and function of antigen-specific Foxp3+ regulatory T cells

Affiliations

Local "on-demand" generation and function of antigen-specific Foxp3+ regulatory T cells

Scott W McPherson et al. J Immunol. .

Abstract

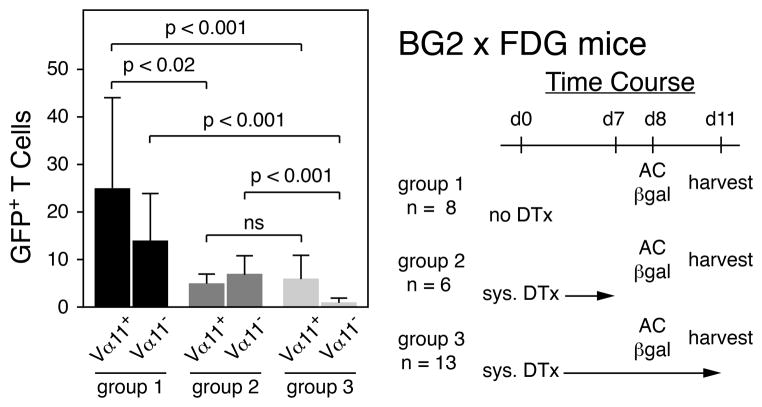
Extrathymically derived regulatory T cells (iTregs) protect against autoimmunity to tissue-specific Ags. However, whether Ag-specific iTreg generation and function is limited to secondary lymphoid tissue or whether it can occur within the tissue-specific local environment of the cognate Ag remains unresolved. Mice expressing β-galactosidase (βgal) on a retina-specific promoter (βgal mice) in conjunction with mice expressing GFP and diphtheria toxin (DTx) receptor (DTR) under control of the Foxp3 promoter, and βgal-specific TCR transgenic (BG2) mice were used to examine this question. Local depletion (ocular DTx), but not systemic depletion (i.p. DTx), of βgal-specific iTregs enhanced experimental autoimmune uveoretinitis induced by activated βgal-specific effector T cells. Injections of small amounts of βgal into the anterior chamber of the eye produced similar numbers of βgal-specific iTregs in the retina whether the mouse was depleted of pre-existing, circulating Tregs. Taken together, these results suggest that protection from tissue-specific autoimmunity depends on the function of local Ag-specific iTregs and that the retina is capable of local, "on-demand" iTreg generation that is independent of circulating Tregs.


Figures

Figure 1
Figure 1
Analysis of βgal specific T cells and TCR-Tg mice. A. Representative FACS analysis of CD3+ splenocytes for the clonotypic TCR (Vα11) from BG2 mice and control B6 mice. Percent of CD3+ cells positive for CD4 and Vα11 is given. B. FACS analysis of BG2 T cells for surface molecules associated with activation. Lymphocytes were gated on CD4+Vα11+ cells and then analyzed for the indicated surface marker. Representative FACS plots shown with mean percentage (n = 4) of cells having a naïve (N) or activated (A) phenotype indicated. For immunized BG2 mice, lymphocytes were obtained from draining inguinal LN five days post- immunization with βgal. C. In vitro cytokine production. BG2 lymphocytes from naïve mice were cultured with and without βgal stimulation. Results are given as mean ± SD, n = 3. D. Inhibition of CD4+ T cell-induced DTH by retinal βgal. Ear swelling assays of BG2 vs. BG2-βgal mice. Results are given as mean ± SD. E. Representative photomicrographs of autoimmune pathology in the eyes of B6-arrβgal mice induced by the transfer of activated BG2 T cells. The peripheral edge (a) and optic nerve head (b) of control retinas and the same regions in diseased eyes (c, d) are shown. The frequency of disease and the average score of diseased eyes is indicated. 20× magnification. F. Comparison of Tregs levels in BG2 and BG2-βgal mice. Splenocytes were gated on CD4+Vα11+ cells and analyzed for CD25 and FoxP3. Representative FACS plots shown with mean percentage of CD25+FoxP3+ cells indicated (n = 3). G. Association of FoxP3+ T cells with the Vα11-− phenotype in BG2 mice. Lymphocytes from blood were gated on CD3+CD4+ cells and then analyzed for Vα11 and GFP expression. Representative FACS plots shown with average percent of GFP+ cells within the Vα11 and Vα11+ T cells populations indicated (n = 20). Where indicated p values were determined by t test.
Figure 2
Figure 2
Only local depletion of Tregs induces EAU. A. Induction of EAU in FDG-βgal mice following transfer of activated BG2 x FDG T cells and treatment with DTx. Transferred and non-transferred control mice were given 3 × 25 ng of DTx per week into the right AC starting the day of T cell transfer or 250 ng of DTx i.p. on days 0, 2, 5, and 12 after transfer. Eyes were harvested 22 days post-transfer. B. Analysis of circulating Treg levels in FDG-βgal mice transferred with activated BG2 x FDG T cells and given DTx into the right AC or systemic DTx. AC injected mice were analyzed at one week (3 × 25 ng DTx) or two weeks (6 × 25 ng DTx) post-transfer and were compared to normal FDG-βgal mice. Mice receiving systemic DTx were given 250 ng on days 0, 2, and 5 post transfer and were analyzed day 6 post-transfer. Results are given as mean ± SD.
Figure 3
Figure 3
Local Treg depletion and induction of EAU in FDG-βgal mice immunized with βgal. A. Immunized FDG-βgal mice received right AC injections of DTx starting the day of immunization. DTx dose, frequency, and time to EAU analysis are indicated. Mean EAU score ± SD for all right (ipsilateral) eyes is indicated. For mice analyzed at two and three weeks, p > 0.05 comparing groups of ipsilateral eyes and p < 0.001 comparing ipsilateral to contralateral eyes (Mann-Whitney test). B. Induction of EAU in immunized B6-βgal mice given DTx into the right AC and in immunized FDG-βgal mice not receiving DTx. DTx dose, frequency, and time to EAU analysis are indicated. p values determined by Mann-Whitney test. C. Analysis of immunized FDG-βgal mice receiving right AC saline (1 μL, 3× per week), right cheek DTx (25 ng, 3× per week), systemic DTx (250 ng i.p. on days 0, 2, 5, and 12 days post-immunization for two week mice and on days 0, 3, 6, 10, and 14 for three week mice), and systemic DTx for two weeks plus right AC saline injections. All eyes were analyzed for EAU at the indicated time.
Figure 4
Figure 4
Local Treg depletion does not alter the level or function of peripheral Tregs. A. Analysis of Treg levels in proximal and distal secondary lymphoid tissue following βgal immunization and DTx treatment of FDG-βgal mice. Dose and timing of DTx treatments were as described (Fig. 3). Mice were analyzed two weeks post-immunization. B. Analysis of DTH response following DTx treatment. βgal immunized FDG-βgal mice were given saline or 25 ng DTx into the right AC (3× per week, two weeks), challenged with βgal in both ears, and analyzed 24 h later (Top).βgal immunized FDG mice were given 250 ng DTx i.p. on days 0, 2, and 5 post-immunization, then ear tested with βgal on day 6 post-immunization and analyzed 24 hr later (Bottom). Results are given as mean ± SD.
Figure 5
Figure 5
Analysis of the retinal T cell response to AC injections of Ag. FG and BG2 x FG mice were injected in the right AC with 1 μl of saline or 20 μg of βgal in final volume of 1 μl. The retinas from the right eyes were harvest at the indicated times and the retinal T cells were analyzed by FACS as shown in supplement Fig. 1. Rag−/− mice are shown as a control for the specificity of the T cell analysis (see supplement Fig. 1). A. Total retinal T cells. B. Retinal GFP T cells analyzed for Vα11. C. Retinal Tregs (GFP+ T cells) analyzed for Vα11. Results given as mean ± SD for each group, n for all groups indicated, p values determined by t test comparing GFPVα11+ and GFP+Vα11+ T cells numbers in saline vs.βgal injected eyes indicated.
Figure 6
Figure 6
Local generation of Ag-specific Tregs. A. BG2 x FDG mice were or were not treated with DTx (250 ng i.p., days −4 and −;2) and then were given 20 μg βgal or saline (1 μL) into the AC (day 0). Control mice received no DTx and βgal while day 0 mice received DTx only. Mice were analyzed for retinal and circulating T cells on day 0 (control and DTx only mice) and day 3 (AC βgal or saline). B. Representative FACS plots of CD45+CD3+ gated retinal T cells (day 3) with number of retinal T cells having each phenotype indicated. C. Composite analysis of number and Vα11 phenotype of retinal GFP+ and GFPT cells of control, day 0, and day 3 mice. D. Analysis of circulating T cells for Vα11 and GFP (left) and comparison of the percent of Tregs that are Vα11+ in the retina vs. the blood on day 3 (right). For all analysis, the results are given as mean ± SD with p values determined by t test, * = p < 0.05, ** = p < 0.01.
Figure 7
Figure 7
Analysis of T cells response in blood and retina to the potential efflux of βgal from the AC. A. BG2 x FDG mice were or were not given 250 ng DTx i.p. on day −;4 and day −2 and 20 μgβgal i.v. on day 0. B. Analysis of circulating Tregs. T cells from blood were analyzed on day 0 and day 3 by FACS for GFP and Vα11 expression. Representative FACS plots of CD3+CD4+ gated lymphocytes from day 0 analysis is shown with percentage of CD3+CD4+ lymphocytes being GFP+Vα11 or GFP+Vα11+ indicated (top). Composite analysis showing percent of CD4+ T cell being GFP+Vα11 or GFP+Vα11+ T cells at day 0 and day 3 (bottom). C. Analysis of retinal T cells. Retinas were analyzed for T cells on day 3 post-βgal injection. Representative FACS plots with number and phenotype of retinal T cells indicated (top). Composite analysis of retinal T cells for number and phenotype (bottom). For all composite analysis, the results are given as mean ± SD with p values determined by t test, * = p < 0.05, ** = p < 0.01.
Figure 8
Figure 8
Continual generation of Ag-specific Tregs in the retina. BG2 x FDG mice received no DTx or daily i.p. injections of 50 ng DTx through day 7 or 11 and 20 μg βgal into the AC on day 8. Retinas were analyzed by FACS for Tregs on day 11. For all analysis, results are given as mean ± SD with p values determined by t test.
Figure 9
Figure 9
T cell and myeloid cell analysis of ipsi- and contralateral retinas following EAU induction by immunization and AC DTx. BG2 x FDG-βgal mice were immunized with βgal (day 0) and given 25 ng doses of DTx into the right (ipsilateral) AC on days 0, 2, 5, 7, and 9. Ipsi- and contralateral retinas from immunized mice were analyzed by FACS on day 12 along with control retinas from normal BG2 x FDG-βgal mice and Rag−/− mice. Normal Rag−/− mice were used as controls for setting flow cytometry gating. Results are given as mean ± SD with p values determined by t test, * = p < 0.05, nd = none detected.

References

    1. Shevach EM. From vanilla to 28 flavors: multiple varieties of T regulatory cells. Immunity. 2006;25:19–201. - PubMed
    1. Jutel M, Akdis CA. T-cell regulatory mechanisms in specific immunotherapy. Chem Immunol Allergy. 2008;94:158–177. - PubMed
    1. Derbinski J, Schulte A, Kyewski B, Klein L. Promiscuous gene expression in medullary thymic epithelial cells mirrors the peripheral self. Nat Immunol. 2001;2:1032–1039. - PubMed
    1. Anderson MS, Venanzi ES, Klein L, Chen Z, Berzins S, Turley SJ, Von Boehmer H, Bronson R, Dierich A, Benoist C, Mathis D. Projection of an immunological self-shadow within the thymus by the aire protein. Science. 2002;298:1395–1401. - PubMed
    1. Liston A, Lesage S, Wilson J, Peltonen L, Goodnow CC. Aire regulates negative selection of organ-specific T cells. Nat Immunol. 2003;4:350–354. - PubMed

Publication types

MeSH terms

Substances