. 2013 Apr 9;8(4):e61535.
doi: 10.1371/journal.pone.0061535. Print 2013.

Non ionising radiation as a non chemical strategy in regenerative medicine: Ca(2+)-ICR "In Vitro" effect on neuronal differentiation and tumorigenicity modulation in NT2 cells

Affiliations

Non ionising radiation as a non chemical strategy in regenerative medicine: Ca(2+)-ICR "In Vitro" effect on neuronal differentiation and tumorigenicity modulation in NT2 cells

Mario Ledda et al. PLoS One. .

Abstract

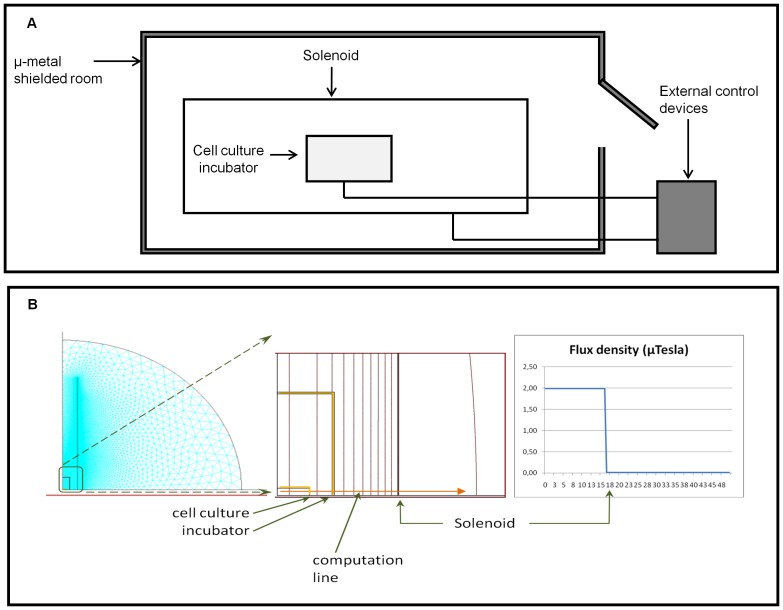
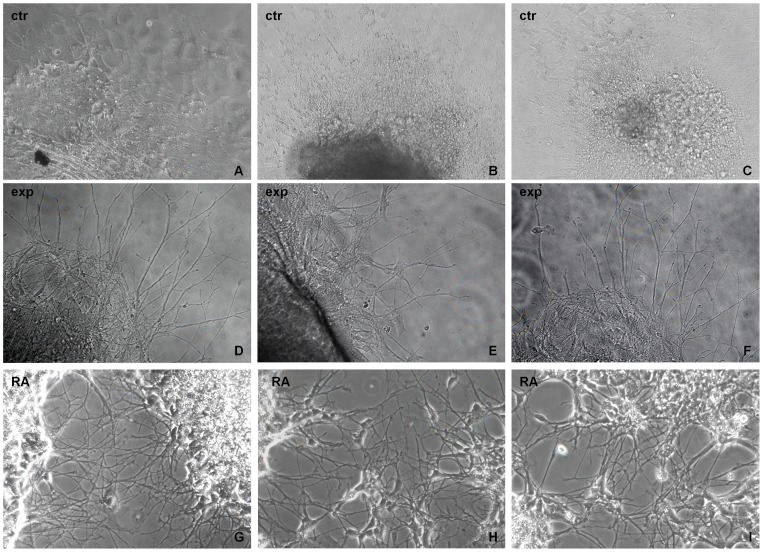
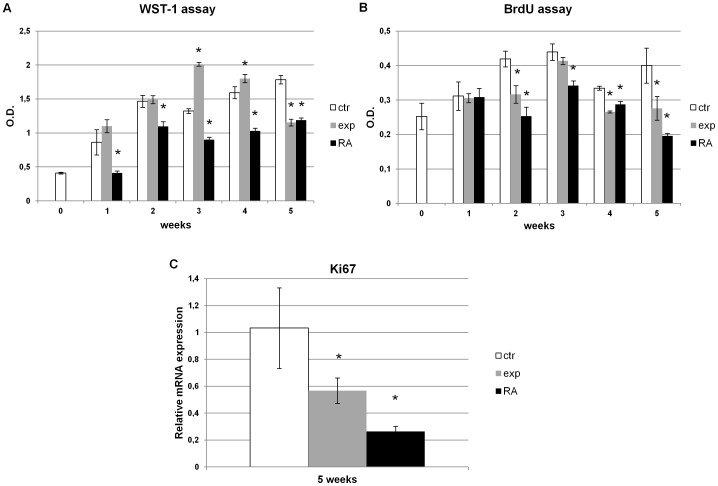
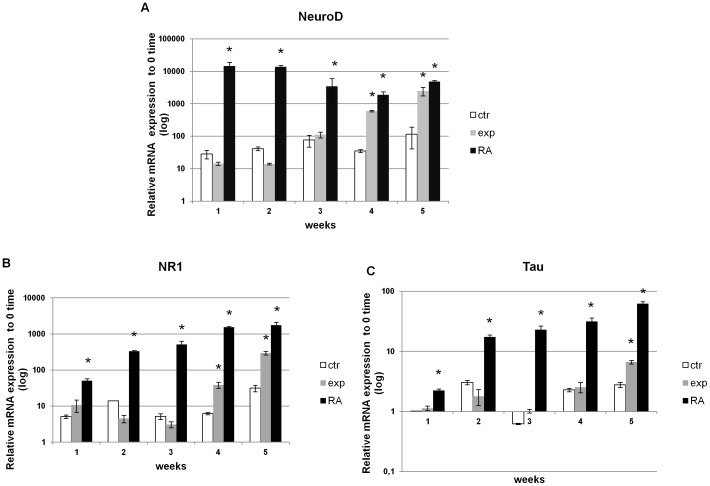
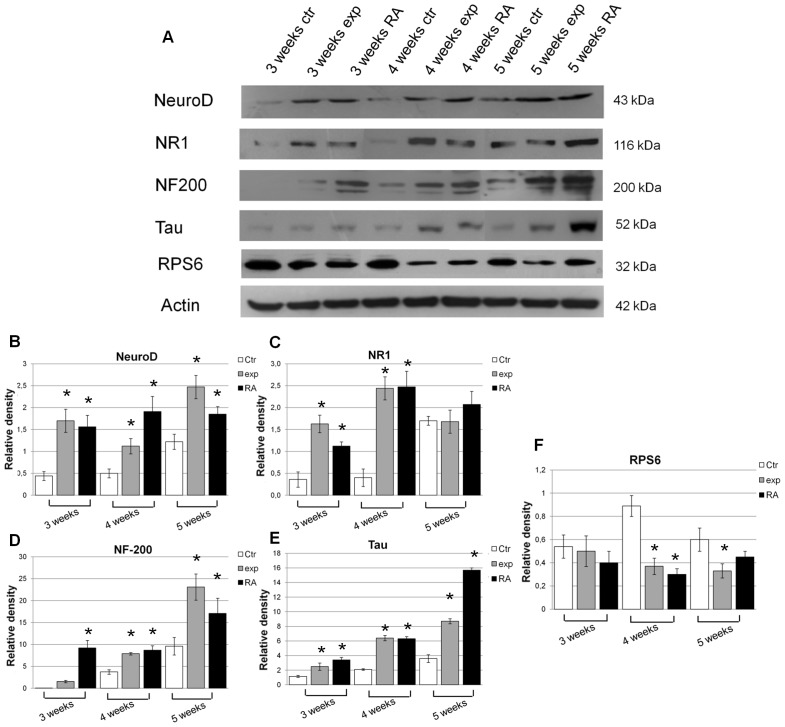
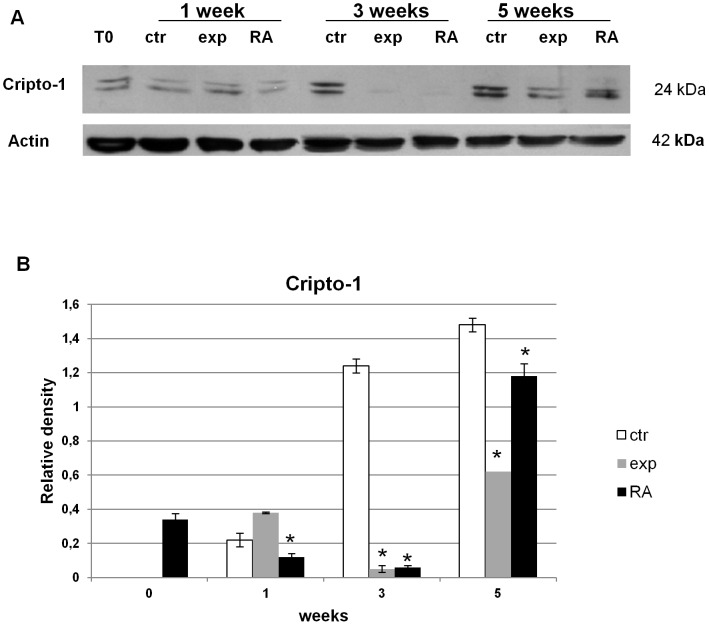
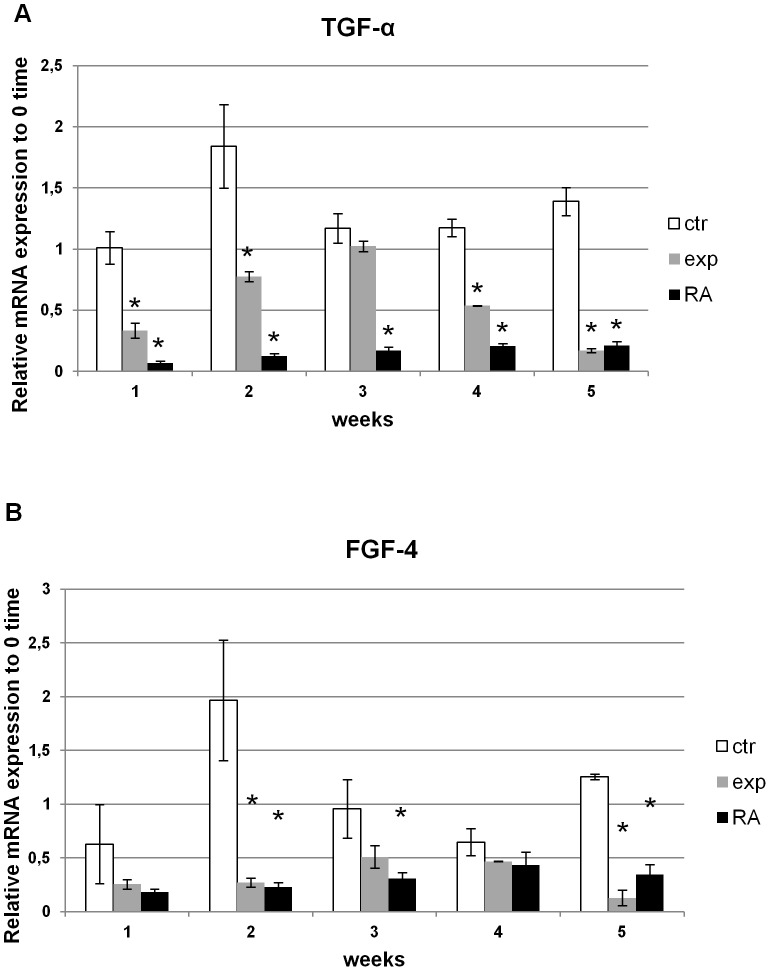
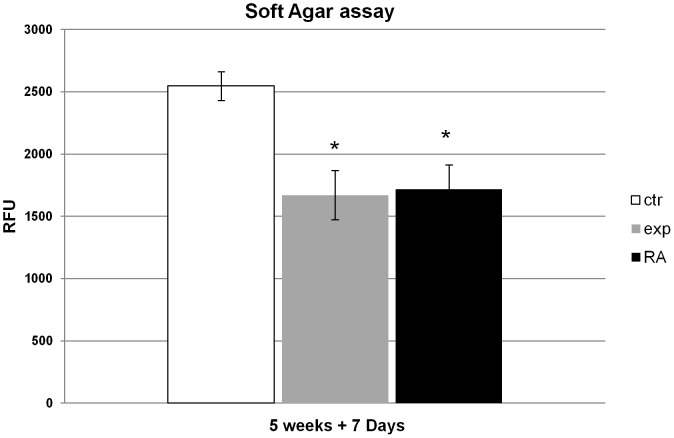
In regenerative medicine finding a new method for cell differentiation without pharmacological treatment or gene modification and minimal cell manipulation is a challenging goal. In this work we reported a neuronal induced differentiation and consequent reduction of tumorigenicity in NT2 human pluripotent embryonal carcinoma cells exposed to an extremely low frequency electromagnetic field (ELF-EMF), matching the cyclotron frequency corresponding to the charge/mass ratio of calcium ion (Ca(2+)-ICR). These cells, capable of differentiating into post-mitotic neurons following treatment with Retinoic Acid (RA), were placed in a solenoid and exposed for 5 weeks to Ca(2+)-ICR. The solenoid was installed in a μ-metal shielded room to avoid the effect of the geomagnetic field and obtained totally controlled and reproducible conditions. Contrast microscopy analysis reveled, in the NT2 exposed cells, an important change in shape and morphology with the outgrowth of neuritic-like structures together with a lower proliferation rate and metabolic activity alike those found in the RA treated cells. A significant up-regulation of early and late neuronal differentiation markers and a significant down-regulation of the transforming growth factor-α (TGF-α) and the fibroblast growth factor-4 (FGF-4) were also observed in the exposed cells. The decreased protein expression of the transforming gene Cripto-1 and the reduced capability of the exposed NT2 cells to form colonies in soft agar supported these last results. In conclusion, our findings demonstrate that the Ca(2+)-ICR frequency is able to induce differentiation and reduction of tumorigenicity in NT2 exposed cells suggesting a new potential therapeutic use in regenerative medicine.


Conflict of interest statement

Competing Interests: The authors have declared that no competing interests exist.

Figures

Figure 1
Figure 1. Schematic representation and quantitative description for the Ca2+-ICR exposure apparatus for electromagnetic field generation.
(A) The Ca2+-ICR exposure system illustration. (B) Magnitude and flux lines of the magnetic flux density of the overall exposure system (zoom on the right).
Figure 2
Figure 2. Effect of Ca2+-ICR exposure on NT2 cell morphology by phase contrast microscope analysis.
(A)The control (ctr), (B) exposed (exp) and (C) retinoic acid (RA) treated NT2 cells were grown as spheres for 5 weeks and seeded on Petri dishes in a matrigel substrate to study their cell morphology. Exp NT2 cells similarly to the RA treated cells show a differentiated cellular morphology in which the cells have developed some neuritic like-structures (×20 objective).
Figure 3
Figure 3. Effect of Ca2+-ICR frequency on NT2 cell metabolic activity and proliferation.
(A-B) The Ca2+-ICR exposed cells increased their metabolic activity and the proliferation trend from week 1 to week 4 compared to the control ones followed by a statistical significant decrease at the 5th week of treatment. The proliferative status of these cells at week 5 was also studied analyzing the expression of the Ki67. (C) Data are shown as mean ± standard deviation (SD). Asterisks identify statistical significance referring to the control sample (P<0.05).
Figure 4
Figure 4. Effect of Ca2+-ICR exposure on NT2 cell mRNA expression of neuronal-differentiation markers.
(A) Results of the Real Time-PCR analysis in three different conditions of NeuroD, NR1 and Tau mRNAs from 1 to 5 weeks of treatment (A-C). Data are shown as mean ± standard deviation (SD). Asterisks identify statistical significance referring to the control sample (P<0.05).
Figure 5
Figure 5. Effect of Ca2+-ICR exposure on NT2 cell protein expression of neuronal-differentiation markers.
(A) Western Blot results performed in the three different conditions, from 3 to 5 weeks, using anti- NeuroD, Tau, NR1, RPS6 and NF-200 antibodies. (B-F) Semiquantitative analysis by VersaDoc using Quantity One software. Data are shown as mean ± standard deviation (SD). Asterisks identify statistical significance referring to the control sample (P<0.05).
Figure 6
Figure 6. Effect of Ca2+-ICR exposure on NT2 cell Cripto-1 protein expression.
(A) Western Blot results at 1, 3 and 5 weeks of treatment in three different conditions using anti-Cripto-1 antibody. (B) Semiquantitative analysis by VersaDoc using Quantity One software. Data are shown as mean ± standard deviation (SD). Asterisks identify statistical significance referring to the control sample (P<0.05).
Figure 7
Figure 7. Real Time-PCR analysis for TGF-α and FGF-4 expression on Ca2+-ICR exposed NT2 cells.
(A-B) TGF-α and FGF-4 mRNAs expression analysis of cells in three different conditions treated for 1 to 5 weeks. Data are shown as mean ± standard deviation (SD). Asterisks identify statistical significance referring to the control sample (P<0.05).
Figure 8
Figure 8. Effects of Ca2+-ICR exposure on NT2 cell colony formation in soft agar.
The NT2 cells were grown as spheres for 5 weeks in three different conditions (ctr, exp, RA) and then seeded in soft agar substrate for another 7 days to study their capability of forming colonies which was measured using CyQuant GR Dye in a fluorescence plate reader. Data were reported as fluorescence intensity which is directly proportional to the cell number. Data are shown as mean ± standard deviation (SD). The asterisks identify statistical significance referring to the control sample (P<0.05).

Similar articles

Cited by

References

    1. Megiorni F, Mora B, Indovina P, Mazzilli MC (2005) Expression of neuronal markers during NTera2/cloneD1 differentiation by cell aggregation method. Neurosci Lett 373: 105–109. - PubMed
    1. Stanke M, Stubbusch J, Rohrer H (2004) Interaction of Mash1 and Phox2b in sympathetic neuron development. Mol Cell Neurosci 25: 374–382. - PubMed
    1. Podrygajlo G, Tegenge MA, Gierse A, Paquet-Durand F, Tan S, et al. (2009) Cellular phenotypes of human model neurons (NT2) after differentiation in aggregate culture. Cell Tissue Res 336: 439–452. - PubMed
    1. Gao ZY, Xu G, Stwora-Wojczyk MM, Matschinsky FM, Lee VM, et al. (1998) Retinoic acid induction of calcium channel expression in human NT2N neurons. Biochem Biophys Res Commun 247: 407–413. - PubMed
    1. Neelands TR, King AP, Macdonald RL (2000) Functional expression of L-, N-, P/Q-, and R-type calcium channels in the human NT2-N cell line. J Neurophysiol 84: 2933–2944. - PubMed

MeSH terms