Autophagy alleviates neurodegeneration caused by mild impairment of oxidative metabolism
- PMID: 23586593
- PMCID: PMC3759557
- DOI: 10.1111/jnc.12268
Autophagy alleviates neurodegeneration caused by mild impairment of oxidative metabolism
Abstract
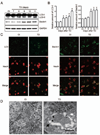
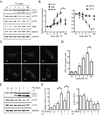
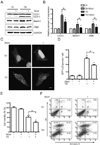
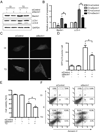
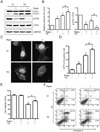
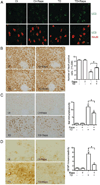
Thiamine deficiency (TD) causes mild impairment of oxidative metabolism and region-selective neuronal loss in the brain, which may be mediated by neuronal oxidative stress, endoplasmic reticulum (ER) stress, and neuroinflammation. TD-induced brain damage is used to model neurodegenerative disorders, and the mechanism for the neuronal death is still unclear. We hypothesized that autophagy might be activated in the TD brain and play a protective role in TD-induced neuronal death. Our results demonstrated that TD induced the accumulation of autophagosomes in thalamic neurons measured by transmission electron microscopy, and the up-regulation of autophagic markers LC3-II, Atg5, and Beclin1 as measured with western blotting. TD also increased the expression of autophagic markers and induced LC3 puncta in SH-SY5Y neuroblastoma cells. TD-induced expression of autophagic markers was reversed once thiamine was re-administered. Both inhibition of autophagy by wortmannin and Beclin1 siRNA potentiated TD-induced death of SH-SY5Y cells. In contrast, activation of autophagy by rapamycin alleviated cell death induced by TD. Intraperitoneal injection of rapamycin stimulated neuronal autophagy and attenuated TD-induced neuronal death and microglia activation in the submedial thalamus nucleus (SmTN). TD inhibited the phosphorylation of p70S6 kinase, suggesting mTOR/p70S6 kinase pathway was involved in the TD-induced autophagy. These results suggest that autophagy is neuroprotective in response to TD-induced neuronal death in the central nervous system. This opens a potential therapeutic avenue for neurodegenerative diseases caused by mild impairment of oxidative metabolism. Autophagy is neuroprotective in response to thiamine deficiency (TD)-induced neuronal death. TD caused neuronal damage and induced the formation of autophagosome, and increased the expression of autophagy-related proteins. Autophagy sequestered damaged and dysfunctional organelles/protein, and transported them to lysosomes for degradation/recycling. This process provided nutrients for injured neurons. Wortmannin and knockdown of Beclin1 inhibited autophagy, and exacerbated TD-induced cell death, while activation of autophagy by rapamycin offered protection against TD neurotoxicity.
Keywords: autophagy; neurodegeneration; oxidative stress; thalamus; vitamin B1.
© 2013 International Society for Neurochemistry.
Conflict of interest statement
The authors have no conflicts of interest to declare.
Figures
Similar articles
-
Autophagy is a protective response to ethanol neurotoxicity.Autophagy. 2012 Nov;8(11):1577-89. doi: 10.4161/auto.21376. Epub 2012 Aug 9. Autophagy. 2012. PMID: 22874567 Free PMC article.
-
Activation of Autophagic Flux against Xenoestrogen Bisphenol-A-induced Hippocampal Neurodegeneration via AMP kinase (AMPK)/Mammalian Target of Rapamycin (mTOR) Pathways.J Biol Chem. 2015 Aug 21;290(34):21163-21184. doi: 10.1074/jbc.M115.648998. Epub 2015 Jul 2. J Biol Chem. 2015. Retraction in: J Biol Chem. 2020 Feb 28;295(9):2889. doi: 10.1074/jbc.W120.012895. PMID: 26139607 Free PMC article. Retracted.
-
Neuronal MCP-1 mediates microglia recruitment and neurodegeneration induced by the mild impairment of oxidative metabolism.Brain Pathol. 2011 May;21(3):279-97. doi: 10.1111/j.1750-3639.2010.00445.x. Epub 2010 Nov 3. Brain Pathol. 2011. PMID: 21029241 Free PMC article.
-
Selective response of various brain cell types during neurodegeneration induced by mild impairment of oxidative metabolism.Neurochem Int. 2004 Jul-Aug;45(2-3):361-9. doi: 10.1016/j.neuint.2003.09.008. Neurochem Int. 2004. PMID: 15145550 Review.
-
Thiamine Deficiency and Neurodegeneration: the Interplay Among Oxidative Stress, Endoplasmic Reticulum Stress, and Autophagy.Mol Neurobiol. 2017 Sep;54(7):5440-5448. doi: 10.1007/s12035-016-0079-9. Epub 2016 Sep 5. Mol Neurobiol. 2017. PMID: 27596507 Free PMC article. Review.
Cited by
-
Inhibition of Cyclooxygenase-2 (COX-2) Initiates Autophagy and Potentiates MPTP-Induced Autophagic Cell Death of Human Neuroblastoma Cells, SH-SY5Y: an Inside in the Pathology of Parkinson's Disease.Mol Neurobiol. 2018 Oct;55(10):8038-8050. doi: 10.1007/s12035-018-0950-y. Epub 2018 Mar 1. Mol Neurobiol. 2018. PMID: 29498006
-
Neuroprotective Effects of a Cholecystokinin Analogue in the 1-Methyl-4-Phenyl-1,2,3,6-Tetrahydropyridine Parkinson's Disease Mouse Model.Front Neurosci. 2022 Mar 15;16:814430. doi: 10.3389/fnins.2022.814430. eCollection 2022. Front Neurosci. 2022. PMID: 35368248 Free PMC article.
-
Thiamine deficiency induces anorexia by inhibiting hypothalamic AMPK.Neuroscience. 2014 May 16;267:102-13. doi: 10.1016/j.neuroscience.2014.02.033. Epub 2014 Mar 5. Neuroscience. 2014. PMID: 24607345 Free PMC article.
-
Diabetes and the brain: oxidative stress, inflammation, and autophagy.Oxid Med Cell Longev. 2014;2014:102158. doi: 10.1155/2014/102158. Epub 2014 Aug 24. Oxid Med Cell Longev. 2014. PMID: 25215171 Free PMC article. Review.
-
Therapeutic Effect of Rapamycin on TDP-43-Related Pathogenesis in Ischemic Stroke.Int J Mol Sci. 2022 Dec 30;24(1):676. doi: 10.3390/ijms24010676. Int J Mol Sci. 2022. PMID: 36614118 Free PMC article.
References
-
- Anglade P, Vyas S, Javoy-Agid F, et al. Apoptosis and autophagy in nigral neurons of patients with Parkinson's disease. Histology and histopathology. 1997;12:25–31. - PubMed
-
- Baehrecke EH. Autophagy: dual roles in life and death? Nature reviews. 2005;6:505–510. - PubMed
-
- Blommaart EF, Krause U, Schellens JP, Vreeling-Sindelarova H, Meijer AJ. The phosphatidylinositol 3-kinase inhibitors wortmannin and LY294002 inhibit autophagy in isolated rat hepatocytes. European journal of biochemistry / FEBS. 1997;243:240–246. - PubMed
Publication types
MeSH terms
Substances
Grants and funding
LinkOut - more resources
Full Text Sources
Other Literature Sources
Miscellaneous

