. 2013 Apr 15:13:176.
doi: 10.1186/1471-2334-13-176.

Age-specific contacts and travel patterns in the spatial spread of 2009 H1N1 influenza pandemic

Affiliations

Age-specific contacts and travel patterns in the spatial spread of 2009 H1N1 influenza pandemic

Andrea Apolloni et al. BMC Infect Dis. .

Abstract

Background: Confirmed H1N1 cases during late spring and summer 2009 in various countries showed a substantial age shift between importations and local transmission cases, with adults mainly responsible for seeding unaffected regions and children most frequently driving community outbreaks.

Methods: We introduce a multi-host stochastic metapopulation model with two age classes to analytically investigate the role of a heterogeneously mixing population and its associated non-homogeneous travel behaviors on the risk of a major epidemic. We inform the model with demographic data, contact data and travel statistics of Europe and Mexico, and calibrate it to the 2009 H1N1 pandemic early outbreak. We allow for variations of the model parameters to explore the conditions of invasion under different scenarios.

Results: We derive the expression for the potential of global invasion of the epidemic that depends on the transmissibility of the pathogen, the transportation network and mobility features, the demographic profile and the mixing pattern. Higher assortativity in the contact pattern greatly increases the probability of spatial containment of the epidemic, this effect being contrasted by an increase in the social activity of adults vs. children. Heterogeneous features of the mobility network characterizing its topology and traffic flows strongly favor the invasion of the pathogen at the spatial level, as also a larger fraction of children traveling. Variations in the demographic profile and mixing habits across countries lead to heterogeneous outbreak situations. Model results are compatible with the H1N1 spatial transmission dynamics observed.

Conclusions: This work illustrates the importance of considering age-dependent mixing profiles and mobility features coupled together to study the conditions for the spatial invasion of an emerging influenza pandemic. Its results allow the immediate assessment of the risk of a major epidemic for a specific scenario upon availability of data, and the evaluation of the potential effectiveness of public health interventions targeting specific age groups, their interactions and mobility behaviors. The approach provides a general modeling framework that can be used for other types of partitions of the host population and applied to different settings.


Figures
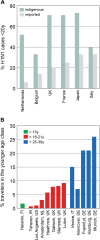
Figure 1
Figure 1
Imported vs. indigenous H1N1 cases and age-specific travel statistics for various countries. (A) Fraction of indigenous cases and of imported cases during the initial phase of the H1N1 pandemic outbreak in the [0–19] years age class, calculated from surveillance data for the following countries: The Netherlands [8], Belgium [9], UK [10], France [11], Japan [13], Italy [12]. (B) Percentage of air-travel passengers in the younger age classes for a set of airports around the world. The age classification used by the demographic statistics vary across countries (Helsinki1, Finland; Teheran3, Iran; Los Angeles2, USA; Amsterdam5, The Netherlands; Heathrow4, Gatwick4, Stansted4, Luton4, UK; Venice6, Italy; Hannover7, Frankfurt8, Hamburg8, Munich8, Germany) with the corresponding age brackets for the children class (expressed in years): 1=[0,15]; 2=[0,18]; 3=[0,19]; 4=[0,20]; 5=[0,21]; 6=[0,25]; 7=[0,26]; 8=[0,30]. Sources of the data are reported in the Additional file 1. The statistics found for Italy and Germany correspond to larger age brackets. If we rescale the data as indicated in the Demographic and travel data subsection, we obtain the following estimates for the percentage of travelers in the [0–18] years old class: 1.05% (Venice), 0.49% (Hannover), 2.31% (Frankfurt), 2.31% (Hamburg), and 2.86% (Munich). These estimated values are consistent with the data.
Figure 2
Figure 2
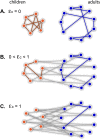
Schematic example of different assortativity levels in mixing patterns. Throughout the paper we use ε = εcα as the parameter referring to the assortativity of the mixing pattern, since it represents the total fraction of across-groups contacts. In this scheme we show three examples of different assortativity levels. A: maximum assortativity, corresponding to no mixing between the two classes (εa = εc = 0); B: intermediate assortativity, i.e. a given fraction of the children contacts are directed to adults (like e.g. a random mixing scenario), the others being of the child-child type; C: no assortativity in the children age class, as all contacts established by children are directed to the adults class (εc = 1 and thus ε = α).
Figure 3
Figure 3
Final size, extinction probability, and global invasion threshold vs. R0. A-B: Final sizes and extinction probabilities per age class as functions of the reproductive number R0. The various curves for the eight European countries under study are shown by means of a shaded area, with the exception of Belgium, see below. The maximum value for the epidemic size in children (and minimum for the epidemic size in adults) is obtained for Italy; the opposite is obtained for Poland. The situation is reversed for the extinction probabilities – the maximum value for the extinction probability in children (and minimum for the extinction probability in adults) is obtained for Poland; the opposite is obtained for Italy. In both plots, Belgium is a standalone example, with zc > za and πc > πa, differently from all other countries and due to the fact that it is the only population in the dataset to have η > 1, as discussed in the main text. The dashed line represents the case of homogeneous mixing when no partition of the population is considered (in panel B it corresponds to the function R0− 1). C: Global invasion threshold R* as a function of the reproductive number R0, for different values of the parameters describing the mobility process. Air mobility networks having degree distributions P(k) ∝ kγ with γ = 2 and γ = 3 are shown to consider different levels of heterogeneity. The results obtained in the two cases are compared to the scenarios with homogeneous diffusion rates dkk ' = w0(kk')θ obtained for θ = 0. All curves are obtained by setting the fraction of passengers in the children class equal to the observed data, i.e. r = 7%, and informing the model with the European average values for α, η, ε.
Figure 4
Figure 4
Impact of contacts ratio η.Global invasion threshold R*  as a function of the contacts ratio η, for the case of a mobility air network structure having P(k) ∝ kγ with γ = 2 (panel A) and γ = 3 (panel B). Each plot considers three values of the reproductive number – R0 = 1.05, 1.2, 1.4. The various curves for the eight European countries under study are shown by means of a shaded area, for the sake of visualization. The distribution of the population into the children class is set to the average European value for all countries, whereas the assortativity level is left country-specific. Maximum assortativity (and thus minimum ε) is reached for Italy, the opposite observed for Belgium. Here we assume that r = 0. The dashed line indicates the threshold condition R* = 1.
Figure 5
Figure 5
Impact of assortativity and of school term vs. school holidays. Global invasion threshold R* as a function of the across-groups mixing ε and of contacts ratio η, for the reproductive number estimated during school holidays (R0 = 1.05, panel A) and school term (R0 = 1.4, panel B), based on contact data in the UK [62]. Here we fix the children fraction of the population α to its European average value. The grey area indicates the extinction phase where R* < 1, whereas the colored area refers to the region of the parameter phase space that is above the threshold condition. The rectangular box indicates the area corresponding to the European intervals for the parameters ε and η. The cases for Italy (ε = 0.08, η = 0.62), United Kingdom (ε = 0.11, η = 0.75), and Finland (ε = 0.09, η = 0.79) are highlighted.
Figure 6
Figure 6
Impact of age-specific travel behavior and age profile. A: Global invasion threshold R*  as a function of the across-groups mixing ε for the cases of Italy, United Kingdom, and Finland, assuming R0 = 1.05. The solid colored lines correspond to the cases when only adults travel (r = 0) and the dashed colored lines to the cases when a percentage of 7% of passengers belongs to the children class. The continuous horizontal line indicates the threshold condition R* = 1. B: Global invasion threshold R*  as a function of the across-groups mixing ε: comparison between Europe (α = 0.20, η = 0.79) and Mexico (α = 0.32, η = 0.32). Here we consider R0 = 1.05 and R0 = 1.4, assuming r = 0.
Figure 7
Figure 7
Case with immunity. Threshold condition R* = 1  as a function of the across-groups mixing ɛ and of the children fraction α for Europe (panel A) and Mexico (panel B): comparison of the no-immunity case with the case of pre-existing immunity and of travel reduction, modeled by setting w0 = 0.5, consistently with the empirically observed drop to/from Mexico during the early stage of the 2009 H1N1 pandemic [37]. Here we consider: R0 = 1.2 in Europe and R0 = 1.4 in Mexico, i.e. the lower bound of the reproductive number estimated for the country from the initial outbreak data [2]. All travelers are adults (r = 0). The three lines, continuous red, dashed red and continuous blue, correspond to pre-existing immunity, no-immunity and travel reduction, respectively. Global epidemic invasion region is above each critical curve. The patterned gray area refers to the region of parameter values that do not satisfy the consistency relation ɛ < min {α, η(1 − α)}.

References

    1. Khan K. Spread of a novel influenza a (H1N1) virus via global airline transportation. New Engl J Med. 2009;361(2):212–214. doi: 10.1056/NEJMc0904559. - DOI - PubMed
    1. Fraser C, Donnelly CA, Cauchemez S. Pandemic potential of a strain of influenza a (H1N1): early findings. Science. 2009;324:1557–1561. doi: 10.1126/science.1176062. - DOI - PMC - PubMed
    1. Balcan D, Hu H, Goncalves B, Bajardi P, Poletto C, Ramasco JJ, Paolotti D, Perra N, Tizzoni M, Van Den Broeck W, Colizza V, Vespignani A. Seasonal transmission potential and activity peaks of the new influenza A(H1N1): a Monte Carlo likelihood analysis based on human mobility. BMC Med. 2009;7:45. doi: 10.1186/1741-7015-7-45. - DOI - PMC - PubMed
    1. Nishiura H, Castillo-Chavez C, Safan M, Chowell G. Transmission potential of the new influenza A (H1N1) virus and its age-specificity in Japan. Euro Surveill. 2009;14:19227. - PubMed
    1. Novel swine-origin influenza A (H1N1) virus investigation team. Emergence of a novel swine-origin influenza A (H1N1) virus in humans. N Engl J Med. 2009;360:2605–2615. - PubMed

Publication types