. 2013 Apr 12;10(1):18.
doi: 10.1186/1742-9994-10-18.

Phylostratigraphic profiles reveal a deep evolutionary history of the vertebrate head sensory systems

Affiliations

Phylostratigraphic profiles reveal a deep evolutionary history of the vertebrate head sensory systems

Martin Sebastijan Sestak et al. Front Zool. .

Abstract

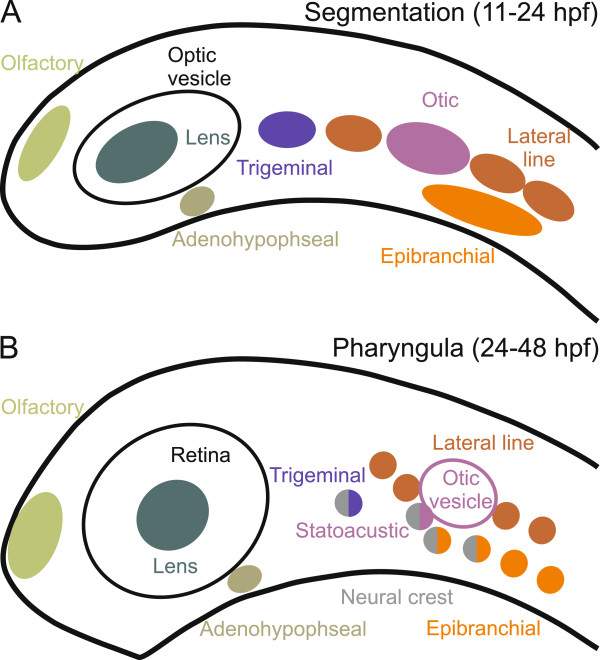
Background: The vertebrate head is a highly derived trait with a heavy concentration of sophisticated sensory organs that allow complex behaviour in this lineage. The head sensory structures arise during vertebrate development from cranial placodes and the neural crest. It is generally thought that derivatives of these ectodermal embryonic tissues played a central role in the evolutionary transition at the onset of vertebrates. Despite the obvious importance of head sensory organs for vertebrate biology, their evolutionary history is still uncertain.

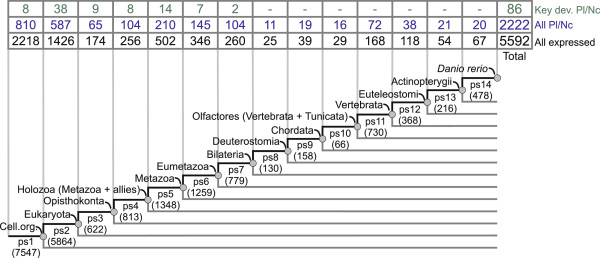
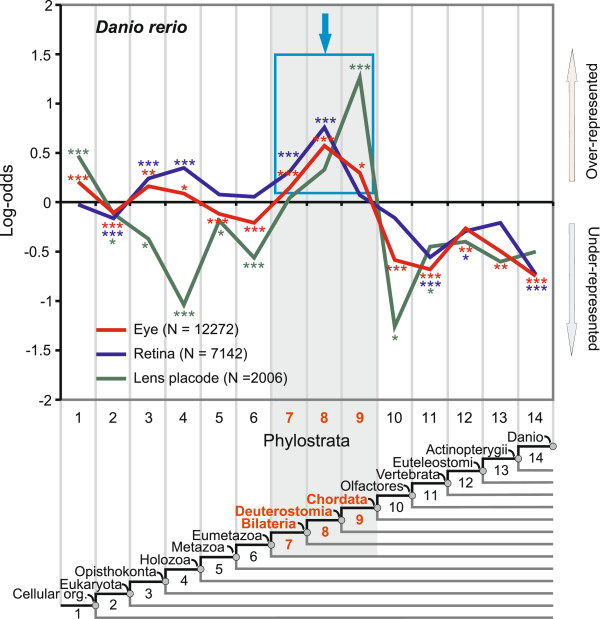
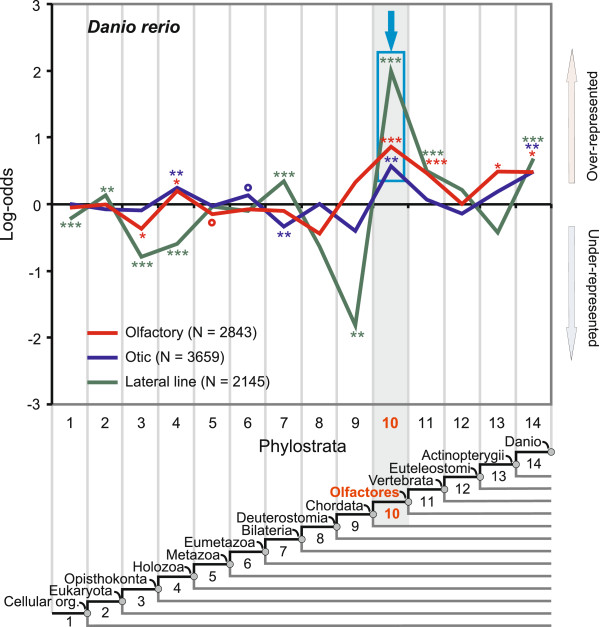
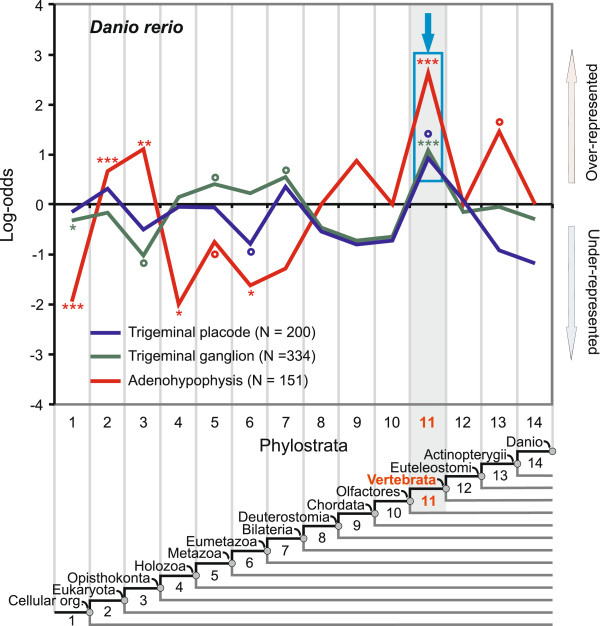
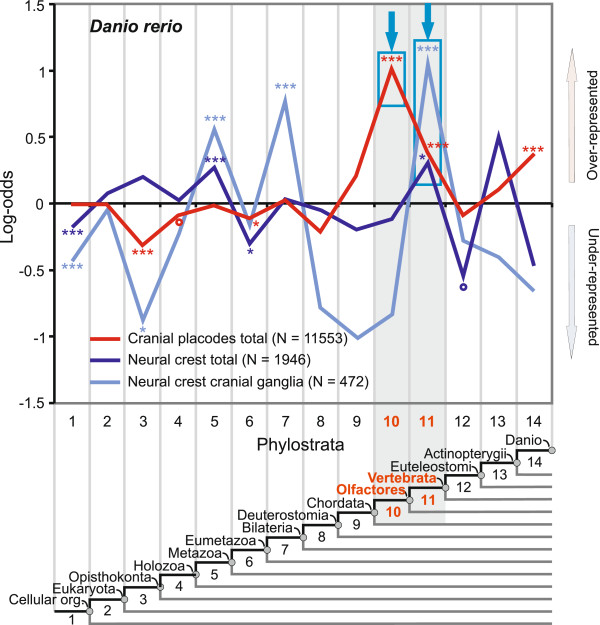
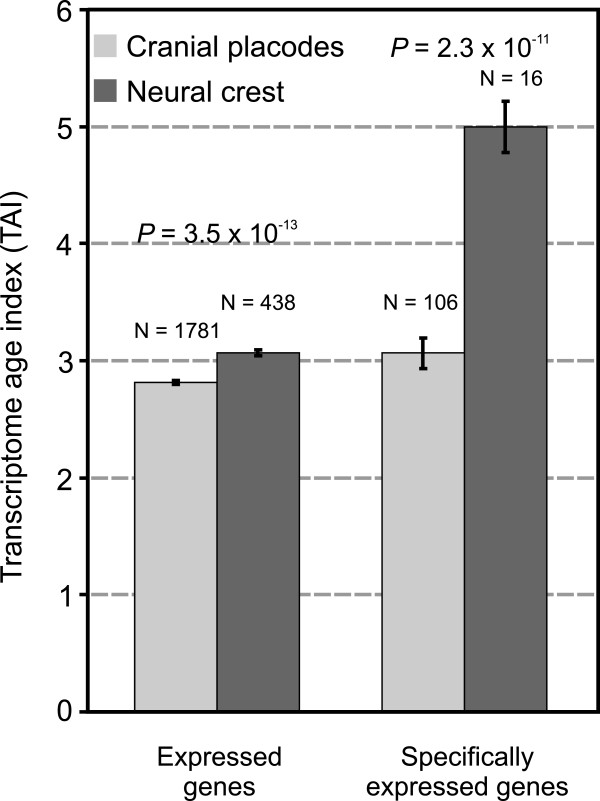
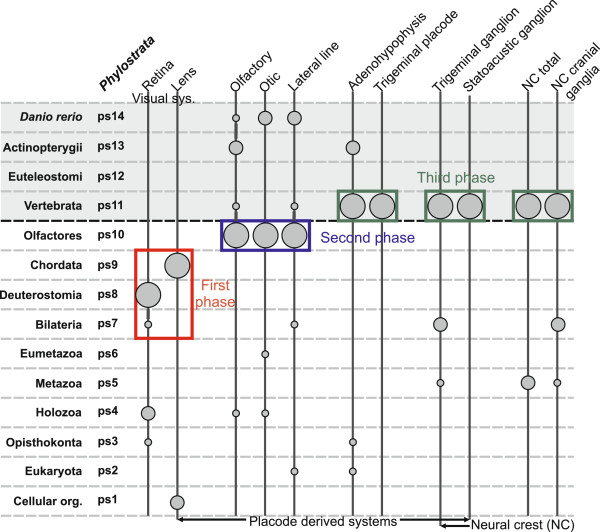
Results: To give a fresh perspective on the adaptive history of the vertebrate head sensory organs, we applied genomic phylostratigraphy to large-scale in situ expression data of the developing zebrafish Danio rerio. Contrary to traditional predictions, we found that dominant adaptive signals in the analyzed sensory structures largely precede the evolutionary advent of vertebrates. The leading adaptive signals at the bilaterian-chordate transition suggested that the visual system was the first sensory structure to evolve. The olfactory, vestibuloauditory, and lateral line sensory organs displayed a strong link with the urochordate-vertebrate ancestor. The only structures that qualified as genuine vertebrate innovations were the neural crest derivatives, trigeminal ganglion and adenohypophysis. We also found evidence that the cranial placodes evolved before the neural crest despite their proposed embryological relatedness.

Conclusions: Taken together, our findings reveal pre-vertebrate roots and a stepwise adaptive history of the vertebrate sensory systems. This study also underscores that large genomic and expression datasets are rich sources of macroevolutionary information that can be recovered by phylostratigraphic mining.


Figures

Figure 1
Figure 1
Cranial placodes and sensory neural crest during head development in zebrafish. A schematic side view of the zebrafish embryonic head is shown (anterior is to the left and dorsal at the top). Approximate anatomical positions of the individual placodes are reconstructed from the in situ hybridizations taken from the ZFIN database [57]. Panel A depicts the embryo during segmentation stages (11–24 hours post fertilization). Panel B depicts the embryo during the pharyngula stages (24 – 48 hours post fertilization). Distinct placodes are marked by different colors. Ganglia of mixed placodal and sensory neural crest origin are represented by circles where half of the circle is colored in gray (neural crest). The optic vesicle and the retina, which originate directly from the neural tissue, are in black.
Figure 2
Figure 2
Phylostratigraphic distribution of the zebrafish genes on the consensus phylogeny. A consensus phylogeny that spans from the origin of the first cell to Danio rerio. Numbers in parentheses denote the total number of genes per phylostrata (ps1-ps14) across the zebrafish genome. The table above the phylogeny shows distributions of different categories of zebrafish genes. The numbers for the total set of genes with spatially restricted expression [57] are shown in the bottom row of the table (black). A subset of genes with expression in the cranial placodes and the neural crest (All Pl/Nc) is shown in the middle row (blue). A set of placode and neural crest key developmental genes (Key dev. Pl/Nc) that are reported in the literature [17,52] is shown in the upper row (green).
Figure 3
Figure 3
Phylostratigraphic analysis of the zebrafish visual system. A vertical grid depicts the 14 phylostrata that correspond to the phylogeny in the lower panel. In every phylostratum, the frequency of expression domains in an analyzed trait is compared to the frequency in the complete sample and deviations are shown by log-odds (y-axis). The total number of expression domains is given in parenthesis for each trait. The blue frame and the arrow denote dominant overrepresentation peaks. Log-odds of zero denote that the frequency of expressions domains in a phylostratum equals the expected frequency estimated from the total number of expressions. Deviations from the expected frequencies were tested by a two-tailed hypergeometric test corrected for multiple comparisons by FDR at 0.05 level (*P < 0.05; **P < 0.01; ***P < 0.001).
Figure 4
Figure 4
Phylostratigraphic analysis of the zebrafish olfactory, otic and lateral line systems. A vertical grid depicts the 14 phylostrata that correspond to the phylogeny in the lower panel. In every phylostratum, the frequency of expression domains in an analyzed trait is compared to the frequency in the complete sample and deviations are shown by log-odds (y-axis). The total number of expression domains is given in parenthesis for each trait. The blue frame and the arrow denote dominant overrepresentation peaks. Log-odds of zero denote that the frequency of expressions domains in a phylostratum equals the expected frequency estimated from the total number of expressions. Deviations from the expected frequencies were tested by a two-tailed hypergeometric test corrected for multiple comparisons by FDR at 0.05 level (*P < 0.05; **P < 0.01; ***P < 0.001, empty circles denotes significance before FDR correction at 0.05 level).
Figure 5
Figure 5
Phylostratigraphic analysis of the zebrafish adenohypophysis and the trigeminal system. A vertical grid depicts 14 phylostrata that correspond to the phylogeny in the lower panel. In every phylostratum, the frequency of expression domains in an analyzed trait is compared to the frequency in the complete sample and deviations are shown by log-odds (y-axis). The total number of expression domains is given for each trait in parenthesis. The blue frames and the arrows denote dominant overrepresentation peaks. Log-odds of zero denote that the frequency of expressions domains in a phylostratum equals the expected frequency estimated from the total number of expressions. Deviations from the expected frequencies were tested by a two-tailed hypergeometric test corrected for multiple comparisons by FDR at 0.05 level (*P < 0.05; **P < 0.01; ***P < 0.001, empty circles denotes significance before FDR correction at 0.05 level).
Figure 6
Figure 6
A phylostratigraphic analysis of total placodal and neural crest tissues. A vertical grid depicts 14 phylostrata that correspond to the phylogeny in the lower panel. In every phylostratum, the frequency of expression domains in an analyzed trait is compared to the frequency in the complete sample and deviations are shown by log-odds (y-axis). The total number of expression domains is given in parenthesis for each trait. The blue frames and the arrows denote dominant overrepresentation peaks. Log-odds of zero denote that the frequency of expressions domains in a phylostratum equals the expected frequency estimated from the total number of expressions. Deviations from the expected frequencies were tested by a two-tailed hypergeometric test corrected for multiple comparisons by FDR at 0.05 level (*P < 0.05; **P < 0.01; ***P < 0.001, empty circles denotes significance before FDR correction at 0.05 level).
Figure 7
Figure 7
Transcriptome age index analysis of the total placodal and neural crest tissues. Phylogenetic age of the transcriptome measured by TAI is compared between the placodes and the neural crest. TAI values were calculated as previously described [43] using the zebrafish microarray expression data (see Methods). Note that a lower TAI value marks a phylogenetically older transcriptome. For every gene included in the analysis, microarray expression levels were averaged over ontogeny. Bars on the left compare all expressed genes in the placodes and the neural crest, whereas the comparison on the right is restricted to those genes with exclusive expression in these structures. The significance of differences was tested using the Student’s t-test. Error bars represent ±1 standard error of mean.
Figure 8
Figure 8
Cranial placodes and sensory neural crest during head development in zebrafish. Phylogenetic levels (phylostrata) from the ancestor of the cellular organisms (ps1) to the present day zebrafish (ps14) are shown at the left. The gray shaded area marks the vertebrate section of the phylogeny. For all studied parts of the sensory system (Figures 2, 3, 4, 5, 6 and 7) a simplified version of the phylostratigraphic profile is shown by the vertical lines and the corresponding circles. An adaptive signal with the strongest amplitude is represented by the largest circle, the second highest signal is marked by a medium size circle, and all other overrepresentation signals are marked by circles of the smallest size. Only statistically significant signals are shown. The three phases in the evolution of sensory system are labeled by different colors (first phase – red, second phase – blue, and third phase – green).

Similar articles

Cited by

References

    1. Arendt D, Tessmar-Raible K, Snyman H, Dorresteijn AW, Wittbrodf J. Ciliary photoreceptors with a vertebrate-type opsin in an invertebrate brain. Science. 2004;306:869–871. doi: 10.1126/science.1099955. - DOI - PubMed
    1. Arendt D. The evolution of cell types in animals: emerging principles from molecular studies. Nat Rev Genet. 2008;9:868–882. doi: 10.1038/nrg2416. - DOI - PubMed
    1. Burighel P, Caicci F, Manni L. Hair cells in non-vertebrate models: Lower chordates and molluscs. Hear Res. 2011;273:14–24. doi: 10.1016/j.heares.2010.03.087. - DOI - PubMed
    1. Schmidt-Rhaesa A. The Evolution of Organ Systems. 1. USA: Oxford University Press; 2007.
    1. Jonasova K, Kozmik Z. Eye evolution: Lens and cornea as an upgrade of animal visual system. Semin Cell Dev Biol. 2008;19:71–81. doi: 10.1016/j.semcdb.2007.10.005. - DOI - PubMed

LinkOut - more resources