. 2013 Apr 15:11:29.
doi: 10.1186/1741-7007-11-29.

The "fossilized" mitochondrial genome of Liriodendron tulipifera: ancestral gene content and order, ancestral editing sites, and extraordinarily low mutation rate

Affiliations

The "fossilized" mitochondrial genome of Liriodendron tulipifera: ancestral gene content and order, ancestral editing sites, and extraordinarily low mutation rate

Aaron O Richardson et al. BMC Biol. .

Abstract

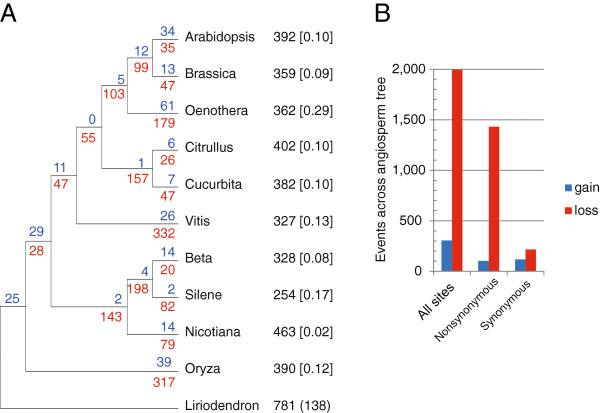
Background: The mitochondrial genomes of flowering plants vary greatly in size, gene content, gene order, mutation rate and level of RNA editing. However, the narrow phylogenetic breadth of available genomic data has limited our ability to reconstruct these traits in the ancestral flowering plant and, therefore, to infer subsequent patterns of evolution across angiosperms.

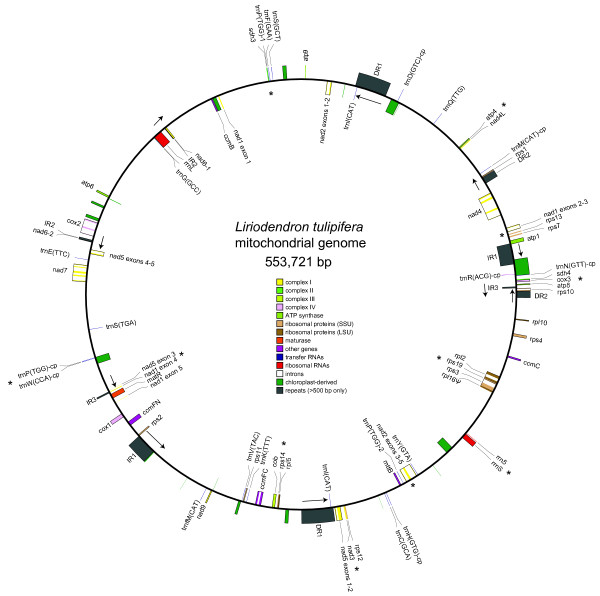
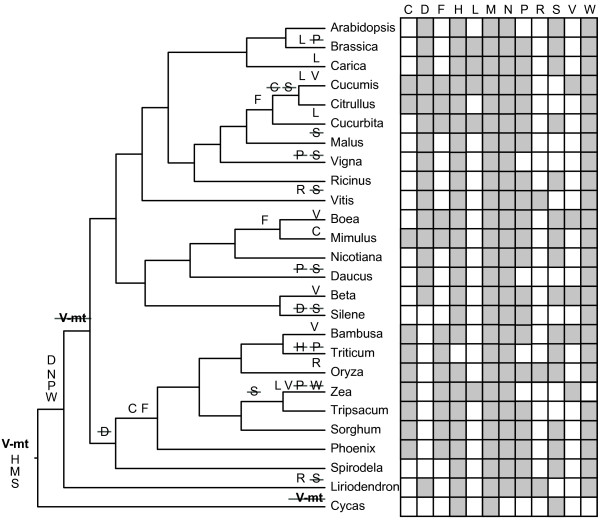
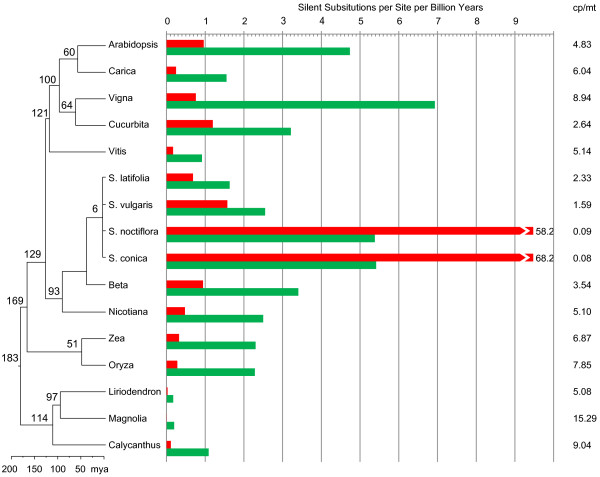
Results: We sequenced the mitochondrial genome of Liriodendron tulipifera, the first from outside the monocots or eudicots. This 553,721 bp mitochondrial genome has evolved remarkably slowly in virtually all respects, with an extraordinarily low genome-wide silent substitution rate, retention of genes frequently lost in other angiosperm lineages, and conservation of ancestral gene clusters. The mitochondrial protein genes in Liriodendron are the most heavily edited of any angiosperm characterized to date. Most of these sites are also edited in various other lineages, which allowed us to polarize losses of editing sites in other parts of the angiosperm phylogeny. Finally, we added comprehensive gene sequence data for two other magnoliids, Magnolia stellata and the more distantly related Calycanthus floridus, to measure rates of sequence evolution in Liriodendron with greater accuracy. The Magnolia genome has evolved at an even lower rate, revealing a roughly 5,000-fold range of synonymous-site divergence among angiosperms whose mitochondrial gene space has been comprehensively sequenced.

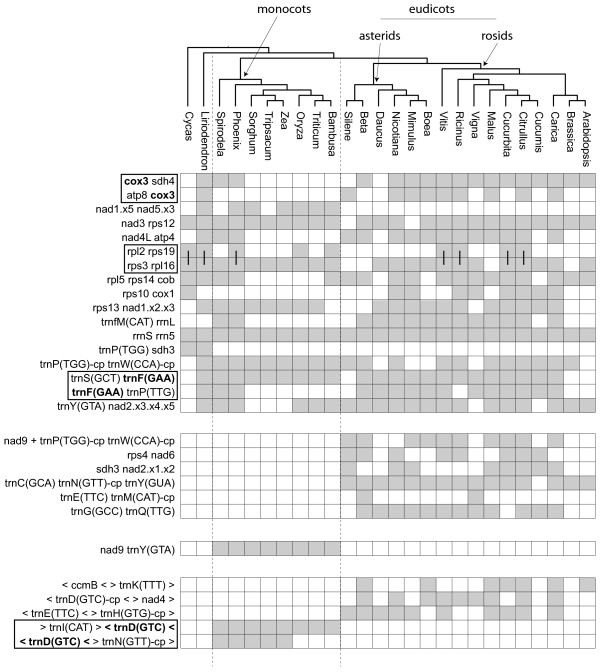
Conclusions: Using Liriodendron as a guide, we estimate that the ancestral flowering plant mitochondrial genome contained 41 protein genes, 14 tRNA genes of mitochondrial origin, as many as 7 tRNA genes of chloroplast origin, >700 sites of RNA editing, and some 14 colinear gene clusters. Many of these gene clusters, genes and RNA editing sites have been variously lost in different lineages over the course of the ensuing ∽200 million years of angiosperm evolution.


Figures

Figure 1
Figure 1
The mitochondrial genome of Liriodendron tulipifera. Displayed as a circle, but recognizing that the structure is likely to be much more complex in vivo[35]. Direct (DR) and inverted (IR) repeats longer than 500 bp and with >99% sequence identity are numbered, with arrows denoting their relative orientation. Genes from the same protein complex are similarly colored, introns are white, and plastid-derived sequences are green and unlabeled. Genes shown on the inside and outside of the circle are transcribed clockwise and counter-clockwise, respectively. Potentially functional tRNAs of plastid origin are noted with a “–cp” suffix. Asterisks identify colinear gene clusters inferred to be present in the ancestral angiosperm mitochondrial genome (see Figure 6 and text for more detail). The map was modified from the output of OGDRAW [37].
Figure 2
Figure 2
Proposed evolutionary history of plastid-derived tRNA genes found in angiosperm mitochondrial genomes. Also shown, in bold, is one native mitochondrial tRNA gene, trnV(TAC)-mt. Open text on a branch denotes a gain of that gene, whereas strikethrough indicates the loss of that gene. Gray rectangles in the grid on the right hand side indicate presence of a given full length tRNA in each mitochondrial genome. Of the sequenced Silene mitochondrial genomes, S. latifolia was used here. Key: C = trnC(GCA)-cp, D = trnD(GTC)-cp, F = trnF(GAA)-cp, H = trnH(GTG)-cp, L = trnL(CAA)-cp, M = trnM(CAT)-cp, N = trnN(GTT)-cp, P = trnP(TGG)-cp, R = trnR(TCT)-cp, S = trnS(GGA)-cp, V-mt = trnV(TAC)-mt, W = trnW(CCA)-cp.
Figure 3
Figure 3
Percent identity plots for three different stretches of plastid DNA present in the Liriodendron mitochondrial genome. A) 3,546 bp fragment with 84.4% average pairwise identity, excluding gaps; B) 2,859 bp fragment, 95.2% average pairwise identity, excluding gaps; C) 6,661 bp fragment, 99.9% average pairwise identity, excluding gaps. Above each graph is a linear representation of the Liriodendron chloroplast (cp) and cognate mitochondrial (mt) sequence, with line breaks indicating indels in one sequence relative to the other, and labeled genes represented by black rectangles. The vertical axis shows the percent identity scale and the horizontal axis shows the scale for the pairwise alignment; note the different horizontal scale for each graph.
Figure 4
Figure 4
Variation in the absolute rates of silent substitution in plastid (green) and mitochondrial (red) genomes across diverse angiosperms. The tree was rooted on Cycas, which was subsequently removed for presentation clarity. Branch-specific absolute silent substitution rates (per billion years) for the mitochondrial and chloroplast genomes are in red and green, respectively. Rate estimates for Silene were taken from previously published reports [2,48]. Confidence intervals of 95% derived from the error in estimating branch-specific synonymous substitution rates are given in Additional file 1: Table S3.
Figure 5
Figure 5
The evolution of RNA editing level across angiosperms. (A) Inferred gains (blue) and losses (red) of RNA editing sites using Dollo parsimony. The total number of edited sites determined across an alignment of 30,327 bp and 38 protein genes is listed next to each taxon. The proportion of missing data due to gene loss or lack of cDNA sequence is shown in brackets. The number of edit sites unique to Liriodendron, based on this current sample of angiosperms with empirically determined RNA editing data, is shown in parentheses. Parsimony cannot distinguish whether these sites were gained in the Liriodendron lineage, or present ancestrally and lost on the branch leading to the rest of the angiosperms (thus, no losses are noted on that branch as well). (B) Edit sites partitioned by whether they occur at a nonsynonymous or synonymous position in the codon. Edit sites in codons with multiple edits or where Liriodendron encoded a G or A were omitted in the partitioned data; therefore, the partitioned sites sum to less than the total number of sites in the study. ‘Silene’ is S. latifolia.
Figure 6
Figure 6
Colinear mitochondrial gene clusters across angiosperms. The cladogram above shows the phylogenetic relationships among these sequenced mitochondrial genomes [33]. Gray rectangles denote the presence of a gene cluster, even if one of the genes is a pseudogene. Clusters composed of more than two genes are split into two-gene subclusters and boxed together, with the common gene of both in bold. In the case of the four gene cluster rpl2-rps19-rps3-rpl16, there are two two-gene subclusters, which themselves can be colinear. In these cases, a vertical bar connects the two gray rectangles in the right panel. In the top panel are clusters inferred to have been present in the common ancestor of angiosperms. The bottom three panels show clusters inferred to have been present in the common ancestor of eudicots or monocots, but not in the ancestral angiosperm. The bottom panel contains clusters where the genes involved are encoded on opposite strands in the genome, whereas all clusters in the top three involve genes on the same strand and orientation. Genes in the bottom panel are noted as being in the forward strand (>) or reverse strand (<).

Comment in

References

    1. Handa H. The complete nucleotide sequence and RNA editing content of the mitochondrial genome of rapeseed (Brassica napus L.): comparative analysis of the mitochondrial genomes of rapeseed and Arabidopsis thaliana. Nucleic Acids Res. 2003;31:5907–5916. doi: 10.1093/nar/gkg795. - DOI - PMC - PubMed
    1. Sloan DB, Alverson AJ, Chuckalovcak JP, Wu M, McCauley DE, Palmer JD, Taylor DR. Rapid evolution of enormous, multichromosomal genomes in flowering plant mitochondria with exceptionally high mutation rates. PLoS Biol. 2012;10:e1001241. doi: 10.1371/journal.pbio.1001241. - DOI - PMC - PubMed
    1. Mower JP, Sloan DB, Alverson AJ. In: Plant Genome Diversity. Wendel JF, Greilhuber J, Dolezel J, Leitch IJ, editor. Vol. 1. Vienna: Springer Vienna; 2012. Plant mitochondrial genome diversity: the genomics revolution; pp. 123–144.
    1. Chapdelaine Y, Bonen L. The wheat mitochondrial gene for subunit 1 of the NADH dehydrogenase complex: a trans-splicing model for the gene-in-pieces. Cell. 1991;65:465–472. doi: 10.1016/0092-8674(91)90464-A. - DOI - PubMed
    1. Adams KL, Qiu YL, Stoutemyer M, Palmer JD. Punctuated evolution of mitochondrial gene content: high and variable rates of mitochondrial gene loss and transfer to the nucleus during angiosperm evolution. Proc Natl Acad Sci USA. 2002;99:9905–9912. doi: 10.1073/pnas.042694899. - DOI - PMC - PubMed

Publication types

LinkOut - more resources