

Repeatability of gallium-68 DOTATOC positron emission tomographic imaging in neuroendocrine tumors
- PMID: 23587853
- PMCID: PMC3898770
- DOI: 10.1097/MPA.0b013e318287ce21
Repeatability of gallium-68 DOTATOC positron emission tomographic imaging in neuroendocrine tumors
Abstract
Objective: To evaluate the repeatability of gallium-68 1,4,7,10-tetraazacyclododecane-N,N',N'',N'''-tetraacetic (DOTA)-D-Phe1-Try3-octreotide (68Ga-DOTATOC) positron emission tomography (PET) in neuroendocrine tumors.
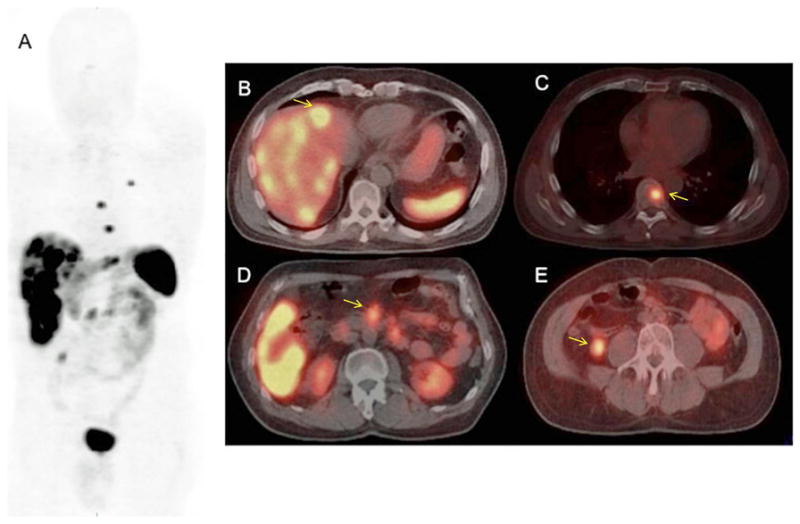
Methods: Five patients with neuroendocrine tumors were imaged with 68Ga-DOTATOC PET twice within 5 days. Maximum and mean standardized uptake values (SUVmax and SUVmean) and kinetic parameters (K-Patlak and K-influx) of target lesions were measured. The repeatability of these measurements was investigated.
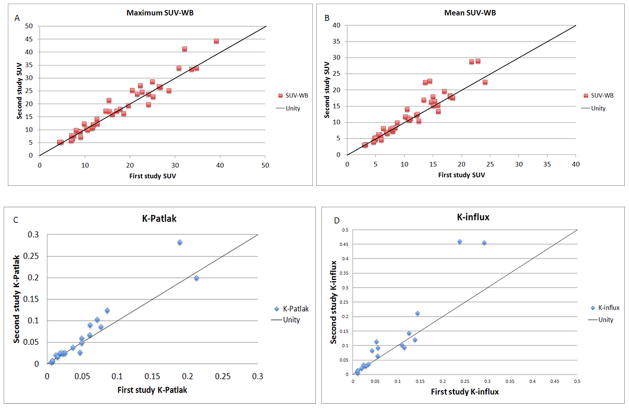
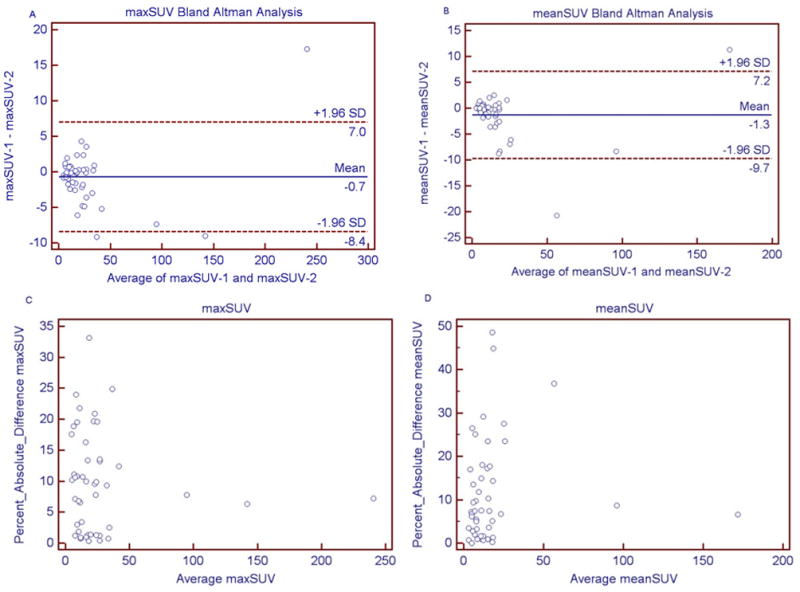
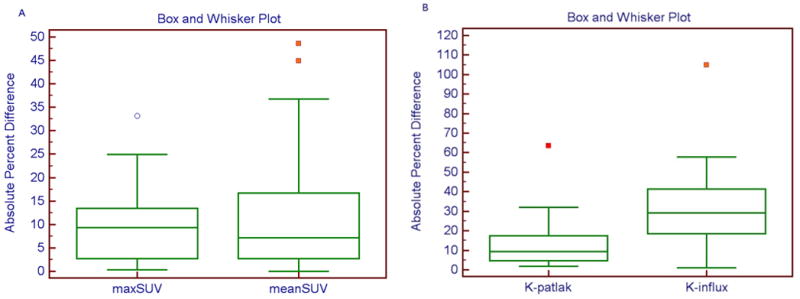
Results: Forty-seven target lesions were identified on whole-body PET and 21 lesions on dynamic images. There was excellent repeatability with intraclass correlation coefficient of 0.99 for SUVmax, SUVmean, and K-Patlak, and 0.85 for K-influx. The median absolute percent differences and the interquartile ranges (IQR) between 2 scans for SUVmax and SUVmean were 7.4% (IQR, 14.1%) and 9.3% (IQR, 10.6%), respectively. The median absolute percent differences for K-Patlak and K-influx were 12.5% (IQR, 12.6%) and 29.9% (IQR, 22.4%), respectively. The SUVmax of target lesions did not differ by more than 25% between the 2 scans.
Conclusions: 68Ga-DOTATOC PET imaging of neuroendocrine tumors is highly reproducible. A difference of more than 25% in SUVmax represents a change that is larger than the measurement error observed on repeated studies and should reflect a significant change in the biological character of the tumor.
Conflict of interest statement
Disclosures: The authors have no conflicts of interest or funding to disclose. This work was partly presented at the North American Neuroendocrine Tumor Society (NANETS) 2011 meeting in Minneapolis, Minnesota.
Figures
References
-
- Kwekkeboom DJ, Krenning EP, Scheidhauer K, et al. ENETS Consensus Guidelines for the Standards of Care in Neuroendocrine Tumors: somatostatin receptor imaging with (111)In-pentetreotide. Neuroendocrinology. 2009;90:184–9. - PubMed
-
- Balon HR, Brown TL, Goldsmith SJ, et al. The SNM Practice Guideline for Somatostatin Receptor Scintigraphy 2. 0. J Nucl Med Technol. 2011;39:317–24. - PubMed
-
- Kayani I, Bomanji JB, Groves A, et al. Functional imaging of neuroendocrine tumors with combined PET/CT using 68Ga-DOTATATE (DOTA-DPhe1, Tyr3-octreotate) and 18F-FDG. Cancer. 2008;112:2447–55. - PubMed
-
- Antunes P, Ginj M, Zhang H, et al. Are radiogallium-labelled DOTA-conjugated somatostatin analogues superior to those labelled with other radiometals? Eur J Nucl Med Mol Imaging. 2007;34:982–93. - PubMed
-
- Poeppel TD, Binse I, Petersenn S, et al. 68Ga-DOTATOC versus 68Ga-DOTATATE PET/CT in functional imaging of neuroendocrine tumors. Journal of nuclear medicine: official publication, Society of Nuclear Medicine. 2011;52:1864–70. - PubMed
Publication types
MeSH terms
Substances
Grants and funding
LinkOut - more resources
Full Text Sources
Other Literature Sources
Medical
