. 2013 Jul 15;319(12):1759-1773.
doi: 10.1016/j.yexcr.2013.03.019. Epub 2013 Apr 12.

Identification of a small molecule that induces ATG5-and-cathepsin-l-dependent cell death and modulates polyglutamine toxicity

Affiliations

Identification of a small molecule that induces ATG5-and-cathepsin-l-dependent cell death and modulates polyglutamine toxicity

Hemant Varma et al. Exp Cell Res. .

Abstract

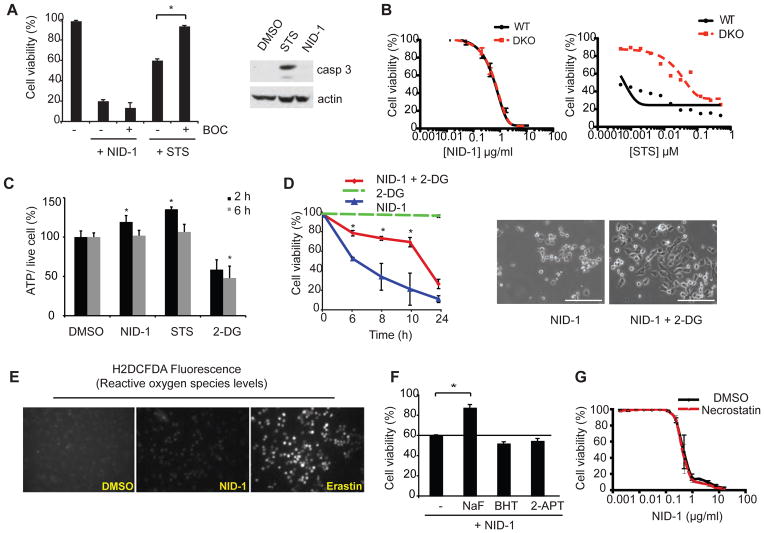
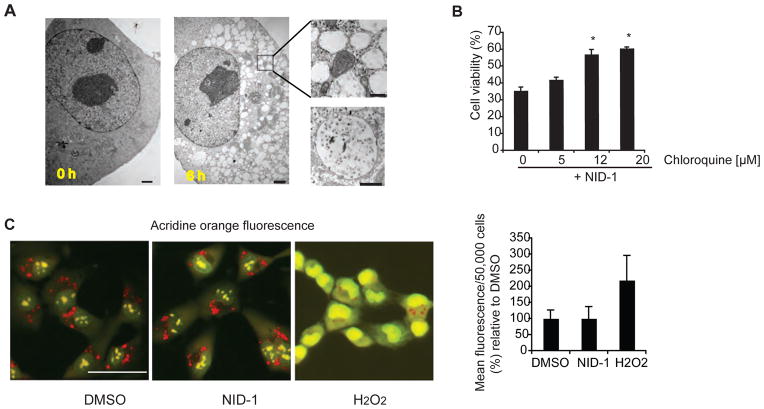
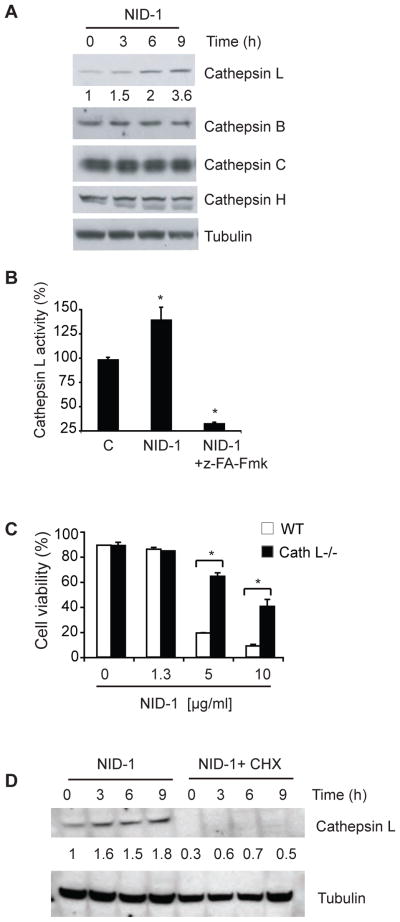
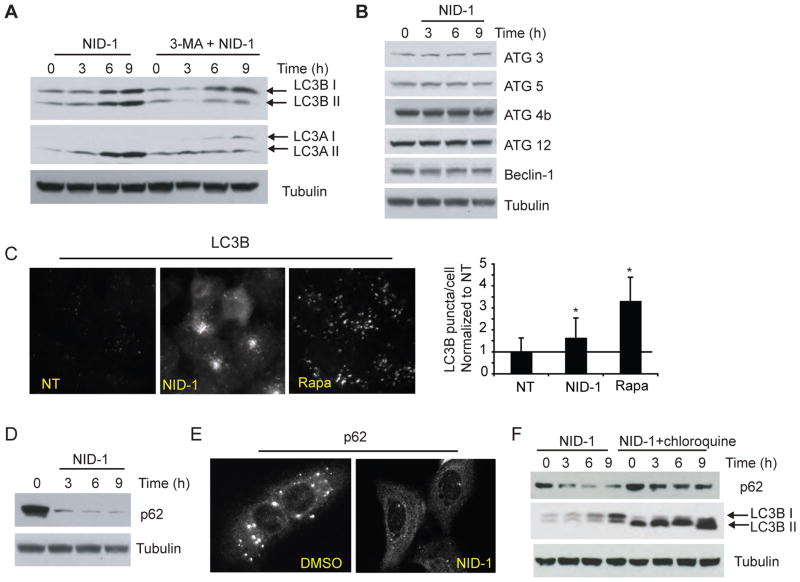
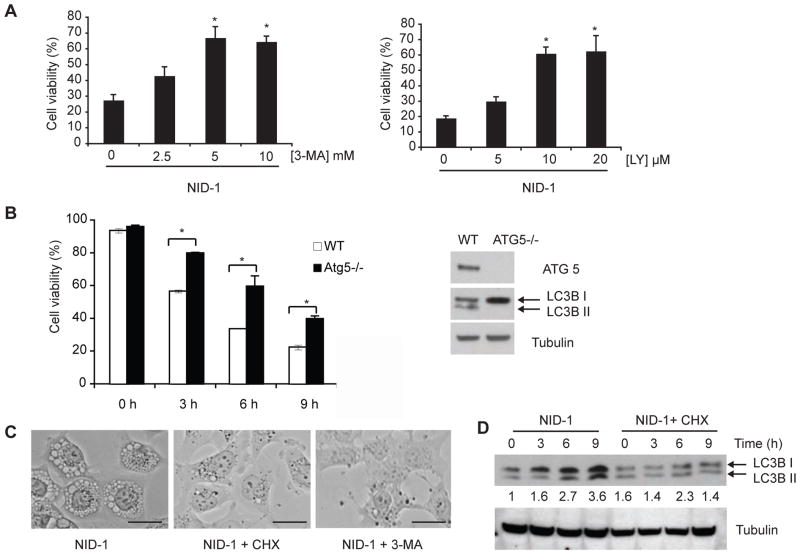
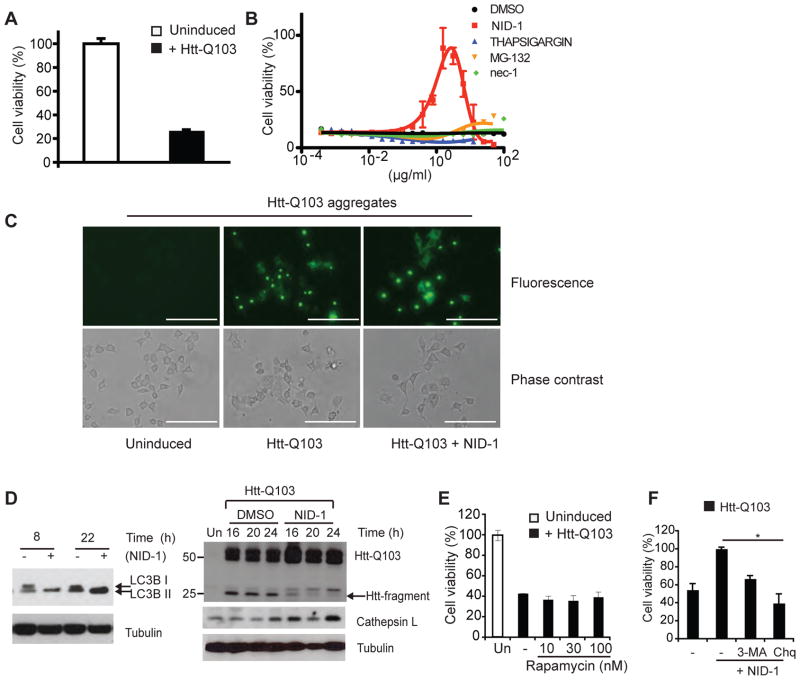
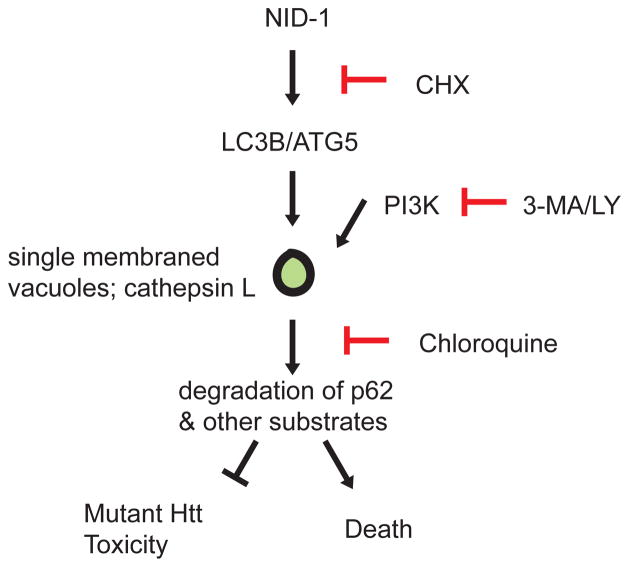
Non-apoptotic cell death mechanisms are largely uncharacterized despite their importance in physiology and disease [1]. Here we sought to systematically identify non-apoptotic cell death pathways in mammalian cells. We screened 69,612 compounds for those that induce non-canonical cell death by counter screening in the presence of inhibitors of apoptosis and necrosis. We further selected compounds that require active protein synthesis for inducing cell death. Using this tiered approach, we identified NID-1 (Novel Inducer of Death-1), a small molecule that induces an active, energy-dependent cell death in diverse mammalian cell lines. NID-1-induced death required components of the autophagic machinery, including ATG5, and the lysosomal hydrolase cathepsin L, but was distinct from classical macroautophagy. Since macroautophagy can prevent cell death in several contexts, we tested and found that NID-1 suppressed cell death in a cell-based model of Huntington's disease, suggesting that NID-1 activates a specific pathway. Thus the discovery of NID-1 identifies a previously unexplored cell death pathway, and modulating this pathway may have therapeutic applications. Furthermore, these findings provide a proof-of-principle for using chemical screening to identify novel cell death paradigms.


Figures

Fig. 1
Fig. 1
NID-1 induces cell death in diverse cell types. (A) Schematic of flow diagram used for identification of NID-1; structure of NID-1 (right panel). (B) BJeLR cells were treated with NID-1 (10 μg/ml) alone or co-treated with the protein synthesis inhibitor cycloheximide (CHX, 3 μM); cell viability was measured by a trypan blue dye-exclusion assay 8 h after treatment. Data represent mean ± S.D. of an experiment performed in duplicate, * (p< 0.05, left panel). The dose-response for cell death induced by NID-1 in BJeLR and HT-1080 cells was determined using the Alamar blue viability assay (right panel). (C) Time course of NID-1 (10 μg/ml)-induced cell death in BJeLR cells (left panel). Phase contrast micrographs of untreated BJeLR cells (middle) and after 8 h NID-1 (10 μg/ml) treatment (right panel). (D) BJeLR cells were treated with NID-1 and the supernatant (unattached fraction) was removed, and the cell viability for the attached fraction was determined by trypan blue exclusion. U2OS cells do not show cell detachment upon NID-1 treatment, and cell viability in these cells was assayed 30 h after NID-1 treatment, * (p< 0.05). (E) BJeLR or HT-1080 cells were seeded in 6-well plates, allowed to adhere overnight, and treated with NID-1 (5 μg/ml) for time points indicated. Cells were then trypsinized and re-plated into 0.3% agar-media mixture. Cells were stained with 0.005% crystal violet after culture for two weeks and the number of colonies per well was counted (left panel) and imaged (right panel), * (p<0.05). Data is representative of two independent experiments. (F) Time course of cell viability upon NID-1 treatment (10 μg/ml) in the indicated cell lines using trypan blue dye-exclusion assay. The experiments are representative of at least two independent experiments.
Fig. 2
Fig. 2
NID-1 induces an active, non-apoptotic cell death. (A) BJeLR cells were treated with NID-1 (10 μg/ml) or staurosporine (STS, 0.5 μM) alone or in combination with BOC (50 μM). Cell viability was assayed after 8 h (NID-1) or 20 h (STS) using the trypan blue dye-exclusion assay (left panel), * (p<0.05). Western blot of cleaved caspase 3: cells were treated with vehicle (DMSO), STS (0.5 μM) or NID-1 (5 μg/ml) and harvested after 4 h, and subjected to western blot for cleaved caspase 3. Actin was used as a loading control (right panel). (B) Dose-response for NID-1 and STS in WT MEFs and in isogenic bax−/−, bak−/− double knockout (DKO) MEFs. Viability was measured by Alamar blue assay 48 h after treatment. (C) ATP levels were determined following 2 and 6 h treatments with NID-1 (2 μg/ml), staurosporine (STS, 0.1 μM) and 2-deoxyglucose (2-DG, 5mM) and compared to DMSO control; * (p<0.05) (D) BJeLR cells were either pretreated with 2-deoxyglucose (2-DG, 5 mM) for 2 h, or left untreated, and then treated with NID-1 (10 μg/ml). Cell viability was determined using the trypan blue dye-exclusion assay, * (p<0.05, left panel). Data is representative of two independent experiments. Phase contrast images of NID-1 and NID-1 + 2-DG (5 mM) treated cells after 8 h. Scale bar, 200μm (right panel). (E) Reactive oxygen species were detected using H2DCFDA after 6 h of treatment with NID-1 (10 μg/ml), or erastin (10 μM), and compared to DMSO-treated control cells. (F) Cells were left untreated or pretreated with the various antioxidants (butylated hydroxytoluene (BHT, 150 μM) or 2-acetylphenothiazine (2-APT, 10 μM)) for 2 h before NID-1 (10 μg/ml) treatment. Sodium flouride (5 mM) was a positive control. Cell viability was determined using the trypan blue dye-exclusion assay, * (p<0.05). (G) BJeLR cells were treated with dose dilution of NID-1 alone or in combination with necrostatin-1 (5 μg/ml) and viability was determined by an Alamar Blue assay. Experiments are representative of at least 2 independent experiments.
Fig. 3
Fig. 3
NID-1 induced death requires lysosomal activity and is accompanied by cytosolic vacuolization (A) Electron micrographs of BJeLR cells treated with DMSO or NID-1 (2 μg/ml) for 6 h; scale bar = 2μm. Inset: higher magnification of vacuoles at 6 h; scale bar = 500 nm. Lower right panel: EM image of a single-membrane bound vacuole in a NID-1-treated cell at 1 h after NID-1 treatment; scale bar = 500 nm. (B) Cells were pretreated with vehicle, or indicated concentration of chloroquine for 12 h and then treated with NID-1 (10 μg/ml). Cell viability was determined 8 h post-treatment by the trypan blue dye-exclusion assay. Data represent the mean ± S.D. of an experiment performed in duplicate and is representative of two independent experiments, * (p< 0.05). (C) BJeLR cells were treated with DMSO, NID-1 (10 μg/ml) or H2O2 (1 mM) for 4 h and lysosomal accumulation of Acridine Orange (red) was determined. Representative fluorescence micrographs are shown (left three panels, scale bar 50 μm). BJeLR cells were treated with DMSO or NID-1 (10 μg/ml) or H2O2 (0.5 mM) for 2 h and the release of acridine orange (AO) into the cytosol was determined using flow cytometry. The results represent the mean ± S.D. of an experiment with 50,000 cells counted per sample (right panel).
Fig. 4
Fig. 4
NID-1-induces Cathepsin-L-dependent cell death. (A) NID-1 (5 μg/ml) treated BJeLR cells were analyzed by western blotting for the indicated cathepsins. Tubulin was the loading control. The levels of cathepsin L were quantitated, normalized to tubulin and indicated below the cathepsin L blot. (B) Cells were treated with vehicle control, NID-1 (5 μg/ml) alone or with the cathepsin inhibitor z-FA-Fmk (50 μM) and harvested after 3 h. Cathepsin L activity was measured by monitoring cleavage of AFC-conjugated substrate. Data are displayed relative to control (set as 100%), and are representative of two independent experiments where mean ± S.D. of experiments performed in duplicate, * (p< 0.05). (C) Embryonic fibroblasts from wild type and cathepsin L knock-out mice were treated with NID-1. Cell viability was determined 8 h post-treatment by the trypan blue dye-exclusion assay. Data represent the mean ± S.D. of an experiment performed in duplicate and are representative of three independent experiments, * (p< 0.05). (D) BJeLR cells were untreated or pretreated with CHX (3 μM) for 12 h and then with NID-1 (5 μg/ml) and the levels of indicated proteins were analyzed by western blotting. The levels of cathepsin L were quantitated, normalized to tubulin and indicated below the cathepsin L blot.
Fig. 5
Fig. 5
NID-1 activates autophagic machinery. (A) Cells were untreated or pretreated with 3-methyladenine (3-MA, 10 mM) for 12 h and then with NID-1 (5 μg/ml) and harvested for western blot analysis, and analyzed for LC3 A and B protein levels. Tubulin was used as a loading control. (B) NID-1 (5μg/ml) treated BJeLR cell lysates were subjected to western blotting for several proteins involved in autophagy. (C) U2OS cells were untreated, or treated with NID-1 (5 μg/ml) or rapamycin (10 nM) for 9 h and then fixed and stained for LC3B immunofluorescence. The puncta in the images were quantified using Image J software (NIH), n=10, * (p<0.05, student’s t-test). (D) NID-1 (5 μg/ml)-treated BJeLR cells were analyzed for p62 by western blotting. (E) U2OS cells were treated with vehicle (DMSO) or NID-1 (10 μg/ml) and the cells were fixed after 6 h treatment. Cells were stained for p62 by immunofluorescence as described in materials and methods. Representative micrographs are shown. (F) BJeLR cells were pretreated with chloroquine (12 μM) for 10 h, or untreated, and then treated with NID-1. Cell lysates were subjected to western blotting for indicated proteins.
Fig. 6
Fig. 6
NID-1 induced cell death is PI3K-and-ATG5-dependent. (A) BJeLR cells were pretreated with vehicle, 3-MA or LY 294002 for 12 h and then with NID-1 (10 μg/ml). Cell viability was measured by trypan blue dye-exclusion assay 8 h after treatment. Data represent the mean ± S.D. of an experiment performed in duplicate and is representative of three independent experiments, * (p< 0.05). (B) Mouse embryonic fibroblasts derived from WT and ATG5 knockout mice were treated with NID-1 (5 μg/ml) and cell viability was determined at indicated times using trypan blue dye-exclusion. The data is representative of 2 independent experiments, * (p< 0.05). Levels of ATG5 and LC3B II conversion in WT and ATG5−/− MEFs were analyzed by western blotting (right panel). (C) BJeLR cells were untreated, treated with CHX (3 μM) or 3-MA (10 mM) for 12 h and then with NID-1 (5 μg/ml) for 9 h. Light photomicrographs of cells demonstrating vacuoles (scale bar, 25 μm). (D) BJeLR cells were untreated or pretreated with CHX (3 μM) for 12 h and then with NID-1 (5 μg/ml) and the levels of indicated proteins were analyzed by western blotting. The levels of LC3B were quantitated, normalized to tubulin and are indicated below the blot.
Fig. 7
Fig. 7
NID-1 suppresses mutant-huntingtin-induced cell death. (A) PC12 cells were un-induced or induced to express htt-Q103. Cell viability was determined 48 h after induction of mutant htt expression using the Alamar blue assay. Data represent the mean ± S.D. of an experiment performed in triplicate is representative of three independent experiments. (B) PC12 cells were induced to express htt-Q103 and treated with a dose-dilution of indicated compounds. Cell viability was determined 48 h later as in (A). Data represent the mean ± S.D. of an experiment performed in triplicate. The rescue by NID-1 was confirmed in three independent experiments. (C) PC12 cells were un-induced or induced to express mutant htt-GFP fusion protein and then treated with NID-1 (1 μg/ml) or DMSO. Htt-Q103 aggregates were visualized using fluorescence microscopy after 15 hr of treatment. Scale bar = 200 μm. (D) PC12 cells expressing mutant htt-Q103 were incubated with control (DMSO) or NID-1 (1 μg/ml), harvested at the times indicated, and levels of indicated proteins were analyzed by western blotting. Uninduced (Un) cells were controls for lack of htt-Q103 expression. (E) PC12 cells were uninduced or induced to express htt-Q103 and treated with a dose-dilution of rapamycin. Cell viability was determined 30 h later. The results represent the mean ± S.D. of an experiment performed in duplicate and is representative of 2 independent experiments. (F) PC12 cells were untreated or pretreated with 3-MA (5mM) or chloroquine (Chq, 15 μM) for 15 h. Cells were then treated with NID-1 (1μg/ml) and htt-Q103 was induced. Cell viability was determined 30 h after induction and viability of NID-1 treated cells was arbitrarily set as 100% (*, p< 0.05, student’s t-test). The results represent the mean ± S.D. of an experiment performed in duplicate and is representative of 2 independent experiments.
Fig. 8
Fig. 8
Model of NID-1’s effect on cell death. NID-1 induces LC3A, LC3B and formation of single-membrane bound vacuoles in a protein synthesis, PI3K/ATG5 dependent manner. These vacuoles are likely sites of degradation of key cellular substrates whose degradation causes cell death. However in the context of mutant huntingtin toxicity, the substrates degraded may be involved in toxicity and thus their degradation confers protection.

References

    1. Kreuzaler P, Watson CJ. Killing a cancer: what are the alternatives? Nat Rev Cancer. 12:411–424. - PubMed
    1. Yuan J, Kroemer G. Alternative cell death mechanisms in development and beyond. Genes Dev. 2010;24:2592–2602. - PMC - PubMed
    1. Oppenheim RW, Flavell RA, Vinsant S, Prevette D, Kuan CY, Rakic P. Programmed cell death of developing mammalian neurons after genetic deletion of caspases. J Neurosci. 2001;21:4752–4760. - PMC - PubMed
    1. Degterev A, Huang Z, Boyce M, Li Y, Jagtap P, Mizushima N, Cuny GD, Mitchison TJ, Moskowitz MA, Yuan J. Chemical inhibitor of nonapoptotic cell death with therapeutic potential for ischemic brain injury. Nat Chem Biol. 2005;1:112–119. - PubMed
    1. Overholtzer M, Mailleux AA, Mouneimne G, Normand G, Schnitt SJ, King RW, Cibas ES, Brugge JS. A nonapoptotic cell death process, entosis, that occurs by cell-in-cell invasion. Cell. 2007;131:966–979. - PubMed

Publication types

MeSH terms