Review
. 2013 May;11(5):337-48.
doi: 10.1038/nrmicro3010.

Going local: technologies for exploring bacterial microenvironments

Affiliations
Review

Going local: technologies for exploring bacterial microenvironments

Aimee K Wessel et al. Nat Rev Microbiol. 2013 May.

Abstract

Microorganisms lead social lives and use coordinated chemical and physical interactions to establish complex communities. Mechanistic insights into these interactions have revealed that there are remarkably intricate systems for coordinating microbial behaviour, but little is known about how these interactions proceed in the spatially organized communities that are found in nature. This Review describes the technologies available for spatially organizing small microbial communities and the analytical methods for characterizing the chemical environment surrounding these communities. Together, these complementary technologies have provided novel insights into the impact of spatial organization on both microbial behaviour and the development of phenotypic heterogeneity within microbial communities.


Conflict of interest statement

Competing interests statement

The authors declare no competing financial interests.

Figures

Figure 1
Figure 1. Microfluidic devices, hydrogels and optical trapping for the study of bacterial interactions in spatially organized communities
a | An example of a microfluidic device that was used to probe the chemotactic behaviour of Escherichia coli. The device is constructed from polydimethylsiloxane and contains three separate inlets, one each for the chemoeffector, bacteria and buffer. Fluid flow is left to right along the 21 mm central chamber, and fluid exits the device on the right-hand side through an array of outlets. The red vertical arrow indicates the chemoeffector gradient in the direction of highest concentration. In this example, the bacteria are moving towards a higher concentration of a chemoattractant. b | Vibrio harveyi accumulation in a microfabricated maze. The narrowest passages are 100 μm wide. V. harveyi accumulation is the result of self-attractive behaviour and results in increased population density. The dark-field image (left) displays autoaggregation of cells at dead ends and cul-de-sacs, which results in the quorum sensing-dependent production of luminescence (right), as detected by a photon-counting charge-coupled device camera. c | A microfluidic device wherein signal-producing ‘transmitter cells’ are flowed in from the left channel and signal-perceiving ‘receiver cells’ are flowed in from the right channel. Optical trapping is used to spatially organize transmitter and receiver cells in a photo-polymerized hydrogel (dashed box). df | Within this hydrogel, at 380 minutes, transmitter cells (expressing RFP; part e) are induced to secrete acyl-homoserine lactone signalling molecules. These molecules are sensed by receiver cells at 675 minutes, resulting in receiver cell GFP expression (parts d,f; above and below transmitter cells, respectively). Part a is modified, with permission, from REF. © (2003) US National Academy of Sciences. Part b is reproduced, with permission, from REF. © (2003) American Association for the Advancement of Science. Parts cf are reproduced, with permission, from REF. © (2009) UK Royal Society of Chemistry.
Figure 2
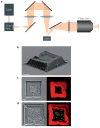
Figure 2. Bacterial lobster traps
a | A simplified optical schematic of mask-based multiphoton lithography. A pulsed laser beam is scanned and focused on the face of an electronic reflectance mask (a digital micromirror device (DMD)). The DMD is positioned in a plane conjugate to the focal plane of a high-numerical-aperture objective, and the binary images are displayed on the DMD to direct protein fabrication of the mask pattern with a one-to-one spatial correspondence in the specimen plane (dashed line). Complex, three-dimensional microstructures can be fabricated within minutes in a layer-by-layer process by moving the multiphoton fabrication voxel in defined vertical steps along the optical (z) axis between each fabrication plane. b | Scanning electron microscopy (SEM) image of a trap filled with Pseudomonas aeruginosa. The tear in the roof occurred during SEM preparation. The bacteria are false-coloured green. cd | Initiation of P. aeruginosa quorum sensing is dependent on population size. A P. aeruginosa strain that produces GFP on initiation of quorum sensing was captured inside 2 pl (part c) and 6 pl (part d) traps and exposed to a flow rate of 250 μl per minute. When filled to near capacity, little GFP is observed in the 2 pl traps, whereas significant GFP expression is observed in the 6 pl traps. The scale bar represents 5 μm. Part a is modified and parts bd are reproduced, with permission, from REF. © (2010) American Society for Microbiology.
Figure 3
Figure 3. Small-volume confinement
a | Lipid silica structures (not drawn to scale) provide picolitre-volume chambers and are used to confine small bacterial populations at high densities. b | An individual Staphylococcus aureus cell (red) induces quorum sensing within a droplet (false-coloured blue). In this instance, GFP production serves as an indicator of quorum sensing-mediated gene expression. c | Confinement of small bacterial populations in ~100 fl droplets on biocompatible resin wells surrounded by an air bubble. d | Some cells (indicated by green arrows) within the ~100 fl volume initiate quorum sensing (as indicated by GFP expression in the bottom panel) after 8 hours of incubation, whereas other cells (indicated by white arrows) do not turn on quorum sensing. Parts a,b are modified and reproduced, respectively, with permission, from REF. © (2010) Macmillan Publisher Ltd. All rights reserved. Parts c,d are modified and reproduced, respectively, with permission, from REF. © (2009) Wiley.
Figure 4
Figure 4. Production of droplets for confining, sorting and spatially arranging bacteria
a | A polydimethylsiloxane flow-focusing microfluidic device. The flow of mineral oil is perpendicular to the flow of cells (which are admixed with agarose) and results in the production of cell-containing droplets (agarose microparticles) suspended in mineral oil. b | An example of a droplet-sorting mechanism in which aqueous droplets are sorted by the presence (red) or absence (inset) of an electric field. The scale bars represent 100 μm. c | A microfluidic system capable of generating droplets containing cells in environments with defined volumes and chemical compositions. Droplets of defined chemical composition (packets of known volume) are created and then combined in the merging chamber to produce diverse chemical environments within microdroplets. Bacterial cells within these droplets can then be incubated off the microfluidic chip, and metabolic activity can be assessed using a fluorogenic substrate, thus allowing a rapid assessment of the impact of the growth environment on metabolic activity. This methodology has been used to examine interactions between multiple antibiotics by creating droplets containing combinations of different antimicrobials. Part a is modified, with permission, from REF. © (2011) American Chemical Society. Part b is reproduced, with permission, from REF. © (2009) UK Royal Society of Chemistry. Part c is modified, with permission, from REF. © (2012) UK Royal Society of Chemistry.
Figure 5
Figure 5. Detecting metabolic activity in spatially organized populations
a | The scanning electrochemical microscopy (SECM) set-up that was used for carrying out a three-dimensional quantification of molecules surrounding a biofilm. A biofilm is grown on top of a membrane surrounded by a polydimethylsiloxane (PDMS) stencil within a petri dish. A water bath and a copper heating plate serve to heat the culture. In this set of experiments, a 10 μm platinum ultra-microelectrode (UME) was used to detect the microbial production of pyocyanin with a 0.5 mm tungsten wire as a counter-electrode and Hg/Hg2SO4 (Radiometer) as a reference electrode. b | A SECM-generated reactive image of pyocyanin reduction by a Pseudomonas aeruginosa biofilm. The UME tip was held at a constant height (20–30 μm) above a 1 mm diameter P. aeruginosa biofilm (dotted outline), and a two-dimensional scan was acquired by moving the SECM tip in the x and y axes. The UME was held at 0.3 V to oxidize pyocyanin, and the rate at which the biofilm reduced pyocyanin was measured. Colour represents the current measured by SECM and correlates to the rate of pyocyanin reduction by the biofilm, from low (blue) to high (orange) current. c | A nano-scale secondary-ion mass spectrometry (nanoSIMS) instrument. A Cs+ primary-ion beam is used to sputter a bacterial cell, and the secondary ions that are emitted are directed into a mass spectrometer, where secondary-ion images for various masses (here, 12C, 13C, 12C14N and 12C15N) are generated. Secondary electrons, which are emitted during the sputtering process, can also be collected by the nanoSIMS secondary-ion collector and used to generate a topographical image of the sample surface. Isotope ratio images can be used to visualize the relative enrichment or depletion of specific chemical species within the sample. d | NanoSIMS has been used to show that deep-sea anaerobic methane-oxidizing archaea fix N2 within specialized anaerobic, methane-oxidizing archaea–bacteria consortia. Consortia were incubated with 15N2, labelled with fluorescence in situ hybridization (FISH) probes and imaged by fluorescence microscopy and nanoSIMS. FISH probes targeting methanogenic archaea are red, and those targeting sulphate-reducing bacteria (from the family Desulfobacteriaceae) are green. A nanoSIMS image of the same sample displays data as ratios of 12C15N to 12C14N. Higher ratios indicate incorporation of the labelled 15N2. Regions of the consortia where archaea are localized have higher ratios, indicating that these organisms are fixing N2. Part a is modified and part b is reproduced, with permission, from REF. © (2011) US National Academy of Sciences. Part c is modified, with permission, from REF. © (2012) Wiley. Part d is reproduced, with permission, from REF. © (2009) American Association for the Advancement of Science.

References

    1. Hall-Stoodley L, Stoodley P. Biofilm formation and dispersal and the transmission of human pathogens. Trends Microbiol. 2005;13:7–10. - PubMed
    1. Lyons MM, Ward JE, Gaff H, Drake JM, Dobbs FC. Theory of island biogeography on a microscopic scale: organic aggregates as islands for aquatic pathogens. Aquat Microb Ecol. 2010;60:1–13.
    1. Stoodley P, et al. Growth and detachment of cell clusters from mature mixed-species biofilms. Appl Environ Microbiol. 2001;67:5608–5613. - PMC - PubMed
    1. Yildiz FH. Processes controlling the transmission of bacterial pathogens in the environment. Res Microbiol. 2007;158:195–202. - PubMed
    1. Pamp S, Sternberg C, Tolker-Nielsen T. Insight into the microbial multicellular lifestyle via flow-cell technology and confocal microscopy. Cytometry A. 2009;75A:90–103. This comprehensive review describes the utility of flow cells and provides a summary of biofilm flow cell studies. - PubMed

MeSH terms

LinkOut - more resources