. 2013 Apr 15;201(2):337-49.
doi: 10.1083/jcb.201211155.

Lifetime imaging of a fluorescent protein sensor reveals surprising stability of ER thiol redox

Affiliations

Lifetime imaging of a fluorescent protein sensor reveals surprising stability of ER thiol redox

Edward Avezov et al. J Cell Biol. .

Abstract

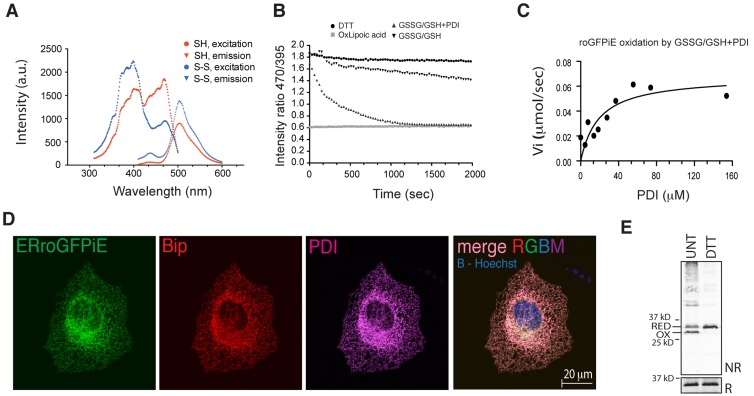
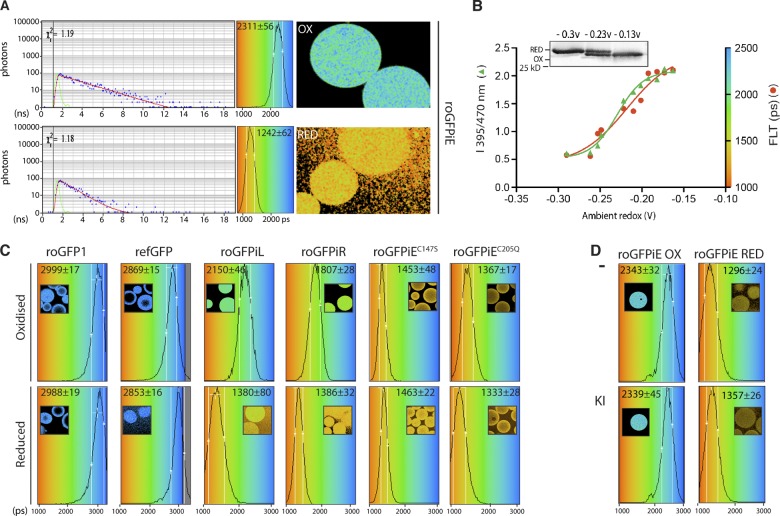
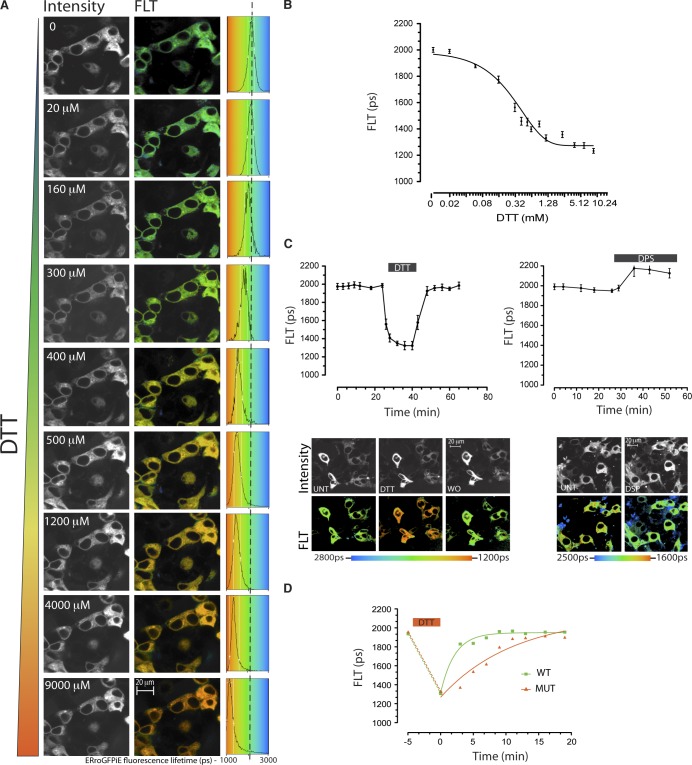
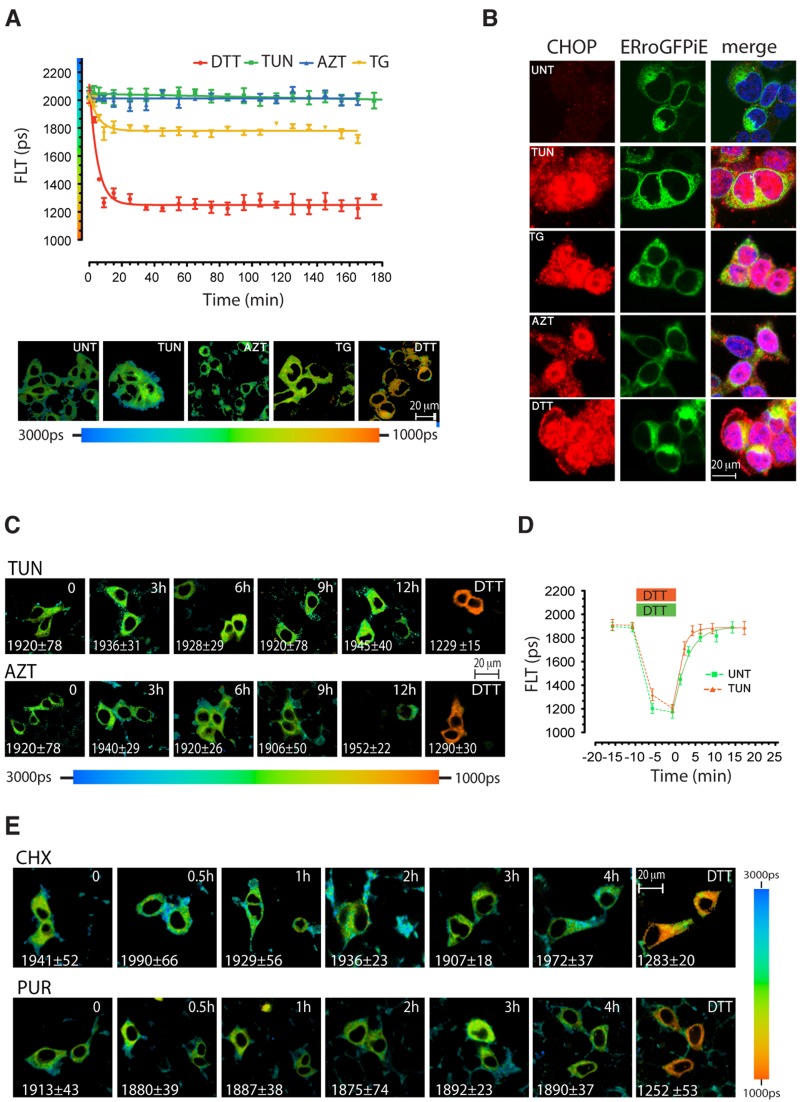
Interfering with disulfide bond formation impedes protein folding and promotes endoplasmic reticulum (ER) stress. Due to limitations in measurement techniques, the relationships of altered thiol redox and ER stress have been difficult to assess. We report that fluorescent lifetime measurements circumvented the crippling dimness of an ER-tuned fluorescent redox-responsive probe (roGFPiE), faithfully tracking the activity of the major ER-localized protein disulfide isomerase, PDI. In vivo lifetime imaging by time-correlated single-photon counting (TCSPC) recorded subtle changes in ER redox poise induced by exposure of mammalian cells to a reducing environment but revealed an unanticipated stability of redox to fluctuations in unfolded protein load. By contrast, TCSPC of roGFPiE uncovered a hitherto unsuspected reductive shift in the mammalian ER upon loss of luminal calcium, whether induced by pharmacological inhibition of calcium reuptake into the ER or by physiological activation of release channels. These findings recommend fluorescent lifetime imaging as a sensitive method to track ER redox homeostasis in mammalian cells.


Figures

Figure 1.
Figure 1.
Optical and physiological sensitivity of roGFPiE to the ER redox environment. (A) Excitation (measured by the emission at 520 nm) and emission (measured by excitation at 450 nm) scans of purified roGFPiE dithiol (SH) or disulfide (S-S; 1 µM) performed at a spectral resolution of 1 nm. (B) Time-dependent changes in the ratio of fluorescence emission (excitation: 470 nm vs. 395 nm) of the fully reduced purified roGFPiE dithiol (1 µM) introduced at t = 0 into a glutathione redox buffer (5:1 GSH/GSSG, 4 mM total) in the absence or presence of 30 µM PDI. The emission ratio of roGFPiE maintained continuously in the presence of the reducing agent DTT (5 mM) or the oxidizing agent lipoic acid (5 mM) is provided as a reference for the dithiol and disulfide forms, respectively. (C) Initial velocity of the oxidation of roGFPiE from the dithiol to the disulfide in the presence of the indicated concentration of PDI, calculated from the linear phases of measurements as in B. (D) Fluorescent photomicrographs of COS7 cells expressing ERroGFPiE, stained with rabbit polyclonal anti-GFP, mouse monoclonal anti-PDI, and chick polyclonal anti-BiP (as ER markers). The nucleus was visualized by Hoechst staining (in blue in the merged right-most panel). (E) Immunoblot of ERroGFPiE expressed in untreated or DTT-treated (5 mM DTT for 10 min) HEK 293T cells, resolved by nonreducing (NR) and reducing (R) SDS-PAGE. Shown are representative experiments reproduced three times (A–D) or twice (E).
Figure 2.
Figure 2.
Fluorescence lifetime of roGFPiE is altered by its oxidation state in vitro. (A) Color-coded fluorescence lifetime images acquired by time-correlated single-photon counting (TCSPC) spectroscopy of Sepharose beads coated with roGFPiE purified from E. coli and tethered via an antibody (right). Where indicated, the beads were exposed to an oxidizing environment of lipoic acid (OX) or a reducing environment of DTT (RED). A time-correlated photon count, from a representative pixel (after a laser excitation pulse, blue dots) and its fit to a mono-exponential decay (red line, from which the value of lifetime is extracted) are shown (left), alongside the instrument response function (green line). xr2 reports on goodness of fit. A histogram of the distribution of lifetimes observed in the pixels sampled is shown in the central panel superimposed on the continuous rainbow scale representing fluorescence lifetime values of 1,000–3,000 ps, which is also used to color code the adjacent FLIM images. The mean ± SD lifetime of each type of measurement is noted. Reduction of disulfides in the tethering immunoglobulin triggers dissociation of probe molecules from the bead, accounting for the halo effect observed in the DTT-treated (RED) samples. (B) Ratio of fluorescence emission (excitation 470 nm vs. 395 nm, left axes, green trace) and fluorescence lifetime (in picoseconds, right axes, red trace) of roGFPiE equilibrated with a lipoic acid–based redox buffer of the indicated predicted redox potential (in volts). The inset is an immunoblot of roGFPiE resolved on a nonreducing SDS-PAGE from samples at the indicated redox potential. (C) Histogram of the distribution of lifetimes of oxidized and reduced GFP proteins attached to Sepharose beads. A color-coded lifetime image is shown in the inset (as in A). The mean ± SD of the fluorescence lifetime is also indicated. (D) Histogram of distribution of lifetimes of samples as in C. Where indicated, the buffer contained the collisional quencher potassium iodide (KI, 100 mM). Shown are representative experiments reproduced three times (A) or twice (B–D).
Figure 3.
Figure 3.
Redox-dependent changes to fluorescence lifetime of ER-localized roGFPiE in live cells. (A) Fluorescent intensity–based (in grayscale) and lifetime images (color-coded to the scale of the histogram on the right) of HEK 293T cells expressing wild-type ERroGFPiE (C147-E147a-C204) and its ER-localized mutant derivatives, with or without 2 mM DTT (10 min). A histogram of the distribution of lifetimes in the population of cells is provided (right), noting the mean ± SD lifetime. The asterisk in panel 6 points to a region of intense autofluorescence with similar spectral properties as roGFPiE, but recognizable by its relatively long fluorescence lifetime. (B) Nonreducing (NR) and reducing (R) immunoblot of the GFP in the cells shown in A. The dithiol (RED) and disulfide (OX) forms are indicated. (C) Schema showing the mean florescence lifetime of the indicated GFP proteins in vivo and in vitro, as measured in the experiments shown in Fig, 2, A and C; panel A here; and in Fig. S2 B. roGFPiE and ERroGFPiE are in bold font. Redox state is indicated by S-S (disulfide) and SH (dithiol). Treatments with DTT, the oxidizing agent 2,2′-dipyridyl disulfide (DPS), or lipoic acid (LA) are noted. A and B are representative experiments reproduced twice.
Figure 4.
Figure 4.
Faithful tracking of dynamic changes in ER redox by ERroGFPiE. (A) Fluorescent intensity–based (in grayscale) and lifetime images (color-coded to the scale of the histogram on the right) of HEK 293T cells expressing ERroGFPiE exposed sequentially at 10-min intervals to escalating concentrations of the reducing agent DTT (concentration noted in the inset). A histogram of the distribution of lifetimes in the population of cells is provided (right), noting the mean ± SD lifetime. (B) Plot of the relationship between DTT concentration and probe lifetime derived from the experiment described in A. (C) A trace of time-dependent changes in ERroGFPiE fluorescence lifetime (FLT in picoseconds) in live HEK 293T cells, before, during, and after brief exposure to 2 mM DTT or 1 mM of the oxidizing agent DPS. Fluorescent emission intensity (in black and white) and lifetime (color-coded) images of cells before (UNT), during the DTT pulse, and after its washout (WO) are shown in the bottom panel. (D) As in C, comparison of lifetime changes after a reductive pulse of DTT applied to wild-type (WT) and compound Ero1l-, Ero1lB-, and Prdx4-deficient mutant (MUT) mouse embryonic fibroblasts. Shown are representative experiments reproduced twice.
Figure 5.
Figure 5.
Fluorescence lifetime of ERroGFPiE is unaffected by physiological levels of unfolded protein stress. (A) A trace of time-dependent changes in ERroGFPiE fluorescence lifetime in live HEK 293T cells after exposure to 2 mM DTT, 5 µg/ml tunicamycin (TUN), 3 mM azetidine (AZT), or 2 µM thapsigargin (TG). Color-coded fluorescence lifetime images of cells 3 h into the exposure are shown in the bottom panel. Each data point represents the mean ± SD of fluorescence lifetime measured in ≥10 cells. (B) Fluorescent photomicrographs of cells as in A, immunostained for the ER stress–induced nuclear protein CHOP (left), GFP (middle), and a superposition of the two images with Hoechst nuclei staining (right). (C) Extended time course of color-coded fluorescence lifetime images of ERroGFPiE expressing live HEK 293T cells exposed to tunicamycin or azetidine. (D) A trace of time-dependent changes in ERroGFPiE fluorescence lifetime in untreated (green) and 3-h tunicamycin-treated HEK 293T cells (orange), before, during, and after brief exposure to DTT. (E) Extended time course of color-coded fluorescence lifetime images of ERroGFPiE expressing live HEK 293T cells exposed to 50 µg/ml of the protein synthesis inhibitors cycloheximide (CHX) or 10 µg/ml of puromycin (PUR). Shown are representative experiments reproduced twice.
Figure 6.
Figure 6.
Failure of ER redox regulation at extreme unfolded protein stress. (A) Color-coded fluorescence lifetime images of ΔIre1α-deleted mouse cells and deleted cells rescued by an IRE1α transgene (IRE1+) after 4 h exposure to 5 µg/ml tunicamycin or 2 mM DTT. Values represent mean ± SD of fluorescence lifetime measured in ≥20 cells. (B) A trace of time-dependent changes in ERroGFPiE fluorescence lifetime in live COS7 cells that had been exposed to 5 µg/ml tunicamycin (TUN), 10 µM of the selective PERK kinase inhibitor GSK2606414 (PERKi), or both agents. Each data point represents the mean ± SD of fluorescence lifetime measured in ≥10 cells. (C) Color-coded fluorescence lifetime images along with histograms of lifetime frequency distribution of ERroGFPiE-expressing untreated COS7 cells and cells 3 h into the exposure to tunicamycin and PERK inhibitor. Shown are representative experiments reproduced twice.
Figure 7.
Figure 7.
Calcium depletion promotes a more reducing ER. (A) Time-dependent changes in fluorescence lifetime (FLT) of the redox reporter ERroGFPiE or the ER calcium reporter D1ER cameleon before, during, and after exposure of AR42j cells to a pulse of cholecystokinin (CCK, 2 µM). Shown are temporally superimposed typical measurements reproduced three times in cells expressing either reporter. (B) Fluorescent emission intensity (grayscale) and lifetime (color-coded) images of ERroGFPiE or D1ER cameleon in AR42j cells before, at the peak of CCK action, and after washout of CCK (as in A). (C) Traces of time-dependent changes in cytosolic calcium concentration measured by Indo 1-AM emission ratios before and after exposure to thapsigargin (2 µM). Where indicated, the thapsigargin-induced cytosolic calcium spike was buffered by 50 µM BAPTA-AM. (D) Bar diagram showing mean ± SD (n > 5) fluorescence lifetime of the ER-localized calcium probe, D1ER cameleon, or the redox probe, ERroGFPiE, in cells exposed to thapsigargin, BAPTA-AM, or both (as in C; note that D1ER cameleon’s lifetime is inversely related to ER calcium). (E) A time series of fluorescence lifetime measurements of roGFPiE dithiol (SH), disulfide (S-S), or a mixture of the two that approximates the redox state of ERroGFPiE in untreated cells (S-S/SH in vivo like) exposed in vitro to a solution whose calcium concentration was increased at regular intervals by addition of calcium (gray trace). Note that calcium concentration does not affect fluorescence lifetime of roGFPiE in vitro. Shown are representative experiments reproduced twice.

References

    1. Anfinsen C.B. 1973. Principles that govern the folding of protein chains. Science. 181:223–230 10.1126/science.181.4096.223 - DOI - PubMed
    1. Appenzeller-Herzog C., Riemer J., Christensen B., Sørensen E.S., Ellgaard L. 2008. A novel disulphide switch mechanism in Ero1alpha balances ER oxidation in human cells. EMBO J. 27:2977–2987 10.1038/emboj.2008.202 - DOI - PMC - PubMed
    1. Appenzeller-Herzog C., Riemer J., Zito E., Chin K.T., Ron D., Spiess M., Ellgaard L. 2010. Disulphide production by Ero1α-PDI relay is rapid and effectively regulated. EMBO J. 29:3318–3329 10.1038/emboj.2010.203 - DOI - PMC - PubMed
    1. Axten J.M., Medina J.R., Feng Y., Shu A., Romeril S.P., Grant S.W., Li W.H., Heerding D.A., Minthorn E., Mencken T., et al. 2012. Discovery of 7-methyl-5-(1-[3-(trifluoromethyl)phenyl]acetyl-2,3-dihydro-1H-indol-5-yl)-7H-pyrrolo[2,3-d]pyrimidin-4-amine (GSK2606414), a potent and selective first-in-class inhibitor of protein kinase R (PKR)-like endoplasmic reticulum kinase (PERK). J. Med. Chem. 55:7193–7207 10.1021/jm300713s - DOI - PubMed
    1. Baker K.M., Chakravarthi S., Langton K.P., Sheppard A.M., Lu H., Bulleid N.J. 2008. Low reduction potential of Ero1alpha regulatory disulphides ensures tight control of substrate oxidation. EMBO J. 27:2988–2997 10.1038/emboj.2008.230 - DOI - PMC - PubMed

Publication types