. 2013 May 6;210(5):917-31.
doi: 10.1084/jem.20122308.

Innate lymphoid cells sustain colon cancer through production of interleukin-22 in a mouse model

Affiliations

Innate lymphoid cells sustain colon cancer through production of interleukin-22 in a mouse model

Stefanie Kirchberger et al. J Exp Med. .

Abstract

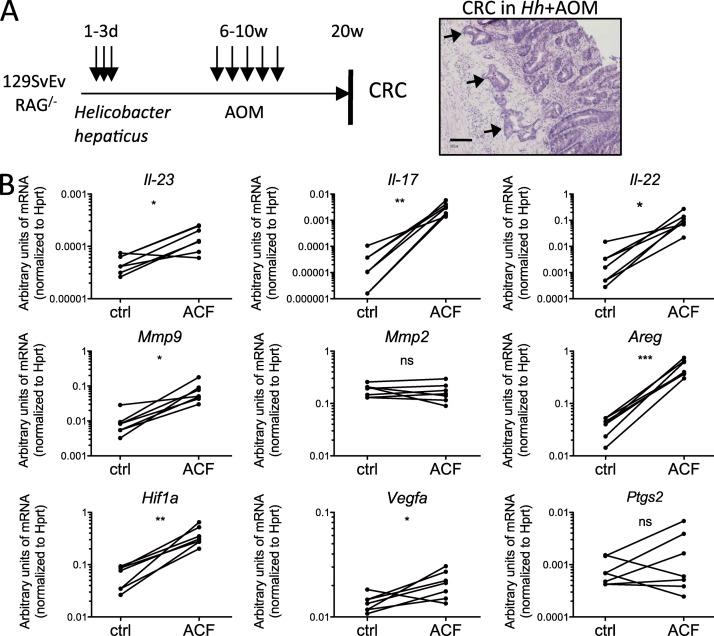
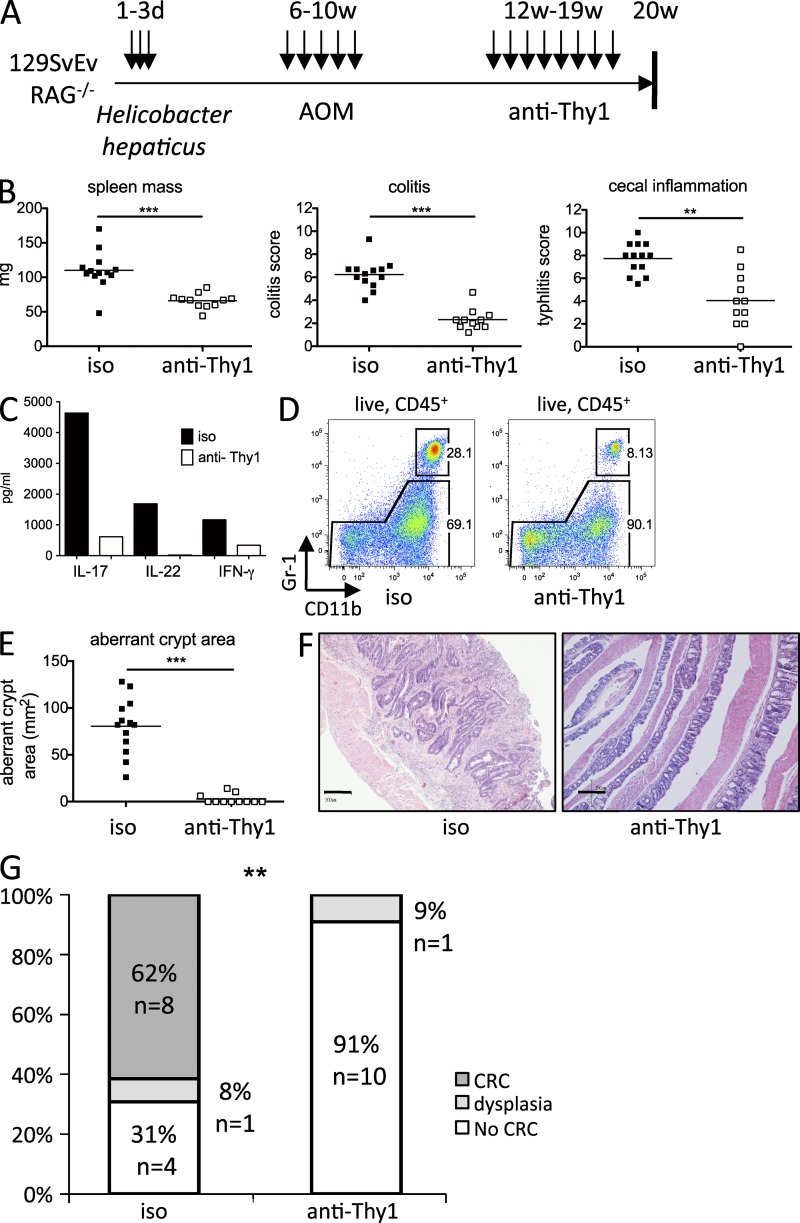
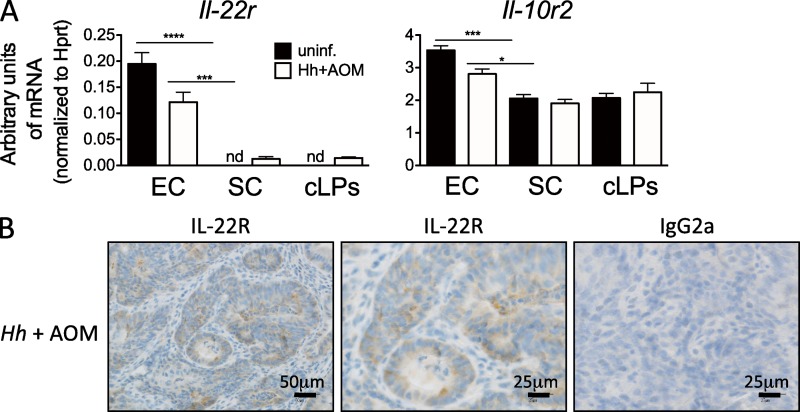
Patients with inflammatory bowel disease (IBD) have an increased risk of colon cancer. However, the immune cells and cytokines that mediate the transition from intestinal inflammation to cancer are poorly understood. We show that bacteria-induced colon cancer is accompanied by differential accumulation of IL-17(+)IL-22(+) colonic innate lymphoid cells (cILCs), which are phenotypically distinct from LTi and NK-22 cells, and that their depletion in mice with dysplastic inflammation blocks the development of invasive colon cancer. Analysis of the functional role of distinct Type 17 cytokines shows that although blockade of IL-17 inhibits some parameters of intestinal inflammation, reduction in dysplasia and colorectal cancer (CRC) requires neutralization of IL-22 indicating a unique role for IL-22 in the maintenance of cancer in this model. Mechanistic analyses showed that IL-22 selectively acts on epithelial cells to induce Stat3 phosphorylation and proliferation. Importantly, we could detect IL-22(+)CD3(+) and IL-22(+)CD3(−) cells in human CRC. Our results describe a new activity of IL-22 in the colon as a nonredundant mediator of the inflammatory cascade required for perpetuation of CRC, highlighting the IL-22 axis as a novel therapeutic target in colon cancer.


Figures

Figure 1.
Figure 1.
IL-23 signature genes are increased in aberrant crypt lesions of Hh+AOM-treated mice. (A) Treatment scheme (left) and H&E-stained invasive colorectal-carcinoma in Hh+AOM-treated 129SvEv.Rag−/− mice (right; bar, 100 µm). Arrows represent atypical glands breaching the muscularis mucosa. (B) Quantitative PCR analysis showing levels of mRNA of the cytokines Il-23, Il-17, and Il-22, the matrix metalloproteinases Mmp9 and Mmp2, the EGF receptor ligand amphiregulin (Areg), and Hif1a, Vegfa, and Ptgs2 (Cox-2) in tumors versus surrounding normal tissue (n = 5–7). Graphs show a representative experiment out of two independently performed. *, P < 0.05; **, P < 0.01; ***, P < 0.001, paired Student’s t test.
Figure 2.
Figure 2.
Nkp46CD4 cILCs accumulate during H. hepaticus–driven cancer. (A–C) Flow cytometry on cLP cells of uninfected and Hh+AOM mice. Composition (B), frequency, and numbers of cILC (n = 5; C). (D) Surface marker expression on cILC from uninfected or Hh+AOM mice. (E) Representative immunofluorescence of an Hh+AOM CRC. Arrows indicate invasive crypts. Data are shown as means and SEM. Results are representative of at least two independent experiments. *, P < 0.05; **, P < 0.01, Mann-Whitney nonparametric test.
Figure 3.
Figure 3.
Colitis to cancer transition is dependent on ILC. (A) Treatment scheme. (B) Spleen mass (left), colitis (middle), and typhlitis (right) in isotype (n = 13) or anti-Thy1 (n = 11)–treated Hh+AOM mice. (C) Cytokines in supernatants of pooled cLP cells cultured overnight from one representative experiment of three independently performed experiments. (D) Flow cytometry of colonic CD11bhi Gr1hi granulocytes. (E) Aberrant crypt area on methylene blue–stained colons. (F) Representative photomicrographs (bars, 200 µm) of invasive CRC in an isotype treated mouse (left) and normal colon in an anti-Thy1–treated mouse (right). (G) Highest tumor grade per mouse. Data are shown as means. Results show a pool of two independent experiments (B, E, and G). **, P < 0.01; ***, P < 0.001, Mann-Whitney non parametric t test (B and E), Fisher’s square test (G).
Figure 4.
Figure 4.
Nkp46 CD4 lin Thy1hi ILCs are the major source of IL-22 in Hh+AOM CRC. (A) Secretion of cytokines into the supernatant of overnight cultured cLP cells from uninfected or Hh+AOM-treated mice. (B) Intracellular cytokine stain gated on different ILC populations from uninfected or Hh+AOM-treated mice after 3 h culture of cLPs in the presence of monensin. (C–E) Characterization of IL-22 producers in cLPs of Hh+AOM-treated mice stimulated overnight in the presence of IL-23 and for 3 h with PMA, Ionomycin, and monensin (n = 5). (C) Intracellular stain with isotype (left) or anti–IL-22 (right). (D) Anti–IL-22 stains mostly Thy1hi (left) Nkp46 CD4 (right) cells. (E) IL-17 and IL-22 expression in Thy1hi cells. Data are shown as means and SEM. Results are representative of at least two independent experiments. *, P < 0.05, Mann-Whitney nonparametric test.
Figure 5.
Figure 5.
IL-22 drives cancer perpetuation. (A) Treatment scheme. (B) Spleen mass (left), colitis (middle), and typhlitis (right). Means (n = 9–14). Results are a pool of two independent experiments. (C) Representative photomicrographs of colons (bars, 200 µm). (D) Granulocyte frequencies (left) and numbers (right) in cLPs as analyzed by flow cytometry for Gr-1hi, CD11bhi, and F4-80, Ly6Cint cells (n = 3–5). Data shown represent one out of two independent experiments. (E) CRC in antibody-treated Hh+AOM mice. Highest tumor grade per mouse. (F) Colonization with Hh. Results are a pool of two independent experiments (B, E, and F). Bars represent the mean value (B, D, and F). Significance refers to isotype control (B and E). *, P < 0.05; **, P < 0.01; ***, P < 0.001; ****, P < 0.0001, one-way ANOVA with Bonferroni’s post test (B) or Fisher’s square test (E).
Figure 6.
Figure 6.
IL-22R expression in colonic epithelial cells in the Hh+AOM model. (A) Expression of IL-22R is restricted to colonic epithelial cells. Quantitative PCR analysis of mRNA levels of Il-22r and Il-10r2, the two subunits of IL-22 receptor, in colonic epithelial cells (EC), stromal cells (SC), and cLPs. Mean and SEM of one representative experiment (n = 3) of two is shown. (B) Expression of IL-22R in dysplastic epithelial cells of 5-mo Hh+AOM-treated mice as assessed by immunohistochemistry. *, P < 0.05; ***, P < 0.001; ****, P < 0.0001, one-way ANOVA with Bonferroni’s post test (A).
Figure 7.
Figure 7.
IL-22 regulates epithelial functions through Stat3 phosphorylation. (A–E) Hh+AOM-treated mice were injected with isotype control, anti–IL-22, anti-IL6R, anti–IL-17, or anti-Thy1 (B and E) for 1 wk. (A) Colonic phospho-Stat3-Y705 expression (bars, 25 µm). Arrows indicate pStat3+ cells in the cLP. (B) Immunoblot for phospho-Stat3 and total Stat3 in colonic epithelial and lamina propria cells. (C and D) Blocking of IL-22 reduces epithelial proliferation. (C) Ki-67 expression in freshly isolated EC from Hh+AOM mice (n = 4) and anti–IL-22 treated mice (n = 4). Gated on live, Epcam+, CD45 cells. (D) Cyclin D1 expression in dysplastic epithelial cells of Hh+AOM mice after 1 wk isotype or anti–IL-22 treatment (top). Cyclin D1 mRNA expression in isolated EC (bottom). (E) mRNA expression in EC. Data are shown as means and SEM of n = 2–5 per group. Results are representative of at least two independent experiments. *, P < 0.05; ***, P < 0.001; ****, P < 0.0001, one-way ANOVA with Bonferroni’s post test (E) or unpaired Student’s t test (C and D).
Figure 8.
Figure 8.
Presence of IL-22+ T cells and IL-22+ lineage-negative cells in human CRC. (A) huCRCs show an aberrant pattern of Ki-67 expression (left). IL-22+ cells are located in proximity to dysplastic areas (right). (B) Representative immunofluorescence image of a tumor and adjacent normal tissue (n = 4). CD3 (green), IL-22 (red), and DAPI (blue) are shown. Yellow arrows indicate CD3+ IL-22+ double-positive cells. White arrows indicate CD3 IL-22+ cells. (C and D) Flow cytometry of cLPs isolated from a huCRC and treated overnight with IL-23 followed by 3 h in the presence of PMA, ionomycin, and monensin (n = 3). (C) Lineage+ and lineage CD45+ cells express intracellular IL-22. (n = 3). (D) Presence of IL-22 and IL-17 double-producing cells in human tumors (n = 3). (E) Cytokine expression in huCRC. mRNA expression of IL22, IL17, IL10, and IFNg in the colonic mucosa of matched tumors and adjacent normal tissue (n = 12) relative to bACT. Graph shows the percentage of matched tumor (T)-normal (N) tissue specimens, expressing the same levels of cytokines or more than twofold increased levels in either tumor or normal tissue.

Comment in

References

    1. Barker N., Ridgway R.A., van Es J.H., van de Wetering M., Begthel H., van den Born M., Danenberg E., Clarke A.R., Sansom O.J., Clevers H. 2009. Crypt stem cells as the cells-of-origin of intestinal cancer. Nature. 457:608–611 10.1038/nature07602 - DOI - PubMed
    1. Barrett J.C., Hansoul S., Nicolae D.L., Cho J.H., Duerr R.H., Rioux J.D., Brant S.R., Silverberg M.S., Taylor K.D., Barmada M.M., et al. ; NIDDK IBD Genetics Consortium; Belgian-French IBD Consortium; Wellcome Trust Case Control Consortium 2008. Genome-wide association defines more than 30 distinct susceptibility loci for Crohn’s disease. Nat. Genet. 40:955–962 10.1038/ng.175 - DOI - PMC - PubMed
    1. Bollrath J., Phesse T.J., von Burstin V.A., Putoczki T., Bennecke M., Bateman T., Nebelsiek T., Lundgren-May T., Canli O., Schwitalla S., et al. 2009. gp130-mediated Stat3 activation in enterocytes regulates cell survival and cell-cycle progression during colitis-associated tumorigenesis. Cancer Cell. 15:91–102 10.1016/j.ccr.2009.01.002 - DOI - PubMed
    1. Boulard O., Kirchberger S., Royston D.J., Maloy K.J., Powrie F.M. 2012. Identification of a genetic locus controlling bacteria-driven colitis and associated cancer through effects on innate inflammation. J. Exp. Med. 209:1309–1324 10.1084/jem.20120239 - DOI - PMC - PubMed
    1. Brand S., Beigel F., Olszak T., Zitzmann K., Eichhorst S.T., Otte J.M., Diepolder H., Marquardt A., Jagla W., Popp A., et al. 2006. IL-22 is increased in active Crohn’s disease and promotes proinflammatory gene expression and intestinal epithelial cell migration. Am. J. Physiol. Gastrointest. Liver Physiol. 290:G827–G838 10.1152/ajpgi.00513.2005 - DOI - PubMed

Publication types

MeSH terms