. 2013 May;141(5):601-18.
doi: 10.1085/jgp.201210935. Epub 2013 Apr 15.

S1-S3 counter charges in the voltage sensor module of a mammalian sodium channel regulate fast inactivation

Affiliations

S1-S3 counter charges in the voltage sensor module of a mammalian sodium channel regulate fast inactivation

James R Groome et al. J Gen Physiol. 2013 May.

Erratum in

Abstract

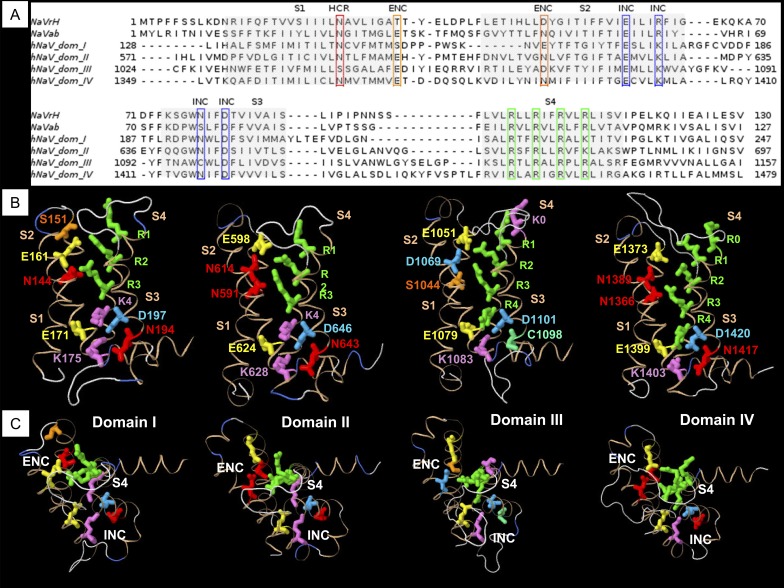
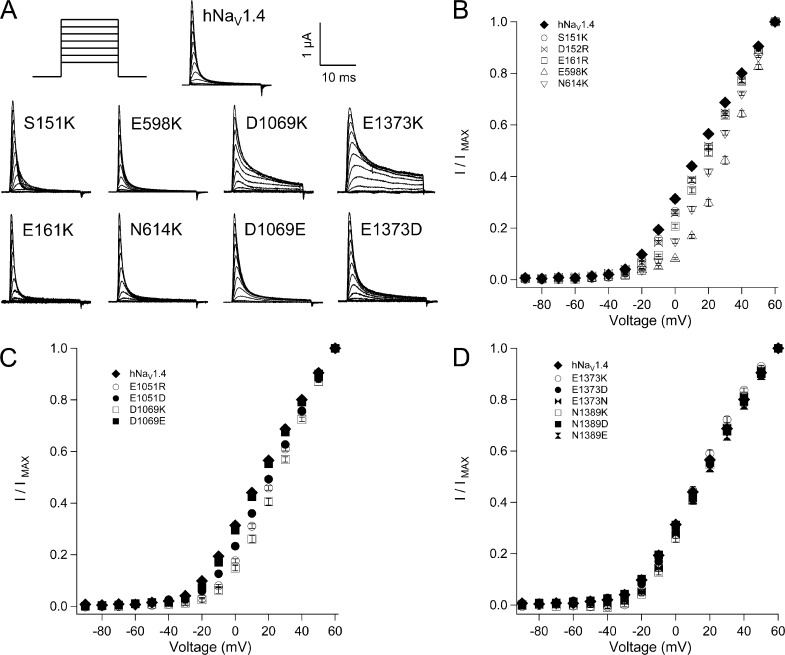
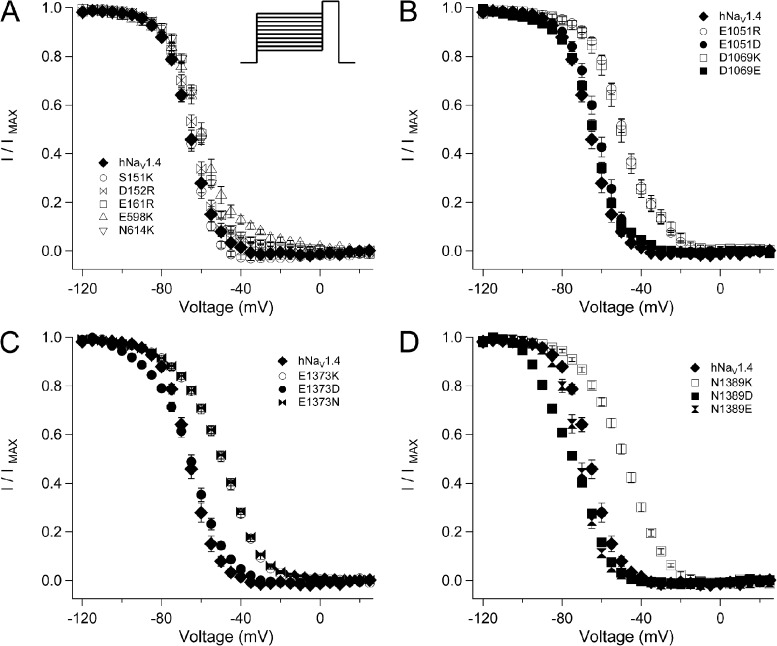
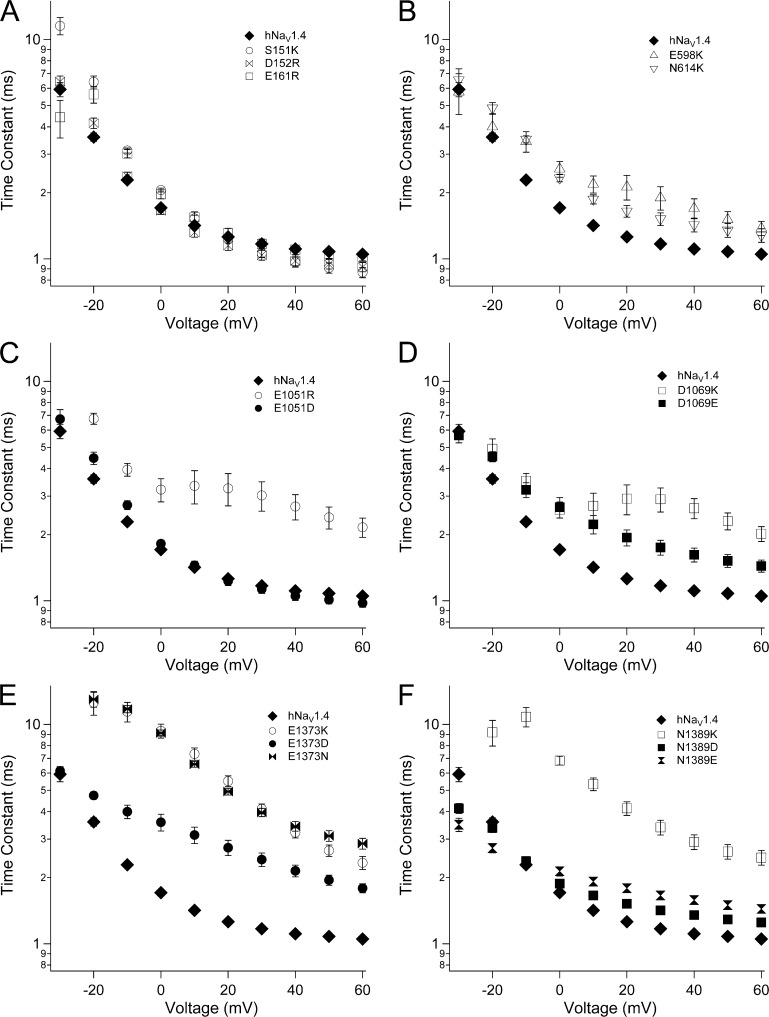
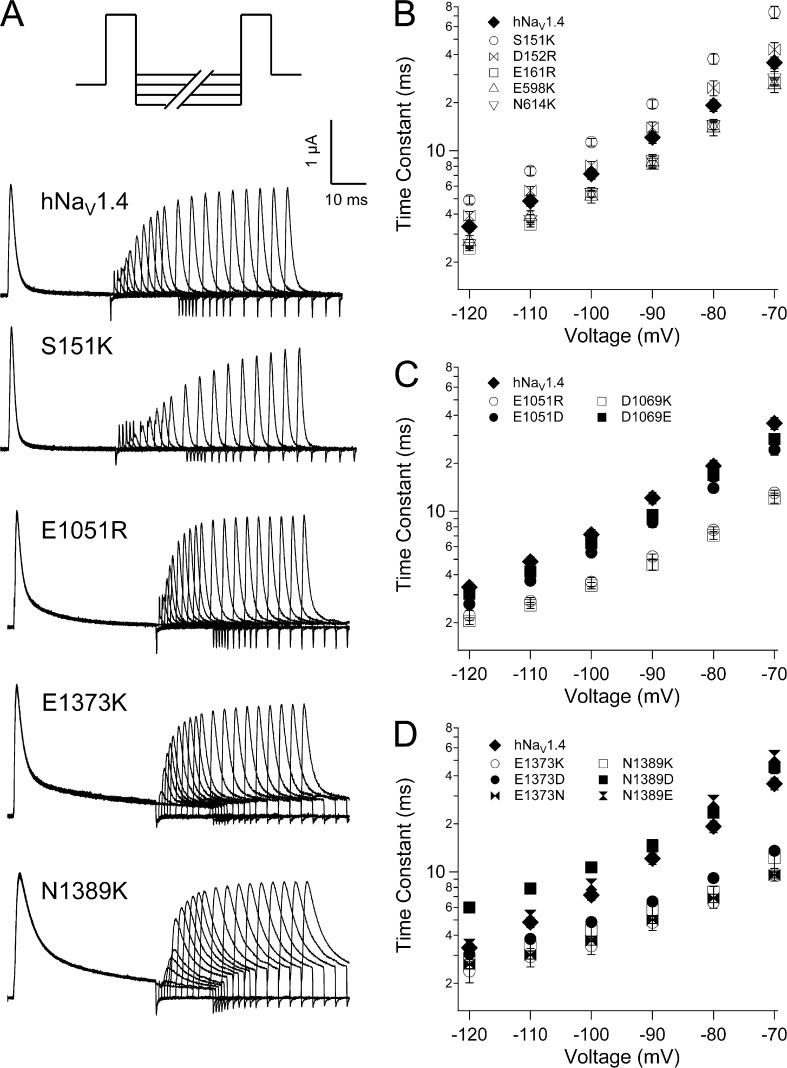
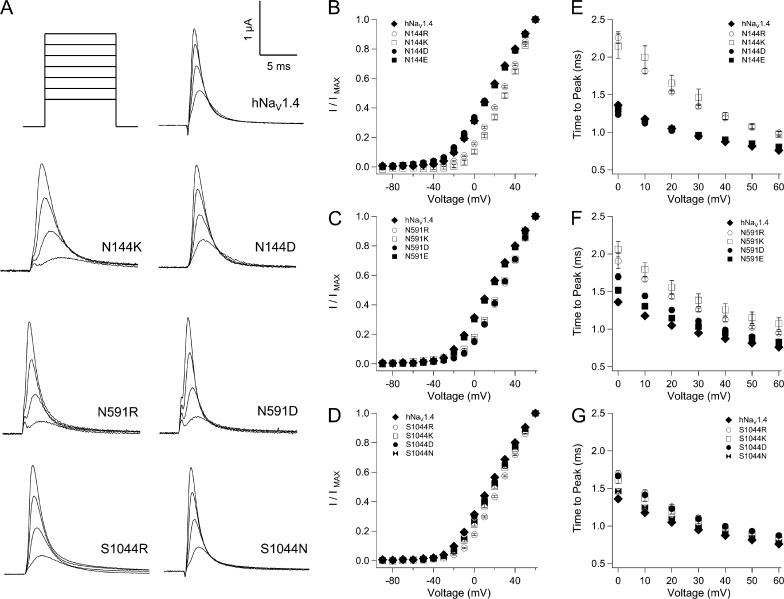
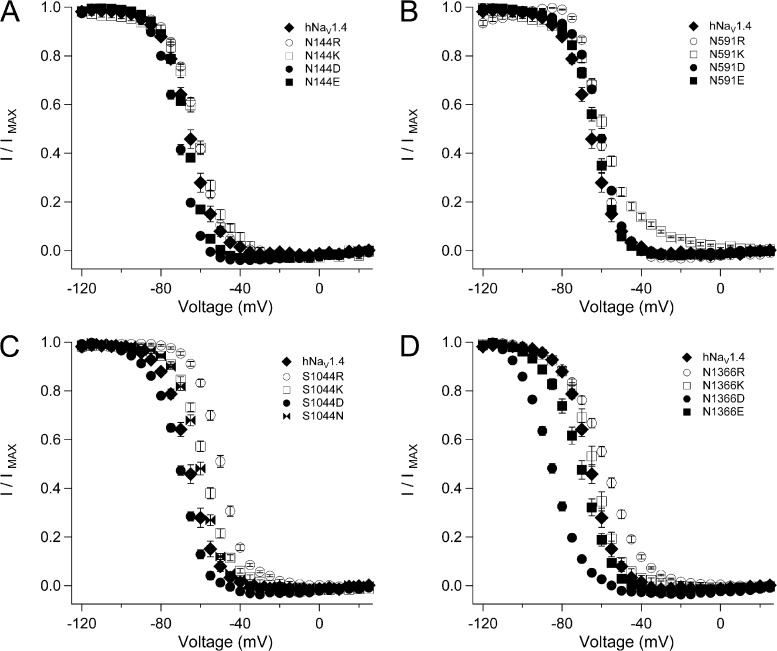
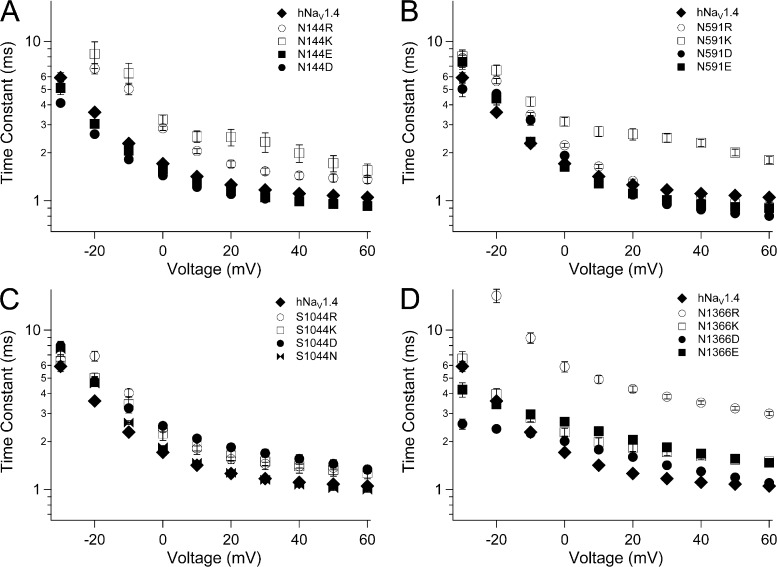
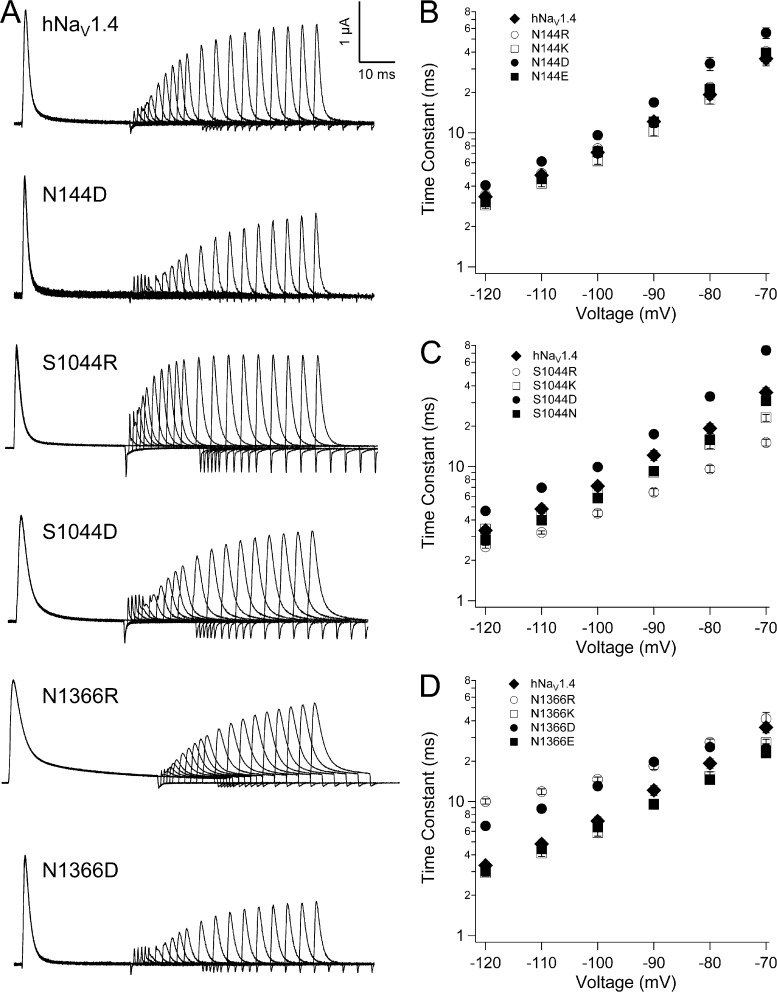
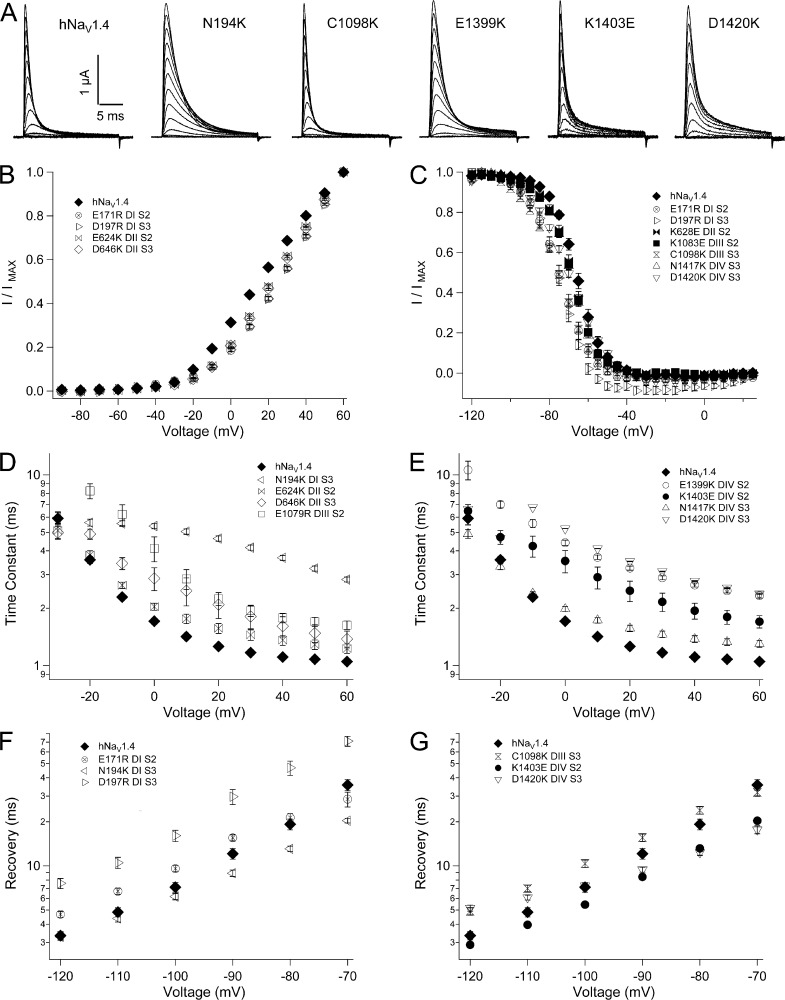
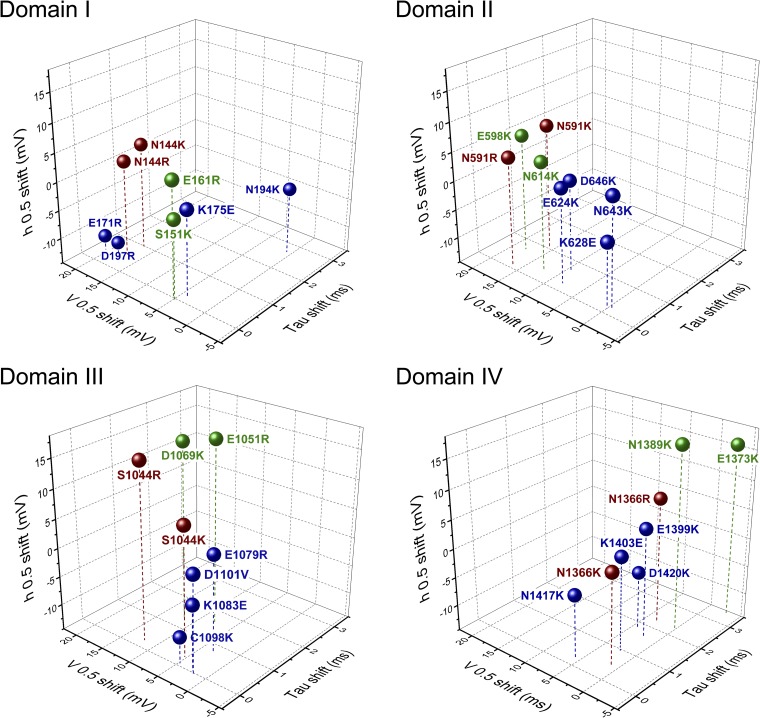
The movement of positively charged S4 segments through the electric field drives the voltage-dependent gating of ion channels. Studies of prokaryotic sodium channels provide a mechanistic view of activation facilitated by electrostatic interactions of negatively charged residues in S1 and S2 segments, with positive counterparts in the S4 segment. In mammalian sodium channels, S4 segments promote domain-specific functions that include activation and several forms of inactivation. We tested the idea that S1-S3 countercharges regulate eukaryotic sodium channel functions, including fast inactivation. Using structural data provided by bacterial channels, we constructed homology models of the S1-S4 voltage sensor module (VSM) for each domain of the mammalian skeletal muscle sodium channel hNaV1.4. These show that side chains of putative countercharges in hNaV1.4 are oriented toward the positive charge complement of S4. We used mutagenesis to define the roles of conserved residues in the extracellular negative charge cluster (ENC), hydrophobic charge region (HCR), and intracellular negative charge cluster (INC). Activation was inhibited with charge-reversing VSM mutations in domains I-III. Charge reversal of ENC residues in domains III (E1051R, D1069K) and IV (E1373K, N1389K) destabilized fast inactivation by decreasing its probability, slowing entry, and accelerating recovery. Several INC mutations increased inactivation from closed states and slowed recovery. Our results extend the functional characterization of VSM countercharges to fast inactivation, and support the premise that these residues play a critical role in domain-specific gating transitions for a mammalian sodium channel.


Figures

Figure 1.
Figure 1.
Homology modeling of sodium channel VSM. (A) Sequence alignments of VSM from bacterial channels NaVRh and NaVAb, and domains I–IV of mammalian sodium channel hNaV1.4. (B) Homology models of each domain of hNaV1.4 based on the NaVAb template, showing relative positions of putative countercharges in S1, S2, and S3 segments, and positively charged residues through R4 in S4 segments. (C) View of homology models in B with S4 residues R1–R3 aligned in each, to show orientation of countercharges to the S4 segment.
Figure 2.
Figure 2.
Conductance in hNaV1.4 and ENC mutations. (A)Traces for wild type and mutant channels in response to depolarizing commands to voltages ranging from −90 mV to +60 mV. I/V relations are shown for ENC mutations in domain I and domain II (B), domain III (C), and domain IV (D). Values represent mean ± SEM (error bars) from 10–22 experiments.
Figure 3.
Figure 3.
Steady-state fast inactivation in hNaV1.4 and for ENC mutations. Channels were conditioned to voltages ranging from −120 mV to +25 mV for 300 ms before test pulses to 30 mV. I/V relations (h curves) are shown for ENC mutations in domain I and domain II (A), domain III (B), domain IV S1 (C), and domain IV S2 (D). Values represent mean ± SEM (error bars) from 10–21 experiments.
Figure 4.
Figure 4.
Fast inactivation kinetics in hNaV1.4 and for ENC mutations. Time constants of current decay are shown for ENC mutations in domain I (A), domain II (B), domain III (S1, C; S2, D), and domain IV (S1, E; S2, F). Values represent mean ± SEM (error bars) from 10–22 experiments.
Figure 5.
Figure 5.
Recovery kinetics in hNaV1.4 and for ENC mutations. (A) Double pulse protocol used to inactivate and recover channels. Traces are shown for recovery up to 50 ms, with some sweeps removed for clarity. Recovery time constants are shown for ENC mutations in domain I and domain II (B), domain III (C), and domain IV (D). Values represent mean ± SEM (error bars) from 10–18 experiments.
Figure 6.
Figure 6.
Activation parameters for mutations at S1 HCR locus in hNaV1.4. (A) Traces shown are responses to depolarization to 0 mV, 20 mV, 40 mV, and 60 mV for mutations in domains I–III. Plots in B, D, and F show I/V relations for mutations in these domains; plots in C, E, and G show activation kinetics. Values represent mean ± SEM (error bars) from 11–24 experiments.
Figure 7.
Figure 7.
Steady-state fast inactivation for HCR mutations. Plots show h curves for hNaV1.4 and S1 mutations in domain I (N144, A), domain II (N591, B), domain III (S1044, C), and domain IV (N1366, D). Values represent mean ± SEM (error bars) from 11–24 experiments.
Figure 8.
Figure 8.
Kinetics of fast inactivation for HCR mutations. Plots show time constants for hNaV1.4 and S1 mutations in domain I (N144, A), domain II (N591, B), domain III (S1044, C), and domain IV (N1366, D). Values represent mean ± SEM (error bars) from 11–24 experiments.
Figure 9.
Figure 9.
Recovery from fast inactivation for HCR mutations. (A) Traces showing inactivating and recovery sweeps for hNaV1.4 and select aspartate or arginine substitutions in domains I, III, and IV. (B–D) Kinetics of recovery at voltages from −120 mV to −70 mV for mutations in these domains. Values represent mean ± SEM (error bars) from 10–22 experiments.
Figure 10.
Figure 10.
Biophysical characterization of INC mutations. (A) Sodium currents in response to command depolarization to voltages from −90 mV to +60 mV. Effects of INC mutations are shown for activation (B), steady-state fast inactivation (C), entry into fast inactivation (D and E), and recovery (F and G). Legends identify residues and locus by domain and segment. Values represent mean ± SEM (error bars) from 10–23 experiments.
Figure 11.
Figure 11.
Three-dimensional plot showing the effect of charge-reversing mutations of residues in ENC (green), HCR (red), and INC (blue) regions. Shown for each domain are shifts in inactivation kinetics at 20 mV (x axis), activation probability (y axis), and inactivation probability (z axis).

References

    1. Aldrich R.W., Corey D.P., Stevens C.F.. 1983. A reinterpretation of mammalian sodium channel gating based on single channel recording. Nature. 306:436–441. 10.1038/306436a0 - DOI - PubMed
    1. Armstrong C.M. 2006. Na channel inactivation from open and closed states. Proc. Natl. Acad. Sci. USA. 103:17991–17996. 10.1073/pnas.0607603103 - DOI - PMC - PubMed
    1. Armstrong C.M., Hille B.. 1998. Voltage-gated ion channels and electrical excitability. Neuron. 20:371–380. 10.1016/S0896-6273(00)80981-2 - DOI - PubMed
    1. Bezanilla F. 2008. Ion channels: from conductance to structure. Neuron. 60:456–468. 10.1016/j.neuron.2008.10.035 - DOI - PubMed
    1. Campos F.V., Chanda B., Roux B., Bezanilla F.. 2007a. Two atomic constraints unambiguously position the S4 segment relative to S1 and S2 segments in the closed state of Shaker K channel. Proc. Natl. Acad. Sci. USA. 104:7904–7909. 10.1073/pnas.0702638104 - DOI - PMC - PubMed

Publication types

Substances

LinkOut - more resources