

Disparate rates of new-onset depression during the menopausal transition in 2 community-based populations: real, or really wrong?
- PMID: 23589585
- PMCID: PMC3649637
- DOI: 10.1093/aje/kws365
Disparate rates of new-onset depression during the menopausal transition in 2 community-based populations: real, or really wrong?
Abstract
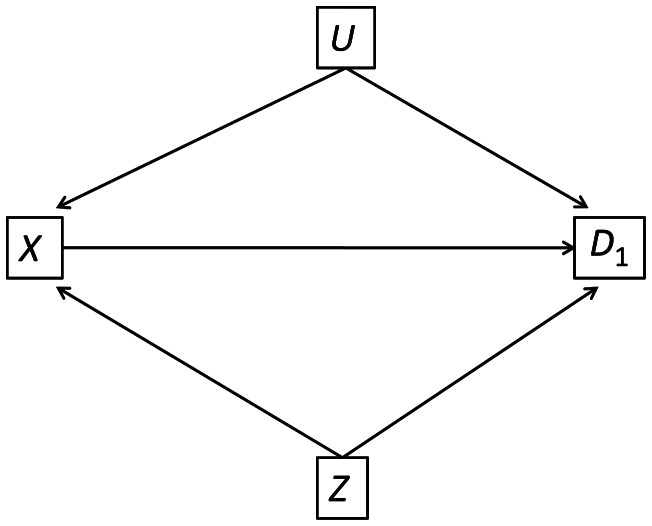
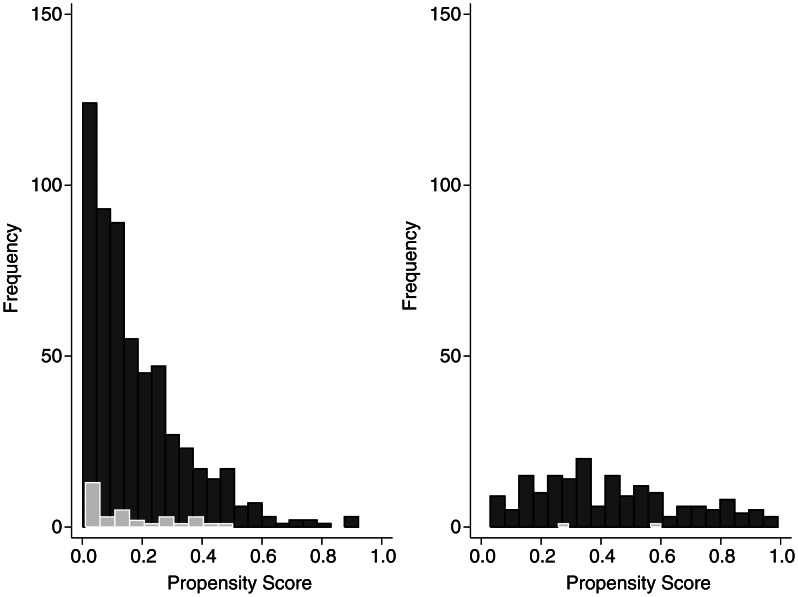
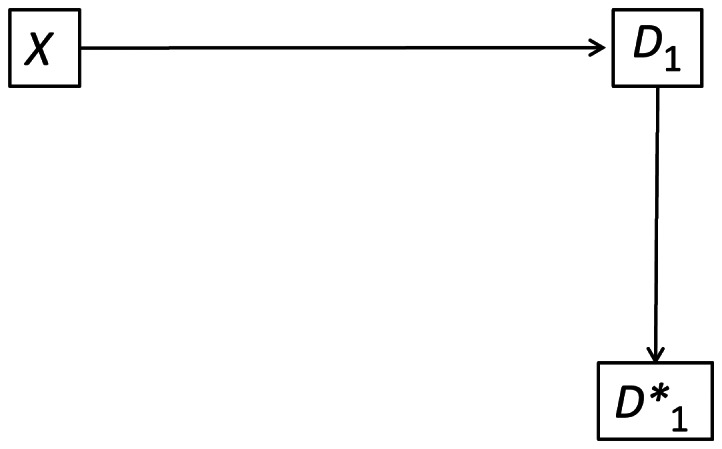
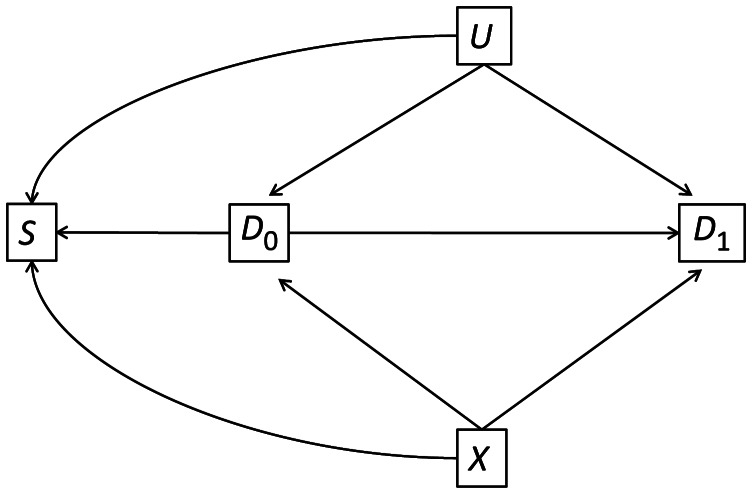
This study took place in eastern Massachusetts and included respondents from the Harvard Study of Moods and Cycles Cohort 1, enrolled between 1995 and 1997, and the Harvard Study of Moods and Cycles Cohort 2, enrolled between 2005 and 2009. In prospectively assessing rates of new-onset depression in 2 populations of late-reproductive-aged women with no Diagnostic and Statistical Manual of Mental Disorders (Fourth Edition) lifetime history of depression, we were surprised to find far lower rates of depression in the population with greater racial diversity and lower socioeconomic status, contrary to what had been reported in the scientific literature. To better understand why these disparate results occurred, we assessed confounding and outcome misclassification as potential explanations for the discrepancy. After determining that these were unlikely explanations for the findings, we explored 2 potential sources of selection bias: one induced by self-referral of healthy participants into the study and the other induced by the design of the study itself. We concluded that both types of selection bias were likely to have occurred in this study and could account for the observed difference in rates.
Keywords: bias; depression; prospective studies.
Figures
Similar articles
-
Risk for new onset of depression during the menopausal transition: the Harvard study of moods and cycles.Arch Gen Psychiatry. 2006 Apr;63(4):385-90. doi: 10.1001/archpsyc.63.4.385. Arch Gen Psychiatry. 2006. PMID: 16585467
-
Associations of hormones and menopausal status with depressed mood in women with no history of depression.Arch Gen Psychiatry. 2006 Apr;63(4):375-82. doi: 10.1001/archpsyc.63.4.375. Arch Gen Psychiatry. 2006. PMID: 16585466
-
A longitudinal analysis of the association between menopause and depression. Results from the Massachusetts Women's Health Study.Ann Epidemiol. 1994 May;4(3):214-20. doi: 10.1016/1047-2797(94)90099-x. Ann Epidemiol. 1994. PMID: 8055122 Clinical Trial.
-
Well-being, symptoms and the menopausal transition.Maturitas. 1996 Mar;23(2):147-57. doi: 10.1016/0378-5122(95)00970-1. Maturitas. 1996. PMID: 8735353 Review.
-
Associations of depression with the transition to menopause.Menopause. 2010 Jul;17(4):823-7. doi: 10.1097/gme.0b013e3181db9f8b. Menopause. 2010. PMID: 20531231 Review.
Cited by
-
Do sex hormones or hormone therapy modify the relation of n-3 fatty acids with incident depressive symptoms in postmenopausal women? The MESA Study.Psychoneuroendocrinology. 2017 Jan;75:26-35. doi: 10.1016/j.psyneuen.2016.10.003. Epub 2016 Oct 14. Psychoneuroendocrinology. 2017. PMID: 27768981 Free PMC article.
-
Depression in the menopause transition: risks in the changing hormone milieu as observed in the general population.Womens Midlife Health. 2015 Aug 11;1:2. doi: 10.1186/s40695-015-0002-y. eCollection 2015. Womens Midlife Health. 2015. PMID: 30766689 Free PMC article. Review.
References
-
- Harlow BL, Wise LA, Otto MW, et al. Depression and its influence on reproductive endocrine and menstrual cycle markers associated with perimenopause: the Harvard Study of Moods and Cycles. Arch Gen Psychiatry. 2003;60(1):29–36. - PubMed
-
- Cohen LS, Soares CN, Vitonis AF, et al. Risk for new onset of depression during the menopausal transition. The Harvard Study of Moods and Cycles. Arch Gen Psychiatry. 2006;63(4):385–390. - PubMed
-
- First MB, Spitzer RL, Gibbon M, et al. New York, NY: Biometrics Research Department, New York State Psychiatric Institute; 1996. Williams Structured Clinical Interview for DSM-IV Axis I Disorders—Non-patient Edition (SCID-I/NP, Version 2.0)
-
- Rosenbaum PR, Rubin DB. The central role of the propensity score in observational studies for causal effects. Biometrika. 1983;70(1):41–55.
Publication types
MeSH terms
Grants and funding
LinkOut - more resources
Full Text Sources
Other Literature Sources
Medical
