. 2013 May 15;190(10):5128-41.
doi: 10.4049/jimmunol.1203396. Epub 2013 Apr 15.

The survival of memory CD8 T cells that is mediated by IL-15 correlates with sustained protection against malaria

Affiliations

The survival of memory CD8 T cells that is mediated by IL-15 correlates with sustained protection against malaria

Stasya Zarling et al. J Immunol. .

Abstract

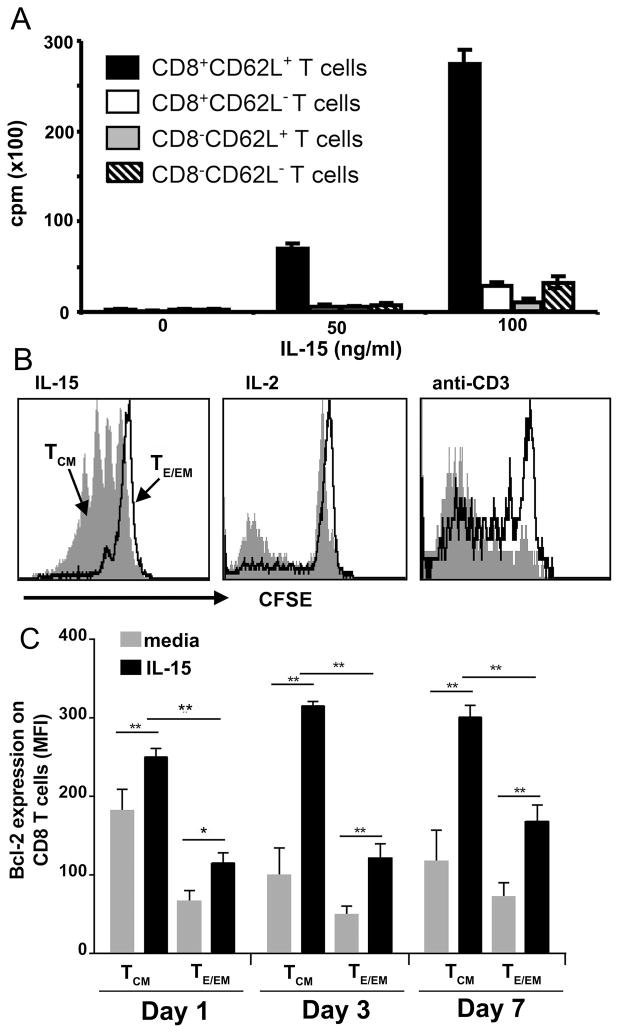
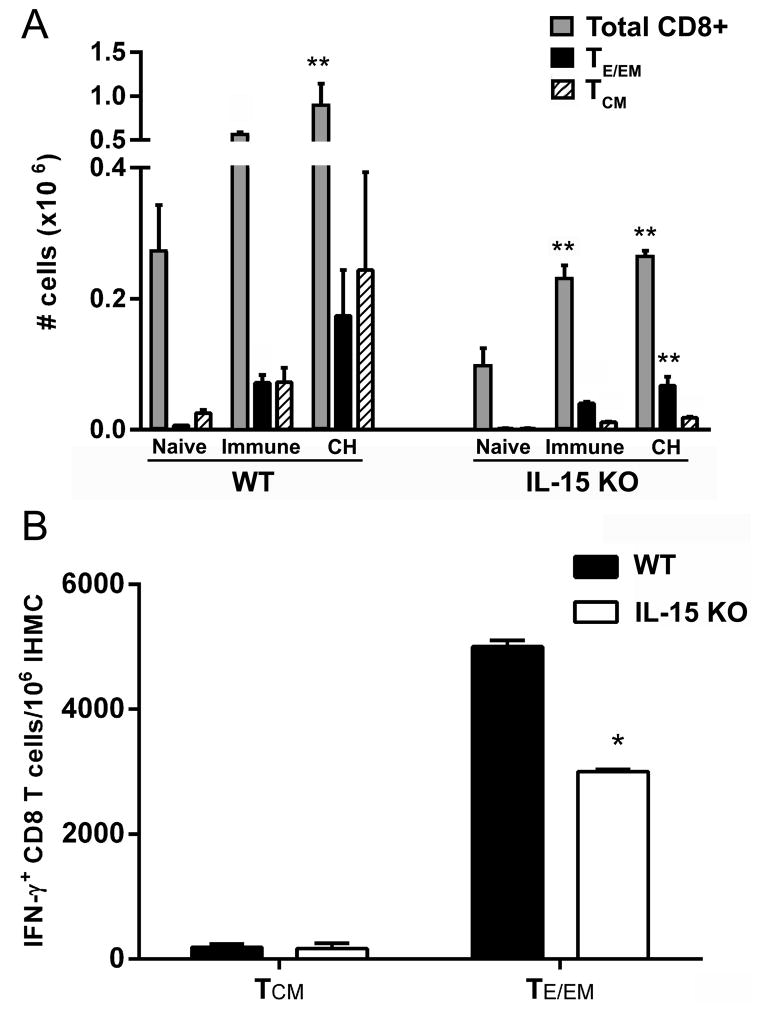
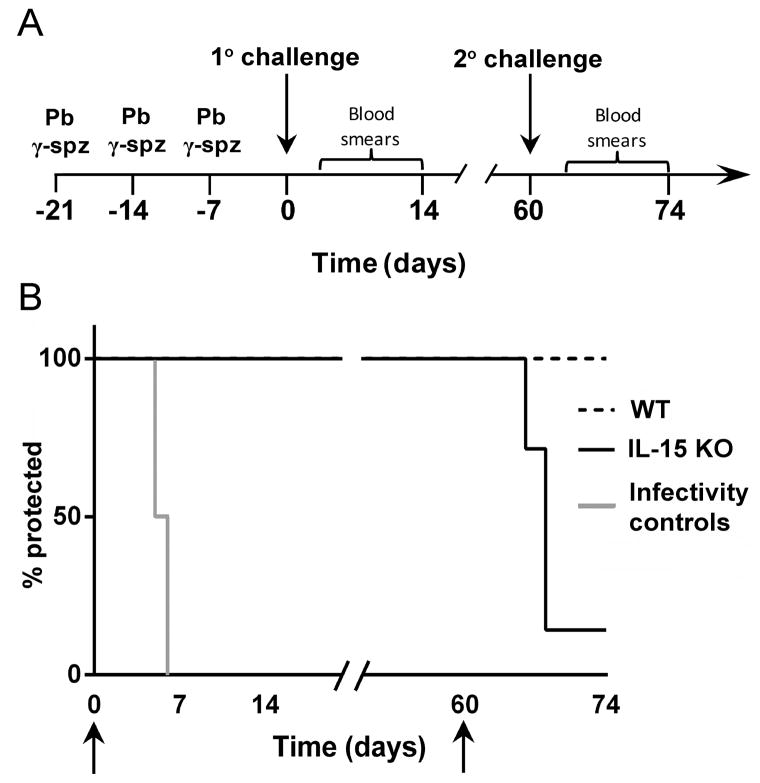
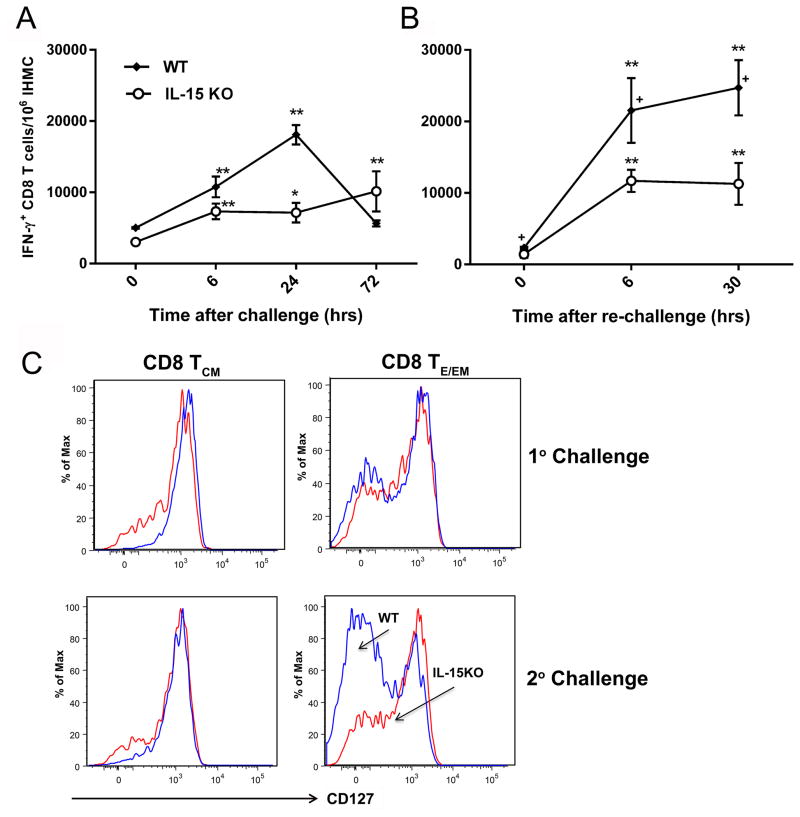
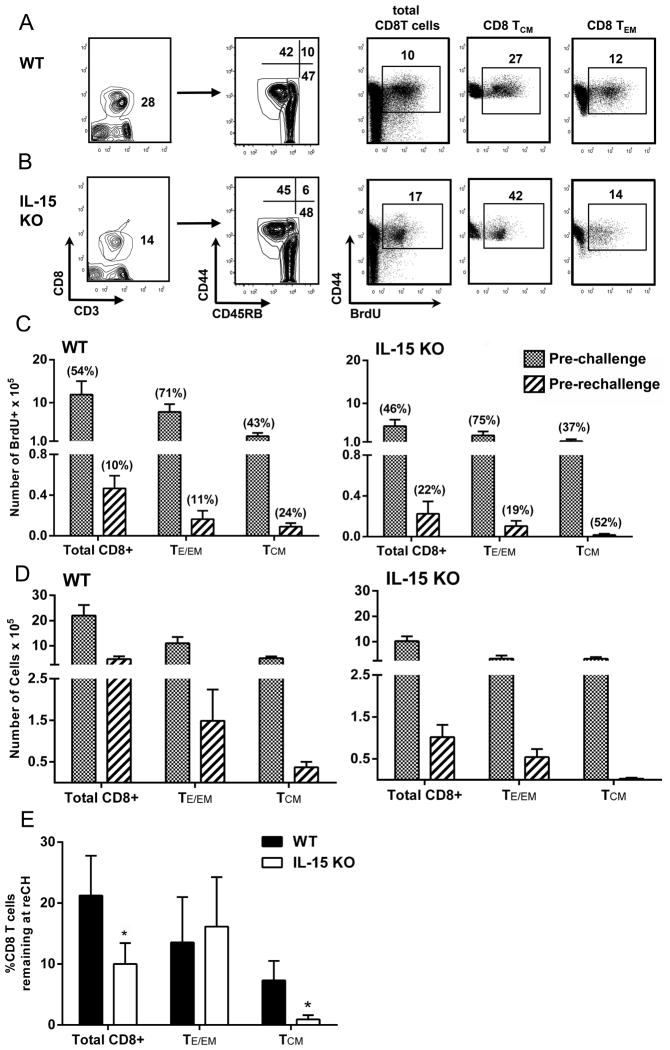
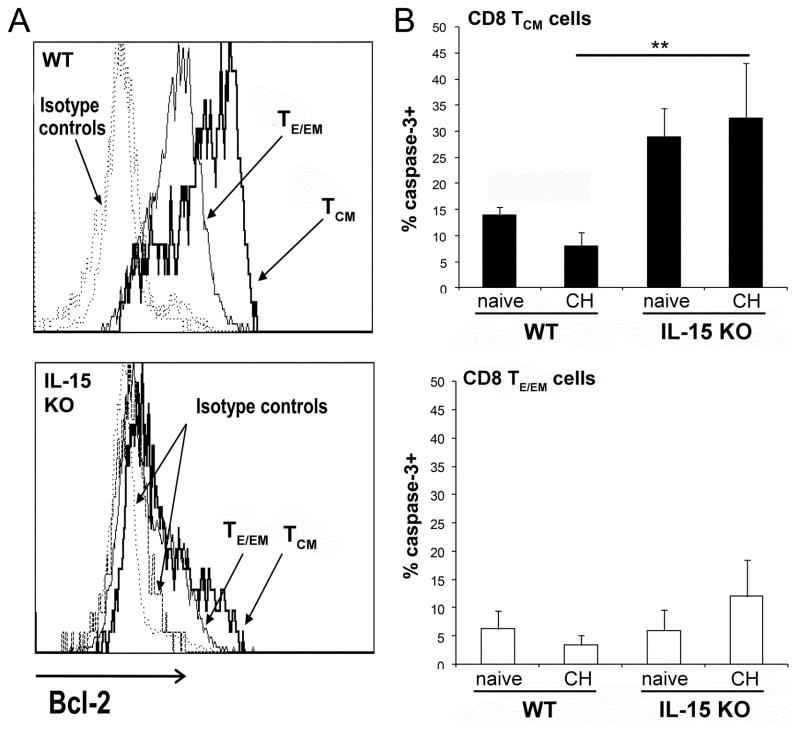
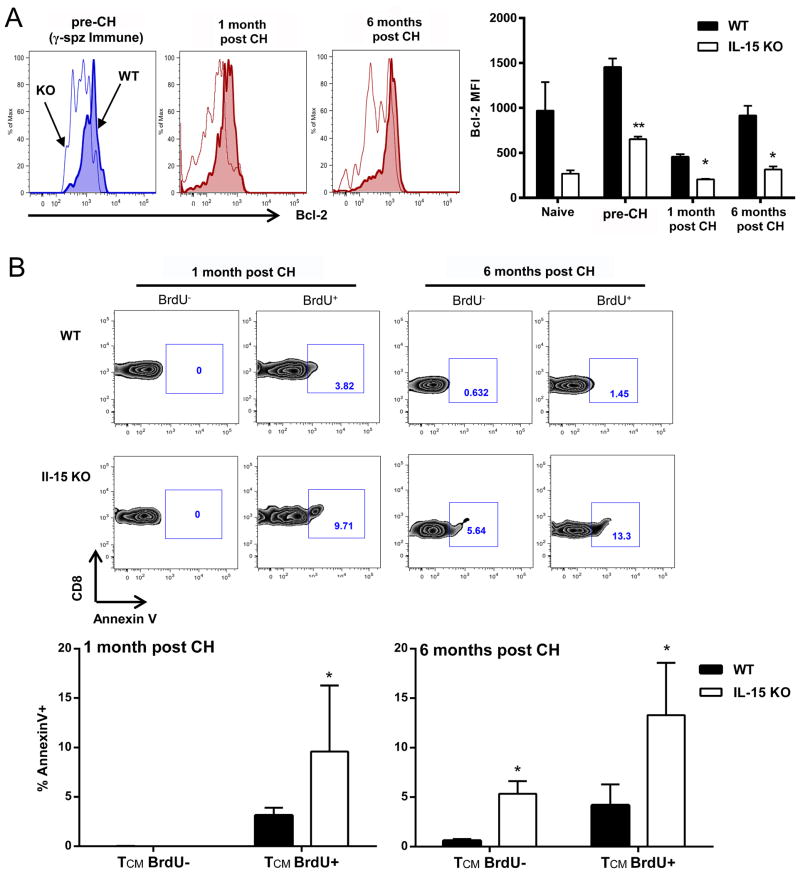
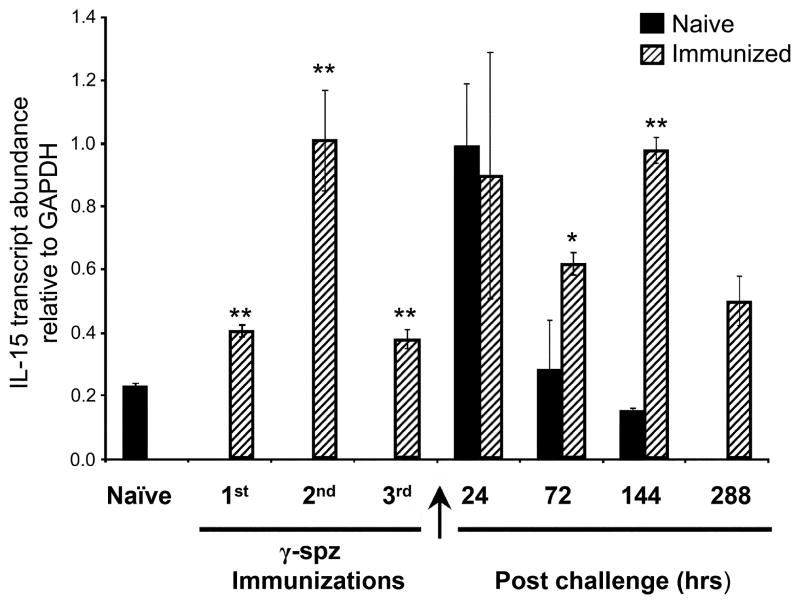
Ag-specific memory T cell responses elicited by infections or vaccinations are inextricably linked to long-lasting protective immunity. Studies of protective immunity among residents of malaria endemic areas indicate that memory responses to Plasmodium Ags are not adequately developed or maintained, as people who survive episodes of childhood malaria are still vulnerable to either persistent or intermittent malaria infections. In contrast, multiple exposures to radiation-attenuated Plasmodium berghei sporozoites (Pb γ-spz) induce long-lasting protective immunity to experimental sporozoite challenge. We previously demonstrated that sterile protection induced by Pb γ-spz is MHC class I-dependent and CD8 T cells are the key effectors. IFN-γ(+) CD8 T cells that arise in Pb γ-spz-immunized B6 mice are found predominantly in the liver and are sensitive to levels of liver-stage Ag depot and they express CD44(hi)CD62L(lo) markers indicative of effector/effector memory phenotype. The developmentally related central memory CD8 T (TCM) cells express elevated levels of CD122 (IL-15Rβ), which suggests that CD8 TCM cells depend on IL-15 for maintenance. Using IL-15-deficient mice, we demonstrate in this study that although protective immunity is inducible in these mice, protection is short-lived, mainly owing to the inability of CD8 TCM cells to survive in the IL-15-deficient milieu. We present a hypothesis consistent with a model whereby intrahepatic CD8 TCM cells, being maintained by IL-15-mediated survival and basal proliferation, are conscripted into the CD8 effector/effector memory T cell pool during subsequent infections.


Figures

Figure 1
Figure 1. CD8 TCM cells, having elevated expression of IL-15Rβ (CD122), are the primary cells responding to IL-15
IHMC were isolated from C57BL/6 mice (3 per group) 1 month after a tertiary immunization with Pb γ-spz. (A) CD62L+ and CD62L T cells were separated by magnetic bead isolation procedure; a second round of isolation using CD8 magnetic beads resulted in the following subpopulations: CD8+CD62L+ and CD8+CD62L T cells as well as CD8CD62L+ and CD8CD62L T cells. Each T cell subset was cultured at 4 × 10⁵ cells/0.2 ml culture medium for 96 hours in the presence of the indicted concentrations of IL-15; during the last 16hrs of culture, 1μCi of 3H-TdR was added to each well. Results are presented as the mean CPM ± SD of 3H-TdR uptake in triplicate wells and are representative of 3 separate experiments. (B) Liver CD8 T cells, isolated by negative magnetic beads selection, were stained with CFSE and incubated for 7 days in the presence of 100 ng/ml IL-15, or 100ng/ml IL-2. Harvested cells were stained with mAbs against CD8, CD44 and CD45RB. Lymphocytes were gated on a forward-side scatter plot, and gates were applied to identify CD8+ T cells that expressed either CD44hiCD45RBhi (TCM cells) or CD44hiCD45RBlo (TE/EM cells) phenotypes. Histogram plots represent CFSE dilution with gray shaded area representing CD8 TCM cells and solid contour line representing CD8 TE/EM cells. These results represent one of two separate experiments. (C) Liver CD8 T cells were cultured in the presence of either 100 ng/ml IL-15, or medium alone. Cells were harvested on day 1, 3, and 7 and stained with mAbs against CD44 and CD45RB as described above, fixed, permeabilized and stained with mAbs against Bcl-2. Mean fluorescent intensity (determined for each individual mouse and is presented as the mean ± SD) of Bcl-2 expression of TCM or TE/EM. Bcl-2 determinations on CD8 TCM and CD8 TE/EM cells prior to culture showed MFI=189± 45 for CD8 TCM and MFI= 76± 35 for CD8 TE/EM. Results are representative of 3 separate experiments. *p<0.05, **p<0.01.
Figure 2
Figure 2. IL-15KO CD8 T cells respond to antigen from Pb γ-spz
Wt and IL-15KO mice (3–5 mice/group) were immunized with 3 weekly doses of Pb γ-spz followed one week later by infectious sporozoite challenge as described in materials and methods. (A) Livers from naïve, immune, or immune/challenged (CH) mice were isolated 1 week after last exposure to antigen and stained with anti-CD3, -CD8, -CD44, -CD62L mAbs to determine the number of total CD8 T cells, CD8 TE/EM cells and CD8 TCM cells. The results show the number of cells as the mean ± SD (B) IHMC were isolated from wt and IL-15KO mice one week following the 3rd immunization with Pb γ-spz. IFN-γ was detected by cytokine secretion assay, as described in Materials and Methods. CD8 T cells were enriched by magnetic bead separation and CD44hiCD45RBhi or CD44hiCD45RBlo T cells were identified by flow cytometry. The results are representative of several experiments performed under the same conditions and show the number of IFN-γ secreting CD8 TCM cells and CD8 TE/EM cells per 106 IHMC determined for each individual mouse and are presented as the mean ± SD, *p<0.05, **p<0.01.
Figure 3
Figure 3. Immunization with Pb γ-spz induces sterile protection in IL-15KO mice at primary, but not upon secondary challenge
(A) A schematic representation is shown for immunization with Pb γ-spz and 1° and 2° challenge regimen. Wt and IL-15KO mice (5 mice/group) were immunized 3 times with Pb γ-spz one week apart (day -21, -14, -7) and were challenged with infectious sporozoites one week later, day 0, for 1°challenge. Mice were monitored for parasitemia by thin blood smears starting on day 4 and continuing for 14 days after the challenge. Two months later (~day 60), wt and IL-15KO mice protected previously at 1° challenge received a 2° challenge with 10K infectious sporozoites and mice were monitored daily for parasitemia starting on day 3 and continuing for 14 days post 2° challenge. Mice that became parasitemic were considered not protected. (B) Arrows represent days of challenge, results expressed as % sterile protection are from several separately performed experiments. Naïve mice that received 10K infectious sporozoites served as infectivity controls. In two out of more than 10 experiments that yielded reproducible protection results, IL-15KO mice became parasitemic after the 1° challenge. Although the reasons for the failure to protect IL-15KO mice are multi-fold, including the quality of the sporozoite preparations, we noted that the IL-15KO mice used in these two experiments were considerably older than mice that we typically use.
Figure 4
Figure 4. Failure to maintain protracted protection in IL-15KO mice is partly due to low numbers of IFN-γ producing CD8 T cells and the inability to transition to CD127lo TE/EM cells
Pb γ-spz immunized wt and IL-15KO mice received 1° and 2° challenge with infectious sporozoites as described in legend for Fig. 3. At indicated time (hrs) points after (A) 1°challenge and (B) 2° challenge (re-challenge at 2 months after 1°challenge), liver CD8 TE/EM cells were examined for IFN-γ by cytokine secretion assay by flow cytometry as described in Materials and Methods and in legend for Fig. 2B. Results from a representative of three separate experiments are shown as the mean ± SD of the number of IFN-γ+CD8 T cells/106 IHMC from 3 mice per group. *p<0.05, **p<0.01 indicates significance of each time point relative to 0hrs. + p<0.05 indicates significance between wt and IL-15KO mice. (C) IHMC were isolated 24 hrs following 1° or 2° challenge, as described in legend for Fig. 3B. Representative flow plots show results for CD127 expression on CD8 TCM and CD8 TE/EM at 24 hrs after 1° or 2° challenge. The CD127-population was induced after the 3 immunizations with Pb γ-spz and it reverted back to CD127+ populations over time. As shown here, the CD127- population returned upon challenge and re-challenge with infectious Pb sporozoites of wt mice; in IL-15KO mice, the CD127- population was substantially reduced in re-challenged mice.
Figure 5
Figure 5. Attrition of CD8 TCM cells in Pb γ-spz immunized IL-15KO mice at 2° challenge
Groups of wt and IL-15KO mice were immunized with Pb γ-spz or immunized and challenged as described in the legend for Fig. 3. BrdU was given to mice in drinking water for 7 days prior to analysis as described in Materials and Methods section. Results in (A) and (B) show gating strategy of liver CD3+CD8 T cells that express CD44 and CD45RB phenotype and are BrdU+ (A) wt and (B) IL-15KO mice. The numbers within each panel show the percentage of the indicated CD8 T cell phenotype. The results shown are from an analysis of liver CD8 T cells from a single mouse and are representative of three independent experiments. (C) Results show absolute numbers × 105 of BrdU+CD8 T cells and BrdU+CD8 T cell memory subsets from livers of wt and IL-15KO mice prior to 1° challenge (pre-challenge, i.e., ~7 days after the last immunization with Pb γ-spz) and 2° challenge (pre-re-challenge, i.e., ~60 days after 1° challenge) and are expressed as the mean ± SD of responses from 3–4 mice/group. The numbers in ( ) above each bar indicate the % of BrdU+ cells for each CD8 T cell population in wt and IL-15KO mice. (D) Results show absolute numbers × 105 of total CD8 T cells and CD8 T cell memory subsets from livers of wt and IL-15KO mice prior to 1° and 2° challenge and are expressed as the mean ± SD of responses from 3–4 mice/group. (E) Results show the % of total CD8 T cells, CD8 TE/EM and CD8 TCM cells remaining at time of 2° challenge. The percent of the remaining cells was calculated as follows: at 1° challenge, the number of total CD8 T cells and each of the CD8 T cell subset was considered as a 100% and the number of each of the respective CD8 T cells counted at 2° challenge was considered as a percent of the cells at 1° challenge, which is indicated by the black bars for wt mice and by the clear bars for IL-15KO mice, *p<0.05.
Figure 6
Figure 6. CD8 TCM cells from IL-15KO mice display reduced expression of anti-apoptotic molecules and increased cell death
Liver CD8 TE/EM cells and CD8 TCM cells from Pb γ-spz immunized and challenged wt and IL-15KO mice (3 per group) were identified by flow cytometry as described in legend for figure 2 and were analyzed for the expression of (A) Bcl-2 two months after 1° challenge. The results shown represent one of two separate experiments. (B) IHMC were isolated 2 months after 1° challenge and stained with anti-CD8, -CD44 and -CD45RB mAbs, fixed, permeabilized and stained with mAbs against caspase-3. Naïve mice served as controls. The results, expressed as % caspase-3+ CD8 TCM cells and CD8 TE/EM cells in wt and IL-15KO mice, were determined for each individual mouse and are presented as the mean ± SD of 3 mice/group, **p<0.01. The results represent one of two experiments.
Figure 7
Figure 7. Proliferating (BrdU+) cells in IL-15KO mice display an increase in cell death
Wt or IL-15KO mice were immunized with Pb γ-spz and given 1° challenge as in legend for Fig. 4. Naive, Immune (pre-challenge), and 1 month or 6 months post challenge mice were fed BrdU in drinking water as described in the legend for Fig. 5, and CD8 TCM cells were gated based on CD3+CD8+CD44hiCD62L phenotype. (A) Bcl-2 expression by proliferating (BrdU+) CD8 TCM cells at indicated time points. Data shown are from one representative mouse per group. Bar graph shows Bcl-2 MFI of BrdU+ CD8 TCM cells, represented as the mean ± SD for 3–5 mice/group. (B) AnnexinV expression by either proliferating (BrdU+) or non-proliferating (BrdU) cells presented as %AnnexinV+. Representative flow plots are from one mouse per group, bar graph shows the mean ± SD of 5 mice/group, *p<0.05, **p<0.01. Data are representative of two independent experiments.
Figure 8
Figure 8. Kupffer cells are a source of IL-15 in the liver
IHMC were isolated from livers of naïve, Pb γ-spz immunized and immunized/challenge mice at the indicated time points. Mac3+ KC were isolated as described in Materials and Methods section and were lysed in TRIzol for RNA isolation and subsequently reverse transcribed for RT-PCR assay. Assays were done on a 96-well plate format and the detection of the PCR products was performed as described in the Materials and Methods section. Quantitative IL-15 gene expression is shown as a ratio of IL-15 to GapDH for each time point and results are expressed as the mean ±SD of triplicate wells. *p<0.05, **p<0.01. Similar results were observed in thrice performed experiments.

Similar articles

Cited by

References

    1. Ahmed R, Gray D. Immunological memory and protective immunity: understanding their relation. Science. 1996;272:54–60. - PubMed
    1. Murali-Krishna K, Lau LL, Sambhara S, Lemonnier F, Altman J, Ahmed R. Persistence of memory CD8 T cells in MHC class I-deficient mice. Science. 1999;286:1377–1381. - PubMed
    1. Berenzon D, Schwenk RJ, Letellier L, Guebre-Xabier M, Williams J, Krzych U. Protracted protection to Plasmodium berghei malaria is linked to functionally and phenotypically heterogeneous liver memory CD8+ T cells. J Immunol. 2003;171:2024–2034. - PubMed
    1. Zammit DJ, Turner DL, Klonowski KD, Lefrancois L, Cauley LS. Residual antigen presentation after influenza virus infection affects CD8 T cell activation and migration. Immunity. 2006;24:439–449. - PMC - PubMed
    1. Suresh M, Whitmire JK, Harrington LE, Larsen CP, Pearson TC, Altman JD, Ahmed R. Role of CD28-B7 interactions in generation and maintenance of CD8 T cell memory. J Immunol. 2001;167:5565–5573. - PubMed

Publication types