. 2013 May 15;190(10):5030-6.
doi: 10.4049/jimmunol.1203325. Epub 2013 Apr 15.

Butyrophilin Btn2a2 inhibits TCR activation and phosphatidylinositol 3-kinase/Akt pathway signaling and induces Foxp3 expression in T lymphocytes

Affiliations

Butyrophilin Btn2a2 inhibits TCR activation and phosphatidylinositol 3-kinase/Akt pathway signaling and induces Foxp3 expression in T lymphocytes

Johannes U Ammann et al. J Immunol. .

Abstract

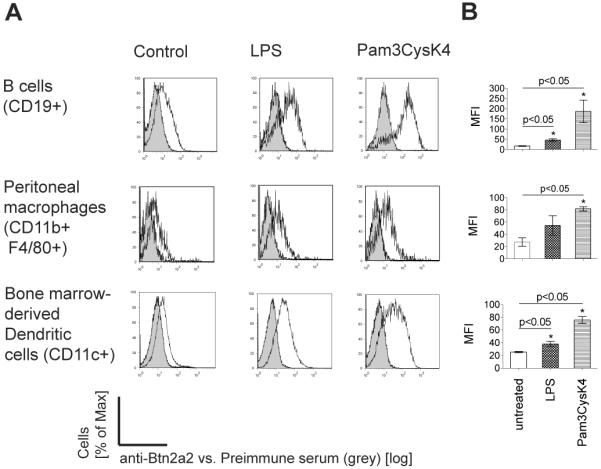
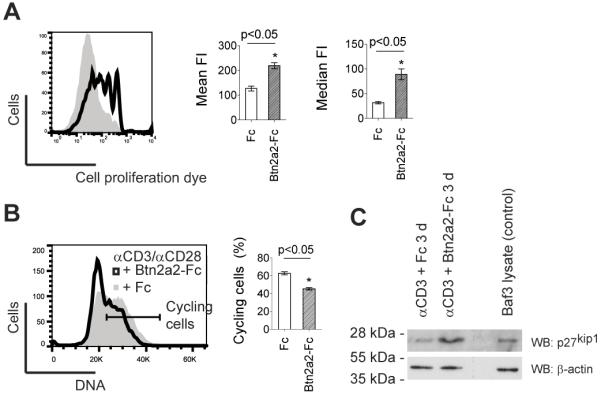
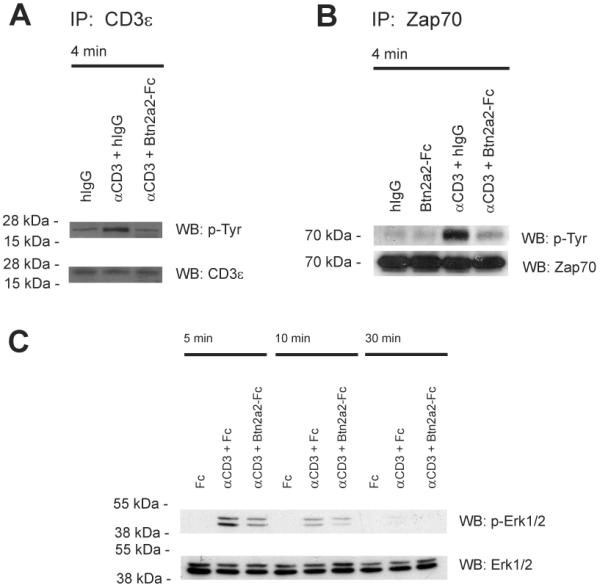
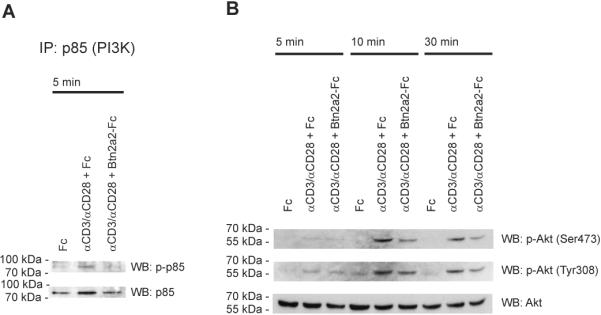
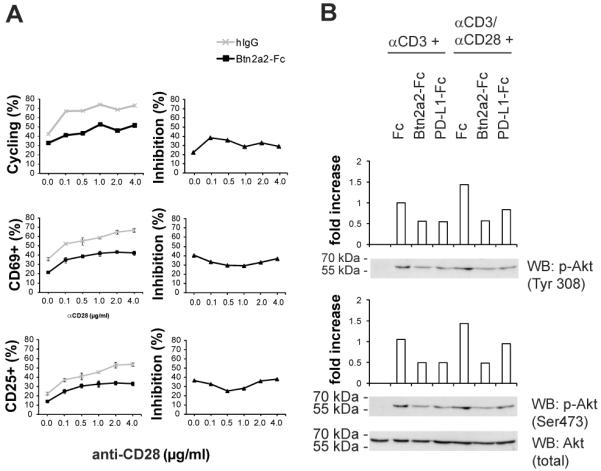
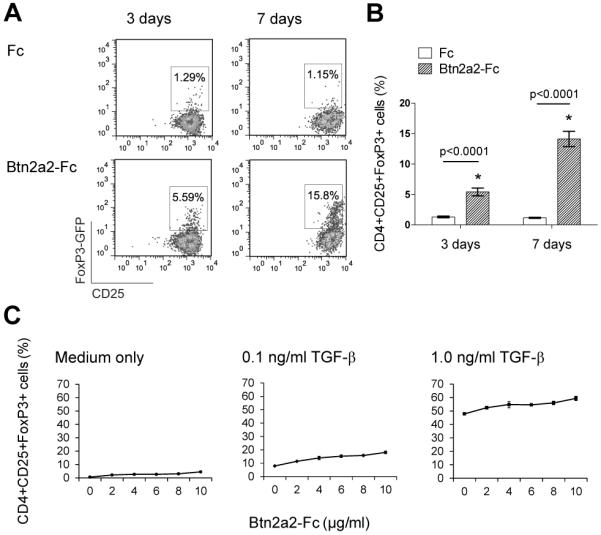
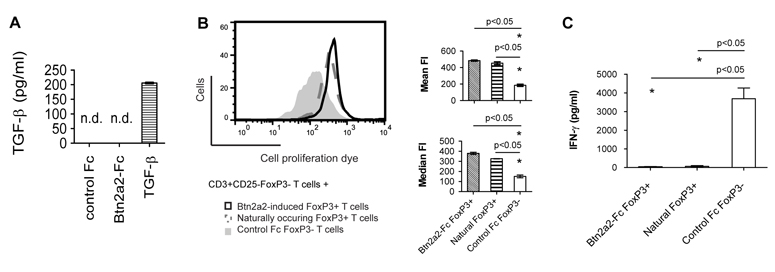
The butyrophilin-related protein Btn2a2 was upregulated on murine APC including CD19(+) B cells, CD11b(+)F4/80(+) peritoneal macrophages, and CD11c(+) bone marrow-derived dendritic cells after activation with LPS or Pam3CysK4, suggesting a role in modulation of T lymphocytes. Consistent with this, binding of mouse Btn2a2-Fc to CD3(+) primary mouse T cells stimulated with anti-CD3 and anti-CD28 reduced the number of proliferating cells and entry of cells into the cell cycle. Binding of Btn2a2-Fc to anti-CD3-stimulated T cells inhibited CD3ε, Zap70, and subsequent Erk1/2 activation. It also interfered with activation of the regulatory subunit of PI3K, p85, and activation of Akt in T cells stimulated with both anti-CD3 and anti-CD28. Inhibition of Akt activation by Btn2a2-Fc was, in contrast to inhibition by programmed death ligand-1-Fc, not overcome by anti-CD28 costimulation. Using Foxp3-GFP-transgenic, naive T cells, Btn2a2-Fc induced de novo expression of Foxp3 in a dose-dependent manner, and Btn2a2-Fc-induced CD4(+)CD25(+)Foxp3(+) T cells had inhibitory properties. The data indicate an important physiological role for Btn2a2 in inhibiting T cell activation and inducing Foxp3(+) regulatory T cells.


Figures

Figure 1
Figure 1. Increased cell surface expression of Btn2a2 on APC after activation
APC: Splenic B cells; bone marrow DC (20 ng/ml GM-CSF, 10 ng/ml IL-4); peritoneal macrophages enriched by adhesion to plastic. Activation was for 16 h with 100 ng/ml LPS or 1 μg/ml Pam3CysK4. (A) Anti-Btn2a2 antibody (black outline), pre-immune serum (grey filled). (A) Data representative of 3 experiments. (B) Significance (p < 0.05) confirmed with paired t-test (*).
Figure 2
Figure 2. Btn2a2 inhibited entry into the cell cycle of anti-CD3 and anti-CD28-activated CD3+ primary T cells
T cells from spleen and lymph nodes were stimulated for 4 d using 1 μg/ml anti-CD3, 1 μg/ml anti-CD28, and 10 μg/ml fusion protein. (A) Cell proliferation of cells 4 d after activation in Btn2A2-Fc (black outline) or Fc control (grey area) visualized with 1 μM eFluor670. (B) DNA content visualized using propidium iodide. % cycling cells (horizontal bar) calculated by subtracting the two-fold percentage of cells in the left hand part of the G0/G1 peak from 100%. (C) 4 d after activation of cells with 1 μg/ml anti-CD3 in presence of Fc control or BTN2A2-Fc, expression of the cell cycle entry inhibitor p27kip1 was analysed by western blotting for p27kip1. 1×10⁵ cells per lane. Mouse Baf/3 cells were positive control for p27kip1. Loading control: β-actin. FACS data representative of 3 experiments with 3 replicates. Statistically significance as for Fig. 1.
Figure 3
Figure 3. Btn2a2 co-ligation inhibits T cell receptor signaling in anti-CD3 activated T cells
(A) 2B4 cells were stimulated for 4 min with 1 μg/ml anti-CD3 (clone 2c11) in 10 μg/ml Btn2a2-Fc or hIgG. Control: 2B4 cells stimulated with 10 μg/ml hIgG. After immunoprecipition with anti-CD3ε (clone CD3-12) and SDS-PAGE analysis was for tyrosine phosphorylation (4G10). (B) 2B4 cells stimulated 5 min with 1 μg/ml anti-CD3 in 10 μg/ml Btn2a2-Fc or hIgG. After lysis, samples were immunoprecipitated with biotinylated anti-Zap70 antibody, treated as in A and analysed for phosphorylation (4G10). (C) CD3+ primary T cells were stimulated with 1 μg/ml anti-CD3 and 10 μg/ml fusion protein, treated as above, and analysed for phosphorylation of Erk1 and Erk2 (p-Erk1/2). Antibody to total Erk1/2 (Erk1/2) was used for loading. Data from >2 independent experiments.
Figure 4
Figure 4. Btn2a2 binding interferes with activation of the PI3K/Akt pathway in anti-CD3 and anti-CD28-activated T cells
CD3+ T cells stimulated with 1 μg/ml anti-CD3, 1 μg/ml anti-CD28 and 10 μg/ml fusion protein as indicated. (A) Samples were immunoprecipitated with anti-p85 antibody, treated as in 3, and phosphorylation analysed using a p-p85 antibody. p85 antibody (total-p85) controlled loading. (B) Blotted proteins were analysed for phosphorylation of Akt using antibodies (p-Akt (Ser473) or p-Akt (Tyr308)). Antibody to total Akt (Akt) - sample loading. Data representative of 3 experiments.
Figure 5
Figure 5. Btn2a2-mediated inhibition of anti-CD3-induced T cell activation cannot be overcome by anti-CD28 co-stimulation
(A) CD3+ T cells activated for 3 d with 1 μg/ml anti-CD3, either 10 μg/ml Btn2a2-Fc or hIgG, and anti-CD28. Hoechst 33342 was used for DNA cell cycle analysis, and CD69 and CD25 antibodies for T cell activation (left). Relative inhibition (right) was calculated by dividing % cycling cells stimulated with anti-CD3 and Btn2a2-Fc by % cycling cells with anti-CD3 and hIgG. The quotient was multiplied by 100% for the % ratio. 3 replicates per sample with data from 3 experiments. (B) T cells stimulated for 30 min with 1 μg/ml anti-CD3 and 10 μg/ml fusion protein or 1 μg/ml anti-CD3, 5 μg/ml anti-CD28, and 10 μg/ml fusion protein. Fusion proteins: Fc backbone alone or the Btn2a2-Fc or PD-L1-Fc. Antibody for total Akt (Akt)was used for equal loading. Intensities measured were relative to stimulation with anti-CD3 and Fc. Data from 3 experiments.
Figure 6
Figure 6. Btn2a2-Fc binding induces de-novo expression of Foxp3 in naive primary T cells
Naive T cells (CD4+ Foxp3−, CD25−, CD62Lhigh) were sorted from enriched CD4+ T cells, harvested from spleen and lymph nodes of NOD Foxp3-GFP mice. (A) Cells were activated for 3 d or 7 d with 1 μg/ml anti-CD3, 1 μg/ml anti-CD28 and 10 μg/ml fusion protein and analysed for Foxp3-GFP expression. (B) Statistical analysis using an ANOVA test. Significance (p < 0.05). (C) Cells activated for 3 d with 1 μg/ml anti-CD3, 1 μg/ml anti-CD28 and 10 μg/ml fusion protein as indicated in medium only, or in medium supplemented with 0.1 ng/ml, or 1.0 ng/ml TGF–β. Cells shown in (A) and (B) were gated on lymphocytes, single cells, CD4+ cells. Cells in (C) also gated on CD25+. Data from > 3 independent experiments. Three independent samples analyzed per data set (B) and (C). Data shown in (A) is representative of 4 replicates.
Figure 7
Figure 7. Btn2a2-Fc induced CD4+CD25+Foxp3+ cells inhibit T cell proliferation and do not secrete TGF-β or IFN-γ
(A) CD4+CD25− CD62Lhigh Foxp3− cells from NOD Foxp3-GFP transgenic mice were activated for 4 d using 1 μg/ml anti-CD3, 1 μg/ml anti-CD28 and 10 μg/ml Btn2a2-Fc or Fc fusion protein, or 1 ng/ml TGF-β. 4 days after initial stimulation, TGF-β was assayed in supernatants. (B) After 4 d, cells were sorted and CD4+CD25+Foxp3+ (“Btn2a2 Foxp3+”) or CD4+CD25+Foxp3− (“Control Foxp3−”) T cells were incubated 1:1 with freshly harvested and sorted CD3+CD25−Foxp3− from the same mouse strain. CD3+CD25−Foxp3− T cells were stained with 1 μM eFluor. Mixed cells were activated with 1 μg/ml anti-CD3, 1 μg/ml anti-CD28 and 10 μg/ml control Fc fusion protein. Positive control: CD4+CD25+Foxp3+ (Natural Foxp3+) from freshly harvested spleen and lymph nodes. After 4 d, proliferation of CD8+ T cells analyzed by FACS. Left: representative FACS plot; Right: summary MFI data (C) Concentration of IFN-γ was measured by ELISA. Experiments were repeated x3 and 3 independent samples were analysed. Significance (p < 0.05) with unpaired t-test (*). n.d. not detected.

References

    1. Heid HW, Winter S, Bruder G, Keenan TW, Jarasch ED. Butyrophilin, an apical plasma membrane-associated glycoprotein characteristic of lactating mammary glands of diverse species. Biochim Biophys Acta. 1983;728:228–238. - PubMed
    1. Vernet C, Boretto J, Mattéi MG, Takahashi M, Jack LJ, Mather IH, Rouquier S, Pontarotti P. Evolutionary study of multigenic families mapping close to the human MHC class I region. J Mol Evol. 1993;37:600–612. - PubMed
    1. Rhodes DA, Stammers M, Malcherek G, Beck S, Trowsdale J. The cluster of BTN genes in the extended major histocompatibility complex. Genomics. 2001;71:351–362. - PubMed
    1. Tazi-Ahnini R, Henry J, Offer C, Bouissou-Bouchouata C, Mather IH, Pontarotti P. Cloning, localization, and structure of new members of the butyrophilin gene family in the juxta-telomeric region of the major histocompatibility complex. Immunogenetics. 1997;47:55–63. - PubMed
    1. Stammers M, Rowen L, Rhodes D, Trowsdale J, Beck S. BTL-II: a polymorphic locus with homology to the butyrophilin gene family, located at the border of the major histocompatibility complex class II and class III regions in human and mouse. Immunogenetics. 2000;51:373–382. - PubMed

Publication types

MeSH terms