

Role of GLP-1 in the Hypoglycemic Effects of Wild Bitter Gourd
- PMID: 23589719
- PMCID: PMC3621175
- DOI: 10.1155/2013/625892
Role of GLP-1 in the Hypoglycemic Effects of Wild Bitter Gourd
Abstract
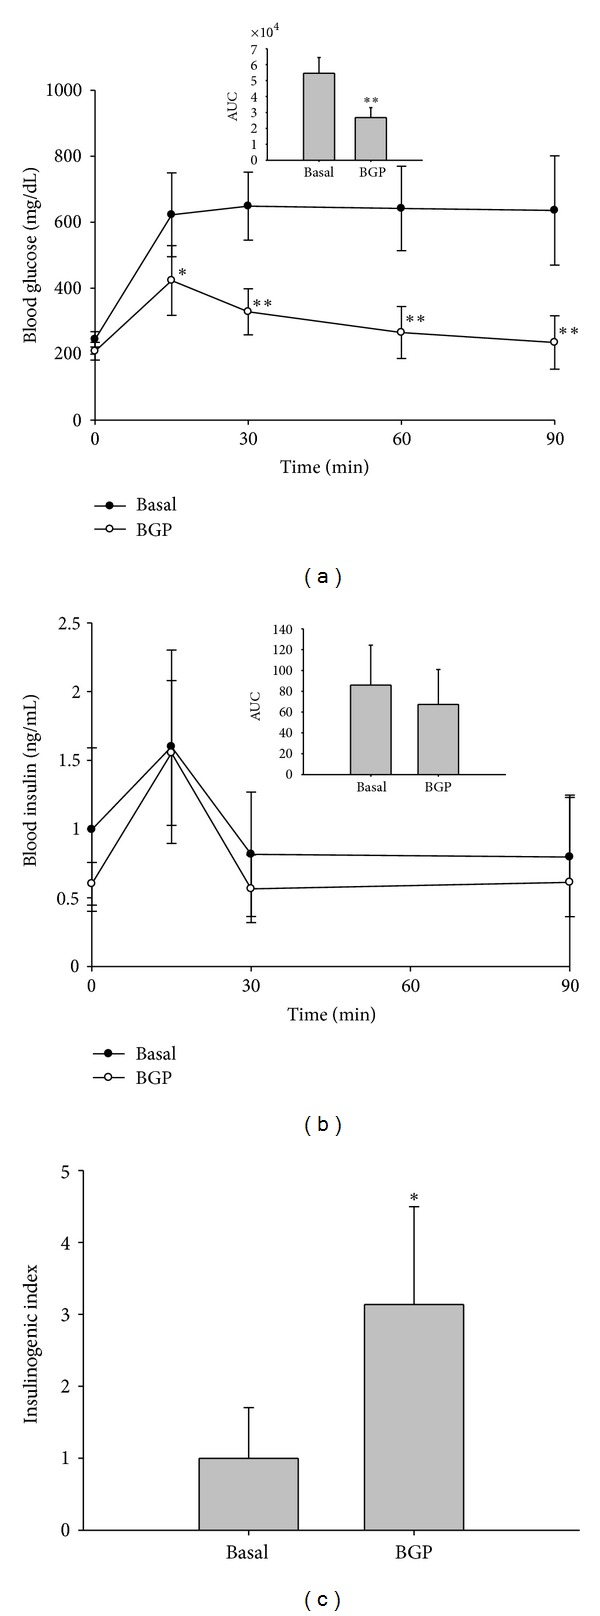
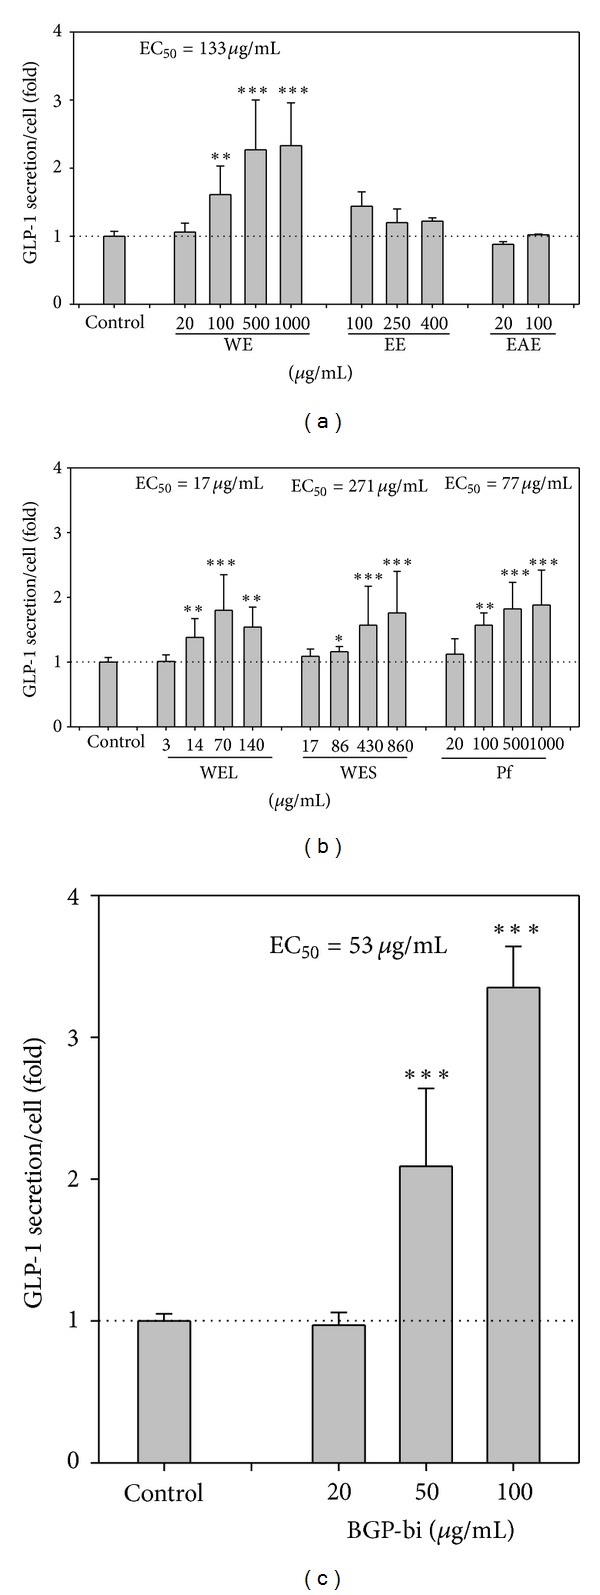
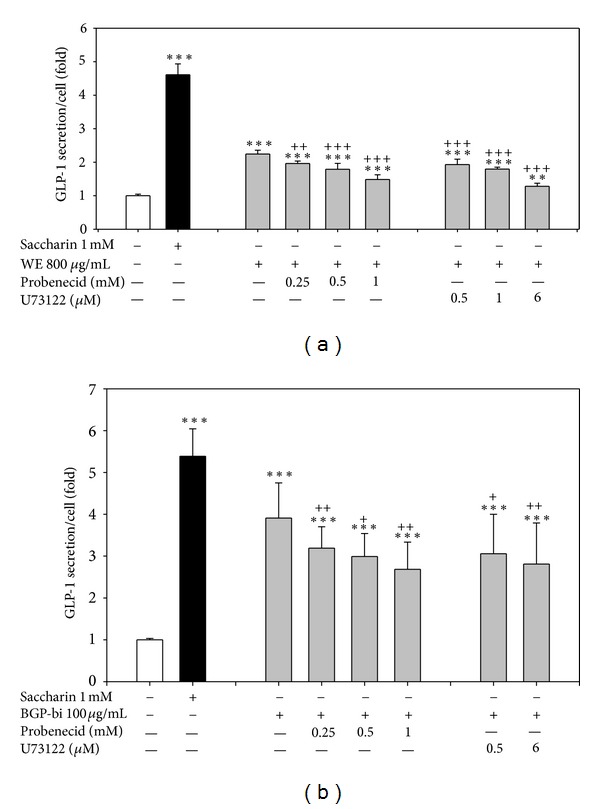
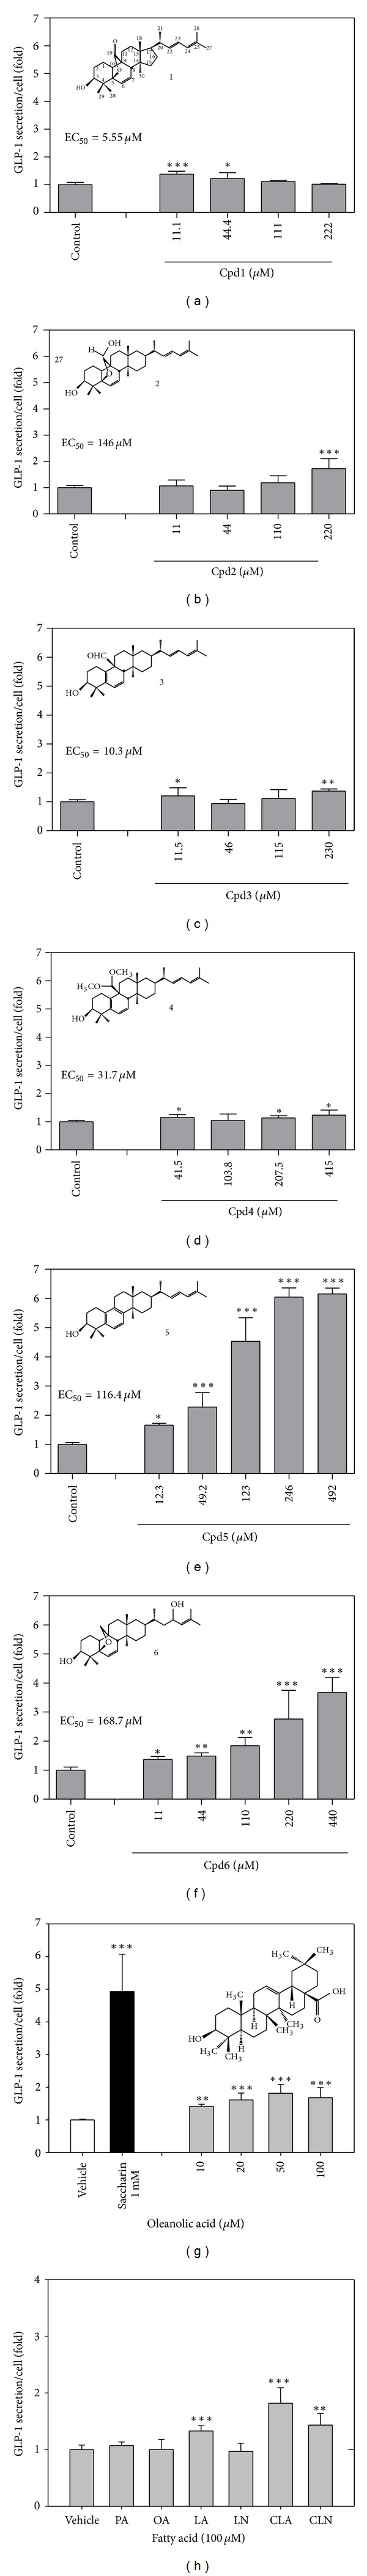
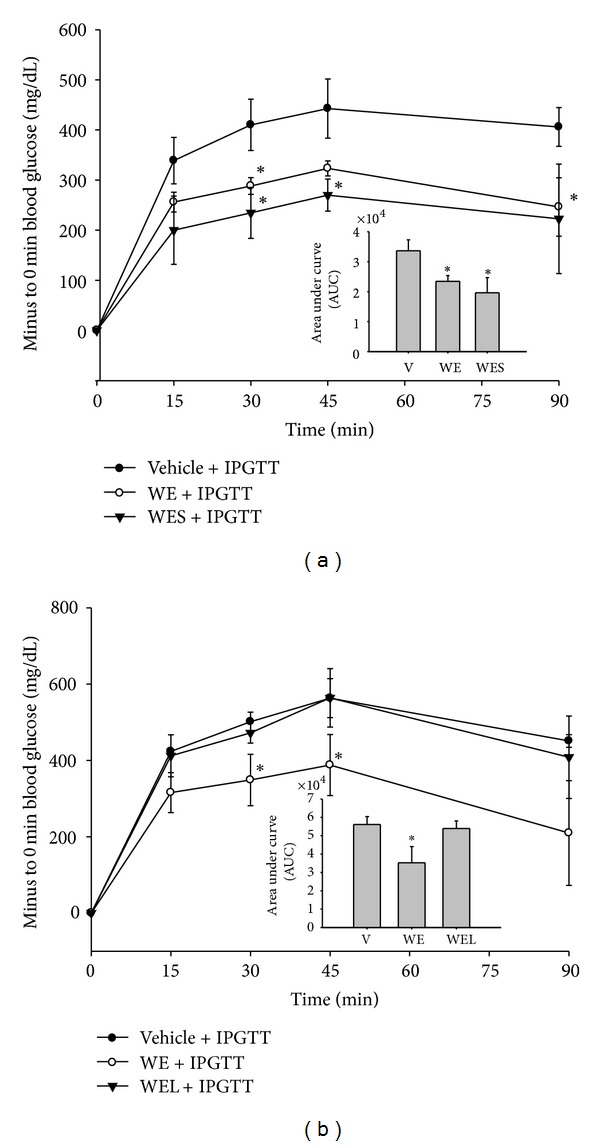
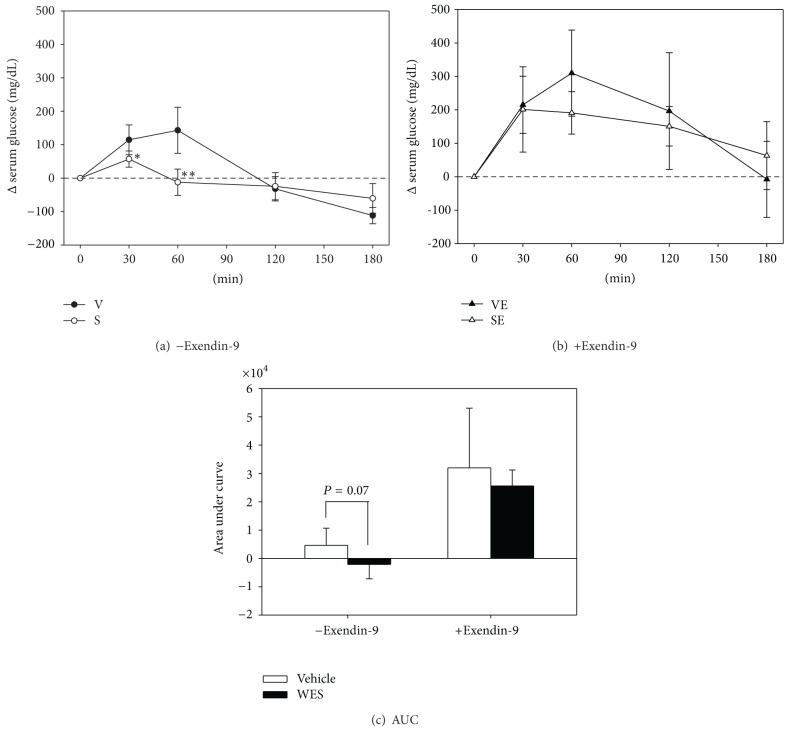
This study aimed to examine the role of GLP-1 in the hypoglycemic activity of wild bitter gourd (Momordica charantia L., BG). In vitro, the GLP-1 secretion in STC-1, a murine enteroendocrine cell line, was dose dependently stimulated by water extract (WE), its fractions (WEL, >3 kD and WES, <3 kD), and a bitter compounds-rich fraction of BG. These stimulations were partially inhibited by probenecid, a bitter taste receptor inhibitor, and by U-73122, a phospholipase C β 2 inhibitor. These results suggested that the stimulation might involve, at least in part, certain bitter taste receptors and/or PLC β 2-signaling pathway. Two cucurbitane triterpenoids isolated from BG, 19-nor-cucurbita-5(10),6,8,22-(E),24-pentaen-3 β -ol, and 5 β ,19-epoxycucurbita-6,24-diene-3 β ,23 ξ -diol (karavilagenine E,) showed relative high efficacy in the stimulation. In vivo, mice fed BG diet showed higher insulinogenic index in an oral glucose tolerance test. A single oral dose of WE or WES pretreatment significantly improved intraperitoneal glucose tolerance. A single oral dose of WES significantly decreased glucose and increased insulin and GLP-1 in serum after 30 min. This acute hypoglycemic effect of WES was abolished by pretreatment with exendin-9, a GLP-1 receptor antagonist. Our data provide evidence that BG stimulates GLP-1 secretion which contributes, at least in part, to the antidiabetic activity of BG through an incretin effect.
Figures
Similar articles
-
Berberine activates bitter taste responses of enteroendocrine STC-1 cells.Mol Cell Biochem. 2018 Oct;447(1-2):21-32. doi: 10.1007/s11010-018-3290-3. Epub 2018 Jan 23. Mol Cell Biochem. 2018. PMID: 29363059
-
Isolation and identification of cucurbitane-type triterpenoids with partial agonist/antagonist potential for estrogen receptors from Momordica charantia.J Agric Food Chem. 2011 May 11;59(9):4553-61. doi: 10.1021/jf200418g. Epub 2011 Apr 11. J Agric Food Chem. 2011. PMID: 21456596
-
Bitter gourd (Momordica charantia) improves insulin sensitivity by increasing skeletal muscle insulin-stimulated IRS-1 tyrosine phosphorylation in high-fat-fed rats.Br J Nutr. 2008 Apr;99(4):806-12. doi: 10.1017/S000711450783176X. Epub 2007 Oct 17. Br J Nutr. 2008. PMID: 17942003
-
Momordica charantia and type 2 diabetes: from in vitro to human studies.Curr Diabetes Rev. 2014 Jan;10(1):48-60. doi: 10.2174/1573399809666131126152044. Curr Diabetes Rev. 2014. PMID: 24295371 Review.
-
Bitter gourd (Momordica charantia) is a cornucopia of health: a review of its credited antidiabetic, anti-HIV, and antitumor properties.Curr Mol Med. 2011 Jul;11(5):417-36. doi: 10.2174/156652411795976583. Curr Mol Med. 2011. PMID: 21568930 Review.
Cited by
-
Role of Intestinal Bitter Sensing in Enteroendocrine Hormone Secretion and Metabolic Control.Front Endocrinol (Lausanne). 2018 Sep 27;9:576. doi: 10.3389/fendo.2018.00576. eCollection 2018. Front Endocrinol (Lausanne). 2018. PMID: 30319553 Free PMC article. Review.
-
Beyond Blood Sugar: Investigating the Cardiovascular Effects of Antidiabetic Drugs.Cureus. 2023 Oct 2;15(10):e46373. doi: 10.7759/cureus.46373. eCollection 2023 Oct. Cureus. 2023. PMID: 37920618 Free PMC article. Review.
-
An update on extra-oral bitter taste receptors.J Transl Med. 2021 Oct 21;19(1):440. doi: 10.1186/s12967-021-03067-y. J Transl Med. 2021. PMID: 34674725 Free PMC article. Review.
-
Multiple Factors Related to the Secretion of Glucagon-Like Peptide-1.Int J Endocrinol. 2015;2015:651757. doi: 10.1155/2015/651757. Epub 2015 Aug 20. Int J Endocrinol. 2015. PMID: 26366173 Free PMC article. Review.
-
Loganic Acid, an Iridoid Glycoside Extracted from Cornus mas L. Fruits, Reduces of Carbonyl/Oxidative Stress Biomarkers in Plasma and Restores Antioxidant Balance in Leukocytes of Rats with Streptozotocin-Induced Diabetes Mellitus.Life (Basel). 2020 Dec 15;10(12):349. doi: 10.3390/life10120349. Life (Basel). 2020. PMID: 33333730 Free PMC article.
References
-
- Baggio LL, Drucker DJ. Biology of incretins: GLP-1 and GIP. Gastroenterology. 2007;132(6):2131–2157. - PubMed
-
- Holst JJ. The physiology of glucagon-like peptide 1. Physiological Reviews. 2007;87(4):1409–1439. - PubMed
-
- Brubaker PL. Minireview: update on incretin biology: focus on glucagon-like peptide-1. Endocrinology. 2010;151(5):1984–1989. - PubMed
-
- Reimann F, Tolhurst G, Gribble FM. G-protein-coupled receptors in intestinal chemosensation. Cell Metabolism. 2012;15(4):421–431. - PubMed
LinkOut - more resources
Full Text Sources
Other Literature Sources
