Review
. 2013 Apr;93(2):803-959.
doi: 10.1152/physrev.00023.2012.

The divergence, actions, roles, and relatives of sodium-coupled bicarbonate transporters

Affiliations
Review

The divergence, actions, roles, and relatives of sodium-coupled bicarbonate transporters

Mark D Parker et al. Physiol Rev. 2013 Apr.

Abstract

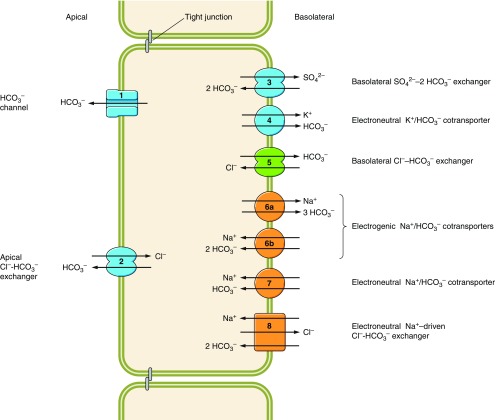
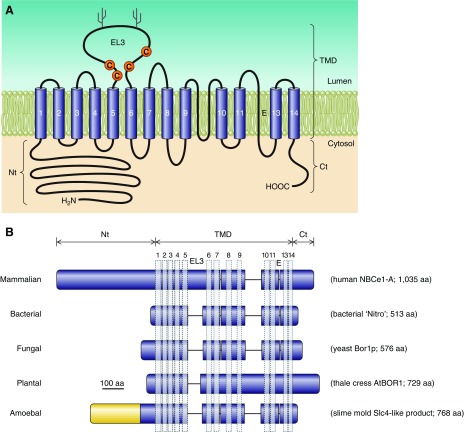
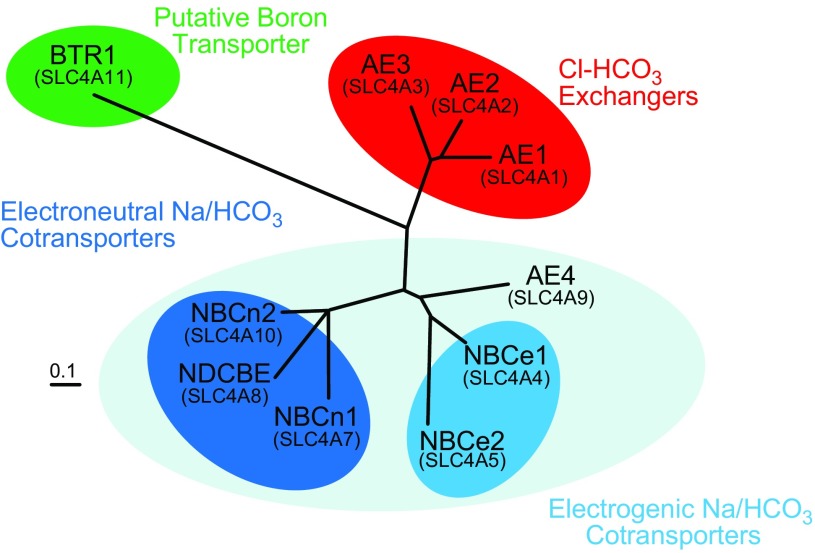
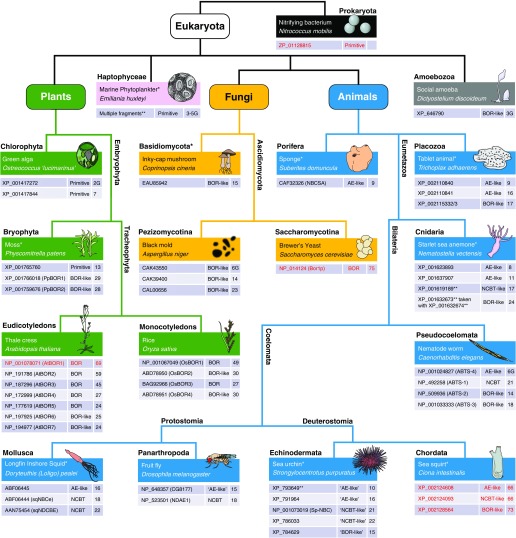
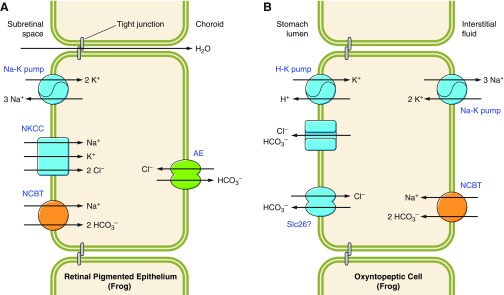
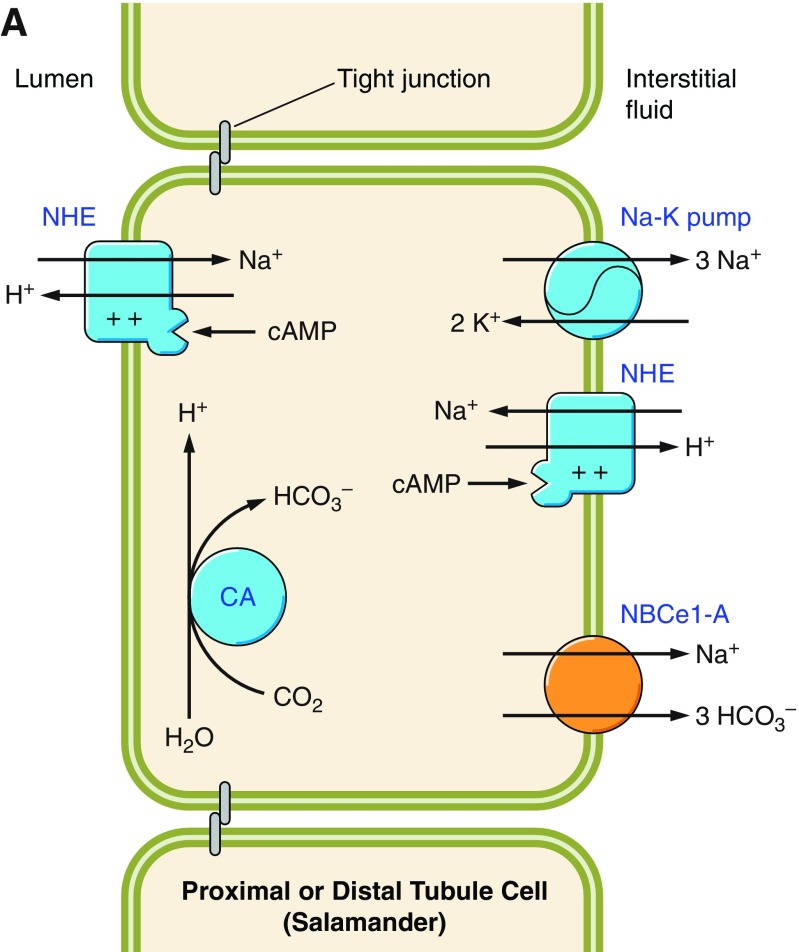
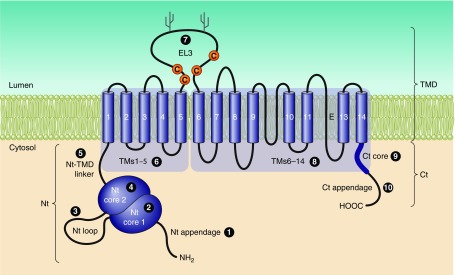
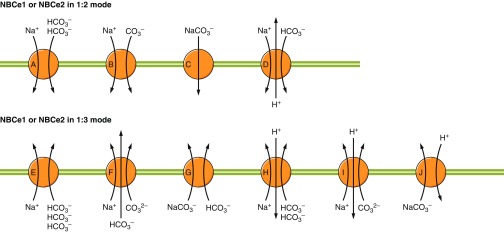
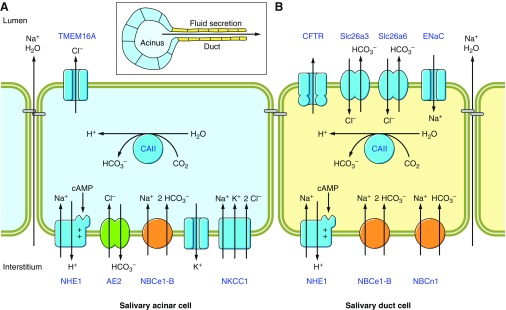
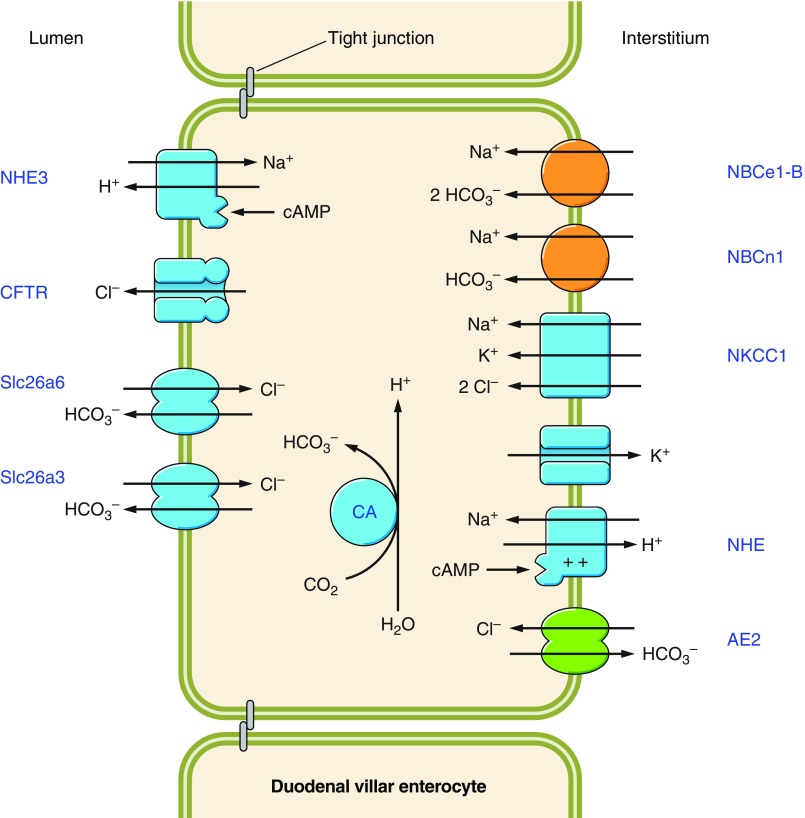
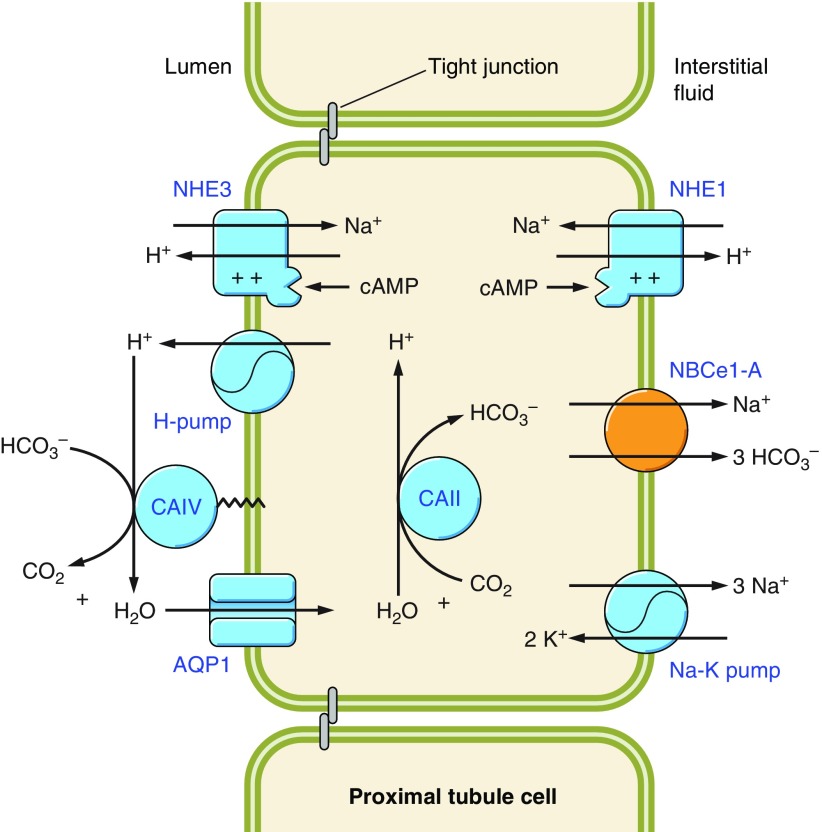
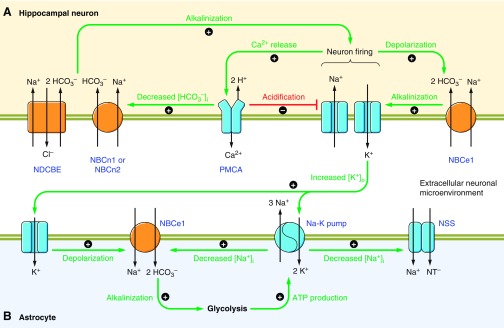
The mammalian Slc4 (Solute carrier 4) family of transporters is a functionally diverse group of 10 multi-spanning membrane proteins that includes three Cl-HCO3 exchangers (AE1-3), five Na(+)-coupled HCO3(-) transporters (NCBTs), and two other unusual members (AE4, BTR1). In this review, we mainly focus on the five mammalian NCBTs-NBCe1, NBCe2, NBCn1, NDCBE, and NBCn2. Each plays a specialized role in maintaining intracellular pH and, by contributing to the movement of HCO3(-) across epithelia, in maintaining whole-body pH and otherwise contributing to epithelial transport. Disruptions involving NCBT genes are linked to blindness, deafness, proximal renal tubular acidosis, mental retardation, and epilepsy. We also review AE1-3, AE4, and BTR1, addressing their relevance to the study of NCBTs. This review draws together recent advances in our understanding of the phylogenetic origins and physiological relevance of NCBTs and their progenitors. Underlying these advances is progress in such diverse disciplines as physiology, molecular biology, genetics, immunocytochemistry, proteomics, and structural biology. This review highlights the key similarities and differences between individual NCBTs and the genes that encode them and also clarifies the sometimes confusing NCBT nomenclature.


Figures

Figure 1.
Figure 1.
Functional classifications of bicarbonate transporters. Diagram of a generic epithelial cell showing the typical subcellular distribution of the 8 classes of HCO3 transporters. Anion channels (1) and anion exchangers of the Slc26 family (2) perform HCO3 secretion across the apical membrane. Basolateral Slc26a1 functions as SO42--2HCO3 exchanger (3). An as yet unknown transporter (4) is presumed to be responsible for a basolateral K/HCO3 cotransport activity in the inner medulla. Members of the Slc4 family (5–8) are usually located in the basolateral membranes of polarized epithelia. Cl-HCO3 exchangers (5) and electrogenic Na/HCO3 cotransporters with a calculated 1:3 stoichiometry (6a) act as acid-loaders, supporting HCO3 absorption into the blood. Electrogenic Na/HCO3 cotransporters with a 1:2 stoichiometry (6b), electroneutral Na/HCO3 cotransporters (7), and Na+-driven Cl-HCO3 exchangers (8) act as acid-extruders, supporting HCO3 secretion across the apical membrane by transporter classes 1–2.
Figure 2.
Figure 2.
Presumed topology of NCBTs and Slc4-like transporters. Presumed topology of the electrogenic Na/HCO3 cotransporter NBCe1 (A), representing a probable common structure for all five mammalian NCBTs and most nonmammalian NCBTs. The model shows the extended cytosolic amino- and carboxy-terminal domains (Nt and Ct) linked via a transmembrane domain (TMD) that includes 14 transmembrane spans (TMs), one of which is thought to be an extended region (E) rather than an α-helix. In mammalian NCBTs, the third extracellular loop (EL3) between TMs 5 and 6 usually includes multiple cysteine residues (C) and multiple putative glycosylation sites (Y). A sequence alignment displaying these features for human NCBTs is provided in Appendix I. Pictorial depiction of NBCe1 domain sequences aligned against homologous regions of nonvertebrate Slc4-like transporters (B). Horizontal purple bars represent protein sequence laid out from Nt to Ct. Gaps in sequence alignment are depicted as horizontal lines. Vertical bars represent position of α-helical TMs. Note the shorter Nt and EL3 in nonvertebrates. The amoebal Slc4-like transporter includes an extended Nt (yellow region), but it shares no significant sequence identity with the extended Nt of vertebrate Slc4s. The sequence of nonmammalian Slc4-like protein is provided in Appendix II.
Figure 3.
Figure 3.
Relatedness among human SLC4s. The unrooted phylogram displays the relatedness at the level of protein sequence among the transmembrane domains of the 10 human SLC4 proteins. Note how transporter function correlates with protein sequence similarity. The phylogram was generated using ClustalW (183) and TreeView (704). A sequence alignment of the 10 human SLC4s is provided in Appendix I, and the protein sequence identity among the transmembrane domains of human SLC4s is provided in TABLE 2.
Figure 4.
Figure 4.
Diversity of nonvertebrate Slc4-like transporters. The cladogram represents the evolutionary relationships of a variety of organisms, based on the taxonomy defined by The Tree of Life Web Project (http://tolweb.org) and the taxonomy database at NCBI (839). Each organism is represented by a boxed table that includes, in the top row, the common and scientific name of the organism. If the full genome sequence of the organism has not been published, the organism's name is noted with an asterisk. The remaining rows of each table provide information about the Slc4-like proteins that are encoded by the genome of each organism. These rows are divided into three columns: Column 1 lists the GenBank protein accession number and, where appropriate, common name for each Slc4-like protein. Partial sequences are marked with a double asterisk. Column 2 lists the function of each transporter (AE, NCBT, or BOR) or, if unknown, the assignment of each protein to one of the four groups (AE-like, NCBT-like BOR-like, or Primitive) defined in text that indicates their relatedness to their reference sequences for each kingdom (red text). Column 3 shows a numerical “divergence score” (DS, see text) denoting the extent of similarity to the reference protein. Proteins that do not bear a strong similarity to any one of the reference proteins are marked with a “G” for “generic.” A hyperlink to the protein sequence of each transporter is provided in Appendix II.
Figure 5.
Figure 5.
Relatedness among plantal Slc4-like proteins. The unrooted phylogram displays the relatedness, at the level of protein sequence, among the transmembrane domains of the 16 plantal Slc4-like proteins shown in FIGURE 4. Proteins are identified by the name of parent organism and the common name or the divergence score (DS), of each transporter, as listed in FIGURE 4. Note how the BOR and/or BOR-like transporters fall into two groups. It is unknown if members of Group I versus Group II are functionally distinct, like members of animal Slc4 groups in FIGURES 3 AND 6. The phylogram was generated using ClustalW (183) and TreeView (704).
Figure 6.
Figure 6.
Relatedness among invertebrate Slc4-like proteins. The unrooted phylogram displays the relatedness, at the level of protein sequence, among the transmembrane domains of the 23 invertebrate Slc4-like proteins shown in FIGURE 4. Proteins are identified by the name of parent organism and the common name or the divergence score (DS), of each transporter, as listed in FIGURE 4. Note how the transporters fall into four groups: 1) including AEs and AE-like transporters (red), 2) including NCBTs and NCBT-like transporters (blue), 3) including BORs and BOR-like transporters (green), and 4) a “Generic” outlier (black) that does not fall into any of the three previous groups. The phylogram was generated using ClustalW (183) and TreeView (704).
Figure 7.
Figure 7.
Analysis of common and unique exon boundaries among human SLC4 and Ciona Slc4-like genes. The gray horizontal protein bar represents a region of a typical Slc4 protein, between putative TMs 7–14. White numbered boxes within the protein bar mark the positions of α-helical TMs, similar to the representations in FIGURE 2B. Aligned below the protein bar are the corresponding regions of mRNAs that encode the TMs 7–14 region for all 10 human SLC4 genes and all 3 Ciona Slc4-like genes. Each mRNA bar is divided into colored boxes that represent the individual exons that comprise each sequence: thus a change in color on the horizontal axis marks the position of an exon boundary. Exons that appear to have been derived by splitting of a larger ancestral exon are colored green in the human lineage and purple in the Ciona lineage. Common exon boundaries that are discussed in the text are labeled A–L. The position of the exon boundaries for each gene are provided by NCBI Evidence Viewer (839). The sequence alignment from which this analysis is derived is presented in Appendix III.
Figure 8.
Figure 8.
Divergence of NBCe1, NBCe2, and “AE4” in vertebrates. The unrooted phylogram displays the relatedness, at the level of protein sequence, among the transmembrane domains of NBCe1, NBCe2, and “AE4” for zebrafish (Danio rerio), frogs (Xenopus tropicalis), fowl (Gallus gallus), mice (Mus musculus), and humans. The phylogram was generated using ClustalW (183) and TreeView (704). The GenBank protein accession numbers for each transporter are provided in Appendix IV.
Figure 9.
Figure 9.
Roles of Slc4-like boron transporters in boron uptake and boron tolerance in the roots of plants. Radial cross sections through the roots of rice (A) and thale cress (B). Boron can enter the roots from the soil via the intercellular apoplast (blue shaded area), but is blocked from the root vasculature (in the stele) by casparian strips (CS). NIP boron channels, BOR1, and BOR2 transporters in root cells, provide a transcellular pathway through the epidermis (EP), exodermis (EX), cortex, and endodermis (EN) directing boron towards the stele and past the CS allowing boron to access the xylem. In thale cress, AtBOR4 directs excess boron into the soil.
Figure 10.
Figure 10.
Role of the Na+-driven anion exchanger ABTS-1 in the neurons of nematode worms. In wild-type C. elegans worms, ABTS-1 and the K/Cl cotransporter KCC-2 lower intracellular [Cl] rendering GABAergic, glutamatergic, and 5-HT-ergic signals inhibitory to neurotransmitter release (A). In abts-1—null worms, the reduced ability to lower intracellular [Cl] reduces the potency of inhibitory signals (B).
Figure 11.
Figure 11.
Role of an NCBT in the rectal gland of cartilaginous fish. The rectal gland duct joins the intestine at a point upstream of the rectum (see cartoon dogfish). In rectal gland epithelia, the Na-K pump maintains a low intracellular [Na+] driving basolateral Na/K/Cl cotransporter (NKCC) activity that supplies Cl for secretion across the apical membrane by CFTR. Anion secretion draws Na+ and H2O through a paracellular pathway, resulting in the secretion of a NaCl-rich solution from the interstitial fluid/blood. CO2 accumulation is dissipated by intracellular carbonic anhydrase (CA). Respiratory acidosis is prevented by NHE and NCBT action. NHE and NCBT could also support HCO3 secretion via the unidentified apical anion exchanger, that is likely a member of the Slc26 family (84). KCNQ1 is a voltage-sensitive K+ channel (1018), also known as Kv7.1.
Figure 12.
Figure 12.
Role of NCBTs in the gills and intestines of bony fishes. In the gill epithelia of freshwater fish such as trout (A), NBCe1 contributes to Na+ and HCO3 absorption from the water. In the gut epithelia of marine fishes such as pufferfish (B), NBCe1 contributes to HCO3 secretion into the gut lumen. ENaC is an epithelial Na+ channel. The identities of the non-Slc4 transporters involved in these pathways have not been determined for all species in which these systems have been identified.
Figure 13.
Figure 13.
Role of NCBTs in the retinas and stomachs of amphibia. In the retinal pigment epithelia of frogs (A), an electrogenic NCBT exhibits an unusual apical distribution and contributes towards fluid absorption from the subretinal space, promoting retinal attachment. Although undemonstrated in frogs, study of mammalian RPE indicates that the apical NCBT could be either NBCe1 or NBCe2 and the basolateral AE could be AE2 (11). In gastric epithelia of frogs (B), an electrogenic NCBT contributes towards HCO3 secretion onto the cell surface that protects cells from acid attack. The transporter responsible for moving HCO3 across the luminal membrane of these cells has not been identified, although both Slc26a6 and Slc26a9 have been suggested to perform this function in mammalian gastric mucosa (744, 1055).
Figure 14.
Figure 14.
Role of NCBTs in the renal tubules of amphibia. In proximal and distal renal tubule epithelia of amphibia, NBCe1 contributes towards a H+ secretion/HCO3 reabsorption pathway, which maintains whole body pH within a narrow physiological range.
Figure 15.
Figure 15.
Domains and subdomains of NCBTs. Representation of a typical NCBT showing the three domains (Nt, TMD, and Ct) together with the 10 numbered subdomains that comprise them. The common and unique features among NCBTs in each subdomain are discussed in the text. An annotated alignment of human NCBTs showing the division of subdomains is provided in Appendix I.
Figure 16.
Figure 16.
Molecular action of electrogenic NCBTs. Possible molecular mechanisms by which an electrogenic NCBT could operate with an apparent Na+:HCO3 stoichiometry of 1:2 (A–D in top panel) and 1:3 (E–J in bottom panel). Note that we have not considered any models that are based on CO32−-HCO3 exchange (considered for NBCn1 in FIGURE 30), or models of HCO3-stimulated electrogenic Na-2H exchange. We have also omitted mechanisms of 1:3 stoichiometry that could result from modification of model D.
Figure 17.
Figure 17.
SLC4A4 gene structure and NBCe1 transcript variants. Scale diagrams showing the human SLC4A4 gene locus together with the position of neighboring genes (A), the position of promoters (P1 and P2), and the position of exons within SLC4A4 (B). Transcript variants are represented, not to scale, as numbered boxes joined by a horizontal line (C). Each numbered box represents the inclusion of that exon in the mature transcript. “//” denotes that all five transcripts include exons 7–23. Exons that include the initiator ATG codon (“M”) and termination codon (“*”) are marked for each transcript. Sequences that are derived from part of a larger exon sequence are labeled with an “a” (e.g., exon 4a is a subdivision of exon 4). Colored exons, or parts of exons, correspond to the protein regions that each encodes, which are identically colored in FIGURE 18. Uncolored exons, or parts of exons, denote untranslated 5′ and 3′ sequence. Exons that are connected with a dashed line are predicted, but not demonstrated, to be included in the mRNA.
Figure 18.
Figure 18.
NBCe1 protein variants. Scale diagram of protein variants that are encoded by the transcripts represented in FIGURE 17C. Horizontal bars represent protein sequence laid out from Nt to Ct. Vertical bars represent position of α-helical TMs. Protein cassettes are labeled with a number denoting their size in amino acids and colored to denote their genetic origin as shown in FIGURE 17C. NBCe1-A and NBCe1-D include an autostimulatory domain (ASD), whereas all other variants include an autoinhibitory domain (AID). NBCe1-C terminates with a PDZ-domain binding sequence. A color-matched protein sequence alignment of the variants is provided in Appendix V.
Figure 19.
Figure 19.
Role of NBCe1 in the cornea. The corneal endothelium reabsorbs fluid from the collagen matrix that constitutes the stroma, preventing corneal edema (see cartoon of eye). NBCe1-B in the basolateral membrane supports transepithelial anion secretion. Note the similarities between this pathway and the mechanism of NaCl secretion in dogfish salt glands (FIGURE 11).
Figure 20.
Figure 20.
Role of NBCe1 in the enamel organ. Apatite formation in the enamel compartment generates H+ that are neutralized by HCO3 secreted from mature ameloblasts. NBCe1 mediates HCO3 influx in papillary cells, and the HCO3 is transferred to ameloblasts via connecting gap junctions. Transported HCO3 and HCO3 generated within ameloblasts by CA is secreting into the enamel compartment via lateral AE2 and perhaps apical pendrin (Slc26a4). The presence of pendrin in the apical membrane of ameloblasts is controversial (124, 125, 297). The extracellular face of AE2 is exposed to the enamel compartment by a rearrangement of tight junctions (456).
Figure 21.
Figure 21.
Role of NCBTs in exocrine glands. The inset in A displays a generic acinus (acinar epithelia, blue) and duct (duct epithelia, yellow) for an exocrine gland such as the salivary gland or pancreas. NBCe1 activity regulates intracellular pH and could support transepithelial fluid and ion secretion by salivary gland acinar cells (A). NBCe1 and NBCn1 support transepithelial HCO3 secretion by salivary gland duct cells (B), contributing to formation of a HCO3-rich saliva. The presence of AE2 in the duct cells of salivary glands may be species specific [present in humans (998) but not in rats (818)]. Similarly, the presence of NKCC1 in duct cells is not reported in all species (e.g., absent from mice in Ref. 279). The Na pump has been omitted from both cell types for clarity. A similar mechanism for fluid secretion operates in pancreatic acini and ducts.
Figure 22.
Figure 22.
Role of NCBTs in intestine. Shown is a duodenal villus enterocyte. The mechanism of transepithelial fluid and HCO3 secretion is very similar to that shown in FIGURE 21 for salivary glands. The Na pump is omitted for clarity.
Figure 23.
Figure 23.
Role of NBCe1 in the proximal tubule. H+ secreted by proximal tubule (PT) epithelia into the PT lumen can either be titrated by buffers such as phosphate or NH3, in which case they are excreted in the urine or, catalyzed by extracellular CA, they can be titrated by HCO3. CO2 that enters PT epithelia from the lumen, and CO2 that is generated by PT metabolism, is hydrated by CAII into H+ and HCO3. Reabsorption of HCO3 via NBCe1 drives H+ secretion and supplies the blood with HCO3, regulating whole body pH.
Figure 24.
Figure 24.
Role of NCBTs in excitable cells. Neuronal firing causes a depolarization induced alkalinization (DIA), via NBCe1, that anticipates and counters the dampening of neuronal excitability by Ca2+ pump-mediated H+ influx. The three electroneutral NCBTs also play critical roles in restoring neuronal pHi after a firing event (A). K+ released by firing neurons is absorbed by astrocytes causing a DIA, via NBCe1, that stimulates glycolytic ATP production (B), anticipating the increased energetic demand of the astrocyte for secondary active neurotransmitter (NT) uptake via neurotransmitter/sodium symporters (NSS).
Figure 25.
Figure 25.
Location of disease-associated mutations in NBCe1-A. Representation of human NBCe1-A topology from FIGURE 2A. Numbered circles show the positions of SLC4A4 mutations (numbers 1–12 match the numbered mutant descriptions in TABLE 6) that cause proximal renal tubular acidosis. Nonsense mutations that result in premature translational termination are colored red, and missense mutations are colored green.
Figure 26.
Figure 26.
SLC4A5 gene structure and NBCe2 transcript variants. Scale diagrams showing the human SLC4A5 gene locus together with the position of neighboring genes (A), the position of promoters (P1, P2, and P3), and the position of exons within SLC4A5 (B). Transcript variants are represented, not to scale, as numbered boxes joined by a horizontal line (C). Each numbered box represents the inclusion of that exon in the mature transcript. “//” denotes that both transcripts include exons 6–26. Exons that include the initiator ATG codon (“M”) and termination codon (“*”) are marked for each transcript. Colored exons, or parts of exons, correspond to the protein regions that each encodes, which are identically colored in FIGURE 27. Uncolored exons, or parts of exons, denote untranslated 5′ and 3′ sequence. Exons that are connected with a dashed line are predicted, but not demonstrated, to be included in the mRNA. Not shown are NBC4b and NBC4d that are unlikely to encode stable/functional transporters, or NBC4e and NBC4f that are cloning artifacts (see text).
Figure 27.
Figure 27.
NBCe2 protein variants. Scale diagram of protein variants that are encoded by the transcripts represented in FIGURE 26C. Horizontal bars represent protein sequence laid out from Nt to Ct. Vertical bars represent position of α-helical TMs. Protein cassettes are labeled with a number denoting their size in amino acids and colored to denote their genetic origin as shown in FIGURE 26C. A color-matched protein sequence alignment of the variants is provided in Appendix V.
Figure 28.
Figure 28.
Role of NCBTs in the choroid plexus. The secretion of cerebrospinal fluid by the choroid plexus (CP) and intracellular pH regulation in CP epithelia is achieved by a combination of NCBTs. NBCe2 is the major NCBT that is responsible for HCO3 secretion across the apical membrane. NBCn1, NDCBE, and NBCn2 have all been detected in the basolateral membrane of CP epithelia, mediating HCO3 influx. NBCn1 has also been detected in the apical membrane of the CP in some strains of mice. Note that NDCBE is not present in the CP of adults. Reported, but not shown, is the presence of NBCe1 in the basolateral membrane.
Figure 29.
Figure 29.
Role of NBCe2 in hepatocytes. NBCe2 mediates HCO3 influx across the basolateral membrane of hepatocytes. This activity regulates intracellular pH and supports AE2-mediated HCO3 secretion into the bile ducts.
Figure 30.
Figure 30.
Molecular action of NBCn1. Possible molecular mechanisms by which an electroneutral NCBT could operate with an apparent Na+:HCO3 stoichiometry of 1:1. NBCn1 also exhibits a HCO3-independent conductance that is represented by the red dashed arrow. Note that we have not included any models that are based on CO3/H cotransport, such as those represented for NBCe1 in FIGURE 16.
Figure 31.
Figure 31.
SLC4A7 gene structure and NBCn1 transcript variants. Scale diagrams showing the human SLC4A7 gene locus together with the position of neighboring genes (A), the position of promoters (P1 and P2), and the position of exons within SLC4A7 (B). Transcript variants NBCn1-A to NBCn1-E, which among themselves display the diversity of NBCn1-A to NBCn1-E, are represented, not to scale, as numbered boxes joined by a horizontal line (C). Each numbered box represents the inclusion of that exon in the mature transcript. “//” denotes that all transcripts include exons 9–25. Exons that include the initiator ATG codon (“M”) and termination codon (“*”) are marked for each transcript. Sequence that is derived from part of a larger exon sequence are labeled with an “a” (e.g., exon 7a is a subdivision of exon 7). Colored exons, or parts of exons, correspond to the protein regions that each encodes, which are identically colored in FIGURE 32. Uncolored exons, or parts of exons, denote untranslated 5′ and 3′ sequence. Exons that are connected with a dashed line are predicted, but not demonstrated, to be included in the mRNA.
Figure 32.
Figure 32.
NBCn1 protein variants. Scale diagram of protein variants that are encoded by the transcripts represented in FIGURE 31C. Horizontal bars represent protein sequence laid out from Nt to Ct. Vertical bars represent position of α-helical TMs. Protein cassettes are labeled with a number denoting their size in amino acids and colored to denote their genetic origin as shown in FIGURE 31C. All NBCn1 variants are presumed to include an autoinhibitory domain and IRBIT-binding determinants in their Nt. All NBCn1 variants terminate with a PDZ binding motif. A color-matched protein sequence alignment of the variants is provided in Appendix V.
Figure 33.
Figure 33.
Role of NBCn1 in osteoclasts. Intracellular carbonic anhydrase generates H+ that are secreted by the H-pump into the resorption lacuna to dissolve bone minerals. H+ secretion is supported by AE2 in the contra-lacunar membrane. Liberated HCO3 is absorbed across the lacunar membrane by NBCn1 and across the contra-lacunar membrane by AE2. Liberated Ca2+ is absorbed by the combined actions of NCX and TRPV5 channels (580, 994).
Figure 34.
Figure 34.
Role of NBCn1 in the renal medulla. To avoid absorption of ammonia into the blood, NH4 traveling along the nephron bypasses the renal cortex by passing through the medullary interstitium to the collecting tubules. NH4+ enters thick ascending limb epithelia via K+ channels (ROMK) and the Na/K/Cl cotransporter. NH3 is absorbed across the basolateral membrane into the medullary interstitium, perhaps via a channel. Residual H+ is extruded by NHE and titrated by HCO3 that enters the cell via NBCn1. The basolateral Na-pump has been omitted for clarity.
Figure 35.
Figure 35.
Molecular action of NDCBE. Possible molecular mechanisms by which NDCBE could operate in an electroneutral mode to exchange Na+ and HCO3 equivalents for Cl. Note that we have not considered any models that are based on CO32−/H+ cotransport. In the original characterization of NDCBE action, Cl flux was estimated to be sixfold greater than Na+ flux.
Figure 36.
Figure 36.
SLC4A8 gene structure and NDCBE transcript variants. Scale diagrams showing the human SLC4A8 gene locus together with the position of neighboring genes (A), the position of promoters (P1 and P2), and the position of exons within SLC4A8 (B). Transcript variants are represented, not to scale, as numbered boxes joined by a horizontal line (C). Each numbered box represents the inclusion of that exon in the mature transcript. “//” denotes that all five transcripts include exons 7–24. Exons that include the initiator ATG codon (“M”) and termination codon (“*”) are marked for each transcript. Sequences that are derived from part of a larger exon sequence are labeled with an “a” (e.g., exon 25a is a subdivision of exon 25). Colored exons, or parts of exons, correspond to the protein regions that each encodes, which are identically colored in FIGURE 37. Uncolored exons, or parts of exons, denote untranslated 5′ and 3′ sequence. Exons that are connected with a dashed line are predicted, but not demonstrated, to be included in the mRNA.
Figure 37.
Figure 37.
NDCBE protein variants. Scale diagram of protein variants that are encoded by the transcripts represented in FIGURE 36C. Horizontal bars represent protein sequence laid out from Nt to Ct. Vertical bars represent position of α-helical TMs. Protein cassettes are labeled with a number denoting their size in amino acids and colored to denote their genetic origin as shown in FIGURE 36C. A color-matched protein sequence alignment of the variants is provided in Appendix V.
Figure 38.
Figure 38.
Molecular action of NBCn2. Possible molecular mechanisms by which NBCn2 could operate in an electroneutral mode to cotransport Na+ and HCO3 with accompanying futile cycles of HCO3-dependent Cl-Cl self-exchange (A). In the absence of extracellular Cl, NBCn2 performs Na+-driven Cl-HCO3 exchange (B). The Slc4a10 gene product from mice and rats is reported to act like NDCBE (FIGURE 35) even in the presence of extracellular Cl. Note that we have not considered any models that are based on CO32− or H+ cotransport.
Figure 39.
Figure 39.
SLC4A10 gene structure and NBCn2 transcript variants. Scale diagrams showing the human SLC4A10 gene locus together with the position of neighboring genes (A), the position of the promoters (P), and the position of exons within SLC4A10 (B). Transcript variants are represented, not to scale, as numbered boxes joined by a horizontal line (C). Each numbered box represents the inclusion of that exon in the mature transcript. “//” denotes that all four transcripts include exons 1–7 and 9–23. Exons that include the initiator ATG codon (“M”) and termination codon (“*”) are marked for each transcript. Colored exons, or parts of exons, correspond to the protein regions that each encodes, which are identically colored in FIGURE 40. Uncolored exons, or parts of exons, denote untranslated 5′ and 3′ sequence. Exons that are connected with a dashed line are predicted, but not demonstrated, to be included in the mRNA. Note that rb3NCBE has only been isolated from rat cDNA.
Figure 40.
Figure 40.
NBCn2 protein variants. Scale diagram of protein variants that are encoded by the transcripts represented in FIGURE 39C. Horizontal bars represent protein sequence laid out from Nt to Ct. Vertical bars represent position of α-helical TMs. Protein cassettes are labeled with a number denoting their size in amino acids and colored to denote their genetic origin as shown in FIGURE 39C. All NBCn2 variants are presumed to include an autoinhibitory domain and IRBIT-binding determinants in their Nt. A color-matched protein sequence alignment of the variants is provided in Appendix V.

References

    1. Normal Table of Xenopus laevis (Daudin) (2nd ed.). New York: Garland, 1994.
    1. Abdulnour-Nakhoul S, Khuri RN, Nakhoul NL. Effect of norepinephrine on intracellular pH in kidney proximal tubule: role of Na+-(HCO3)n cotransport. Am J Physiol Renal Physiol 275: F33–F45, 1998. - PubMed
    1. Abdulnour-Nakhoul S, Nakhoul HN, Kalliny MI, Gyftopoulos A, Rabon E, Doetjes R, Brown K, Nakhoul NL. Ion transport mechanisms linked to bicarbonate secretion in the esophageal submucosal glands. Am J Physiol Regul Integr Comp Physiol 301: R83–R96, 2011. - PMC - PubMed
    1. Abdulnour-Nakhoul S, Nakhoul NL, Wheeler SA, Wang P, Swenson ER, Orlando RC. HCO3 secretion in the esophageal submucosal glands. Am J Physiol Gastrointest Liver Physiol 288: G736–G744, 2005. - PubMed
    1. Abuladze N, Azimov R, Newman D, Liu W, Tatishchev S, Pushkin A, Kurtz I. Critical amino acid residues involved in the electrogenic sodium bicarbonate cotransporter kNBC1-mediated transport. J Physiol 565: 717–730, 2005. - PMC - PubMed

Publication types

MeSH terms

Substances