

Increased photosystem II stability promotes H2 production in sulfur-deprived Chlamydomonas reinhardtii
- PMID: 23589846
- PMCID: PMC3645517
- DOI: 10.1073/pnas.1220645110
Increased photosystem II stability promotes H2 production in sulfur-deprived Chlamydomonas reinhardtii
Abstract
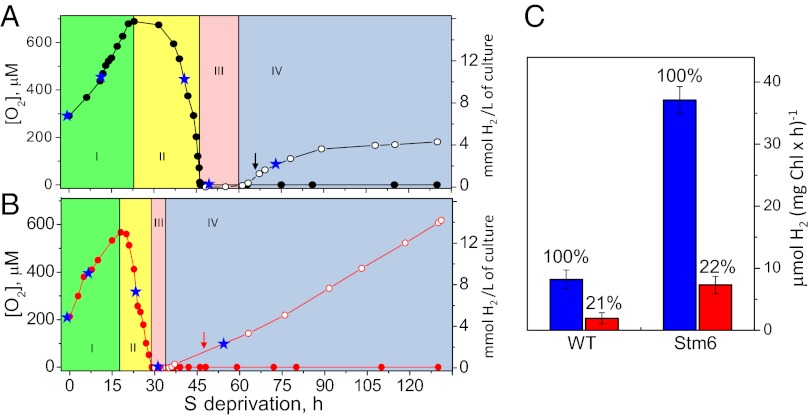
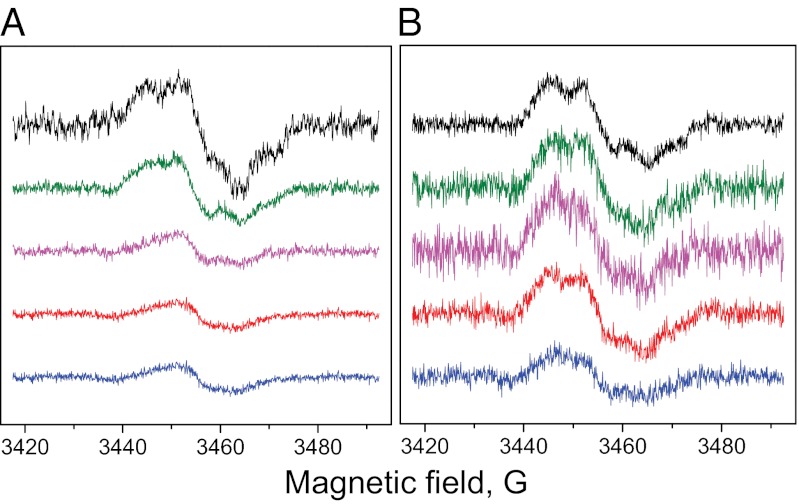
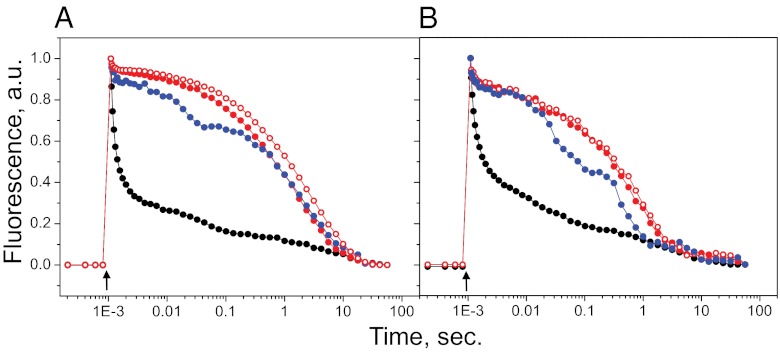
Photobiological H2 production is an attractive option for renewable solar fuels. Sulfur-deprived cells of Chlamydomonas reinhardtii have been shown to produce hydrogen with the highest efficiency among photobiological systems. We have investigated the photosynthetic reactions during sulfur deprivation and H2 production in the wild-type and state transition mutant 6 (Stm6) mutant of Chlamydomonas reinhardtii. The incubation period (130 h) was dissected into different phases, and changes in the amount and functional status of photosystem II (PSII) were investigated in vivo by electron paramagnetic resonance spectroscopy and variable fluorescence measurements. In the wild type it was found that the amount of PSII is decreased to 25% of the original level; the electron transport from PSII was completely blocked during the anaerobic phase preceding H2 formation. This block was released during the H2 production phase, indicating that the hydrogenase withdraws electrons from the plastoquinone pool. This partly removes the block in PSII electron transport, thereby permitting electron flow from water oxidation to hydrogenase. In the Stm6 mutant, which has higher respiration and H2 evolution than the wild type, PSII was analogously but much less affected. The addition of the PSII inhibitor 3-(3,4-dichlorophenyl)-1,1-dimethylurea revealed that ∼80% of the H2 production was inhibited in both strains. We conclude that (i) at least in the earlier stages, most of the electrons delivered to the hydrogenase originate from water oxidation by PSII, (ii) a faster onset of anaerobiosis preserves PSII from irreversible photoinhibition, and (iii) mutants with enhanced respiratory activity should be considered for better photobiological H2 production.
Conflict of interest statement
The authors declare no conflict of interest.
Figures
References
-
- Hankamer B, et al. Photosynthetic biomass and H2 production by green algae: From bioengineering to bioreactor scale-up. Physiol Plant. 2007;131(1):10–21. - PubMed
-
- Mathews J, Wang G. Metabolic pathway engineering for enhanced biohydrogen production. Int J Hydrogen Energy. 2009;34(17):7404–7416.
-
- Magnuson A, et al. Biomimetic and microbial approaches to solar fuel generation. Acc Chem Res. 2009;42(12):1899–1909. - PubMed
-
- Ghirardi ML, Dubini A, Yu J, Maness P-C. Photobiological hydrogen-producing systems. Chem Soc Rev. 2009;38(1):52–61. - PubMed
-
- Hemschemeier A, Happe T. Alternative photosynthetic electron transport pathways during anaerobiosis in the green alga Chlamydomonas reinhardtii. Biochim Biophys Acta. 2011;1807(8):919–926. - PubMed
Publication types
MeSH terms
Substances
LinkOut - more resources
Full Text Sources
Other Literature Sources
