. 2013 Apr 30;110(18):7282-7.
doi: 10.1073/pnas.1220700110. Epub 2013 Apr 15.

Phosphoregulation promotes release of kinetochores from dynamic microtubules via multiple mechanisms

Affiliations

Phosphoregulation promotes release of kinetochores from dynamic microtubules via multiple mechanisms

Krishna K Sarangapani et al. Proc Natl Acad Sci U S A. .

Abstract

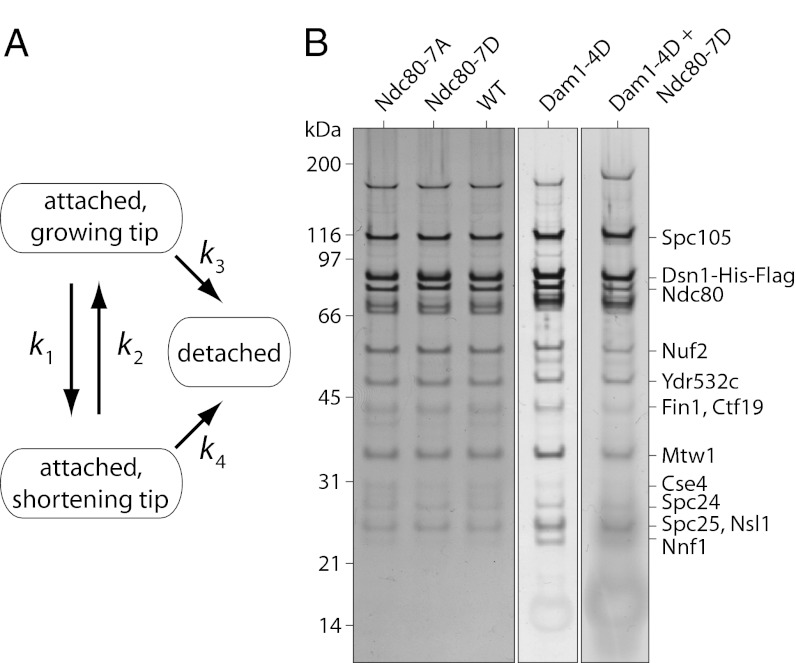
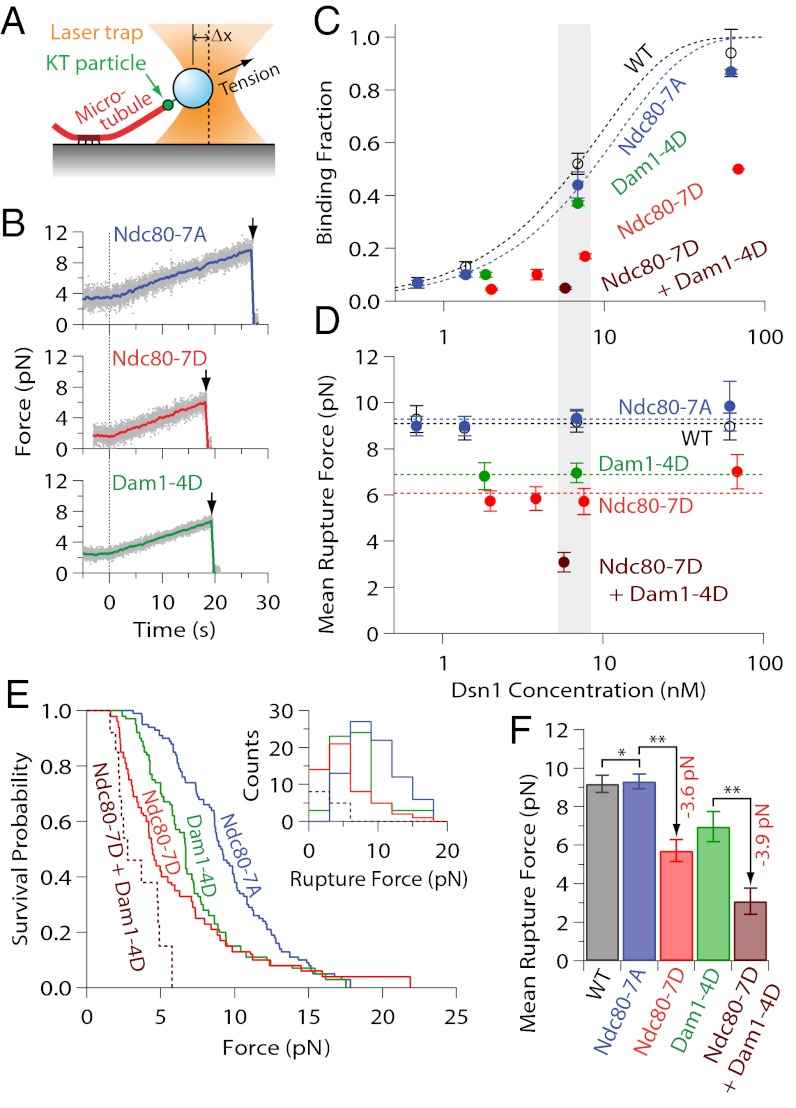
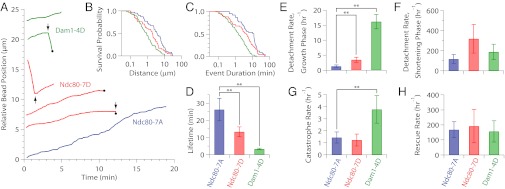
During mitosis, multiprotein complexes called kinetochores orchestrate chromosome segregation by forming load-bearing attachments to dynamic microtubule tips, and by participating in phosphoregulatory error correction. The conserved kinase Aurora B phosphorylates the major microtubule-binding kinetochore subcomplexes, Ndc80 and (in yeast) Dam1, to promote release of erroneous attachments, giving another chance for proper attachments to form. It is unknown whether Aurora B phosphorylation promotes release directly, by increasing the rate of kinetochore detachment, or indirectly, by destabilizing the microtubule tip. Moreover, the relative importance of phosphorylation of Ndc80 vs. Dam1 in the context of whole kinetochores is unclear. To address these uncertainties, we isolated native yeast kinetochore particles carrying phosphomimetic mutations on Ndc80 and Dam1, and applied advanced laser-trapping techniques to measure the strength and stability of their attachments to individual dynamic microtubule tips. Rupture forces were reduced by phosphomimetic mutations on both subcomplexes, in an additive manner, indicating that both subcomplexes make independent contributions to attachment strength. Phosphomimetics on either subcomplex reduced attachment lifetimes under constant force, primarily by accelerating detachment during microtubule growth. Phosphomimetics on Dam1 also increased the likelihood of switches from microtubule growth into shortening, further promoting release in an indirect manner. Taken together, our results suggest that, in vivo, Aurora B releases kinetochores via at least two mechanisms: by weakening the kinetochore-microtubule interface and also by destabilizing the kinetochore-attached microtubule tip.


Conflict of interest statement

The authors declare no conflict of interest.

Figures

Fig. 1.
Fig. 1.
Kinase phosphorylation can promote release of kinetochores from microtubules directly or indirectly. (A) The kinetochore-attached microtubule tip can grow (assemble) or shorten (disassemble), with transitions between these states governed by the rates of catastrophe, k1, and rescue, k2. The kinetochore can detach from either state, with rates k3 and k4. Phosphorylation may promote release directly by accelerating the rates of detachment (k3 or k4). Because k4 is generally much faster than k3 (14, 25, 26), phosphorylation may also promote release indirectly by accelerating catastrophe (k1) or inhibiting rescue (k2). In principle, all four kinetic rates could be influenced by kinase phosphorylation. (B) The relative abundance of core kinetochore proteins that copurified with Dsn1-His-Flag was similar for wild-type (WT, SBY8524), Ndc80-7A (SBY8522), Ndc80-7D (SBY8523), Dam1-4D (SBY9021), and for the double-mutant, Ndc80-7D + Dam1-4D (SBY9020). Proteins were separated by SDS/PAGE and detected by silver staining. Additional mutants are shown in Fig. S1.
Fig. 2.
Fig. 2.
Phospho-deficient kinetochore particles exhibit wild-type-like rupture strength, phosphomimetics are weaker. (A) Schematic of laser-trap assay. (B) Representative records of tensile force versus time for indicated kinetochore particles bound to assembling tips and then tested with a 0.25 pN⋅s−1 force ramp. Gray dots show raw data. Colored traces show the same data after smoothing with a 500-ms sliding boxcar average. Arrows mark ruptures. Dashed vertical lines mark the start of the force ramp. (C) Fraction of beads that bound a growing microtubule tip versus concentration of kinetochore particles used to prepare the beads. Dotted curves show Poisson fits. Error bars represent SD (n = 2–20 experiments) (Table S1). (D) Mean rupture force versus concentration of kinetochore particles used to prepare the beads. (E) Survival probability versus force, and distributions of rupture force (Inset), for beads prepared with indicated kinetochore particles at ∼6 nM Dsn1 (which corresponds to the gray shaded regions in C and D). (F) Mean rupture forces for beads prepared at ∼6 nM Dsn1. Error bars in D and F represent SEM (n = 6–80 events) (Table S1). **P < 0.05 (statistically significant differences); *P > 0.1 (lack of statistical significance). Wild-type data in C, D, and F are from ref. .
Fig. 3.
Fig. 3.
Phosphomimetic mutations on Dam1 and Ndc80 promote detachment directly and indirectly. (A) Example records of position versus time for Dam1-4D (green, SBY9021), Ndc80-7D (red, SBY8523), and Ndc80-7A (blue, SBY8522) kinetochore particles subjected continuously to 2.5 pN of tension. Increasing position represents movement coupled to microtubule tip growth. Decreasing position represents movement driven by tip shortening. Black arrows indicate catastrophes (↓) and rescues (↑). Black dots indicate detachment of the bead from the microtubule tip. For clarity, traces are offset vertically. (B and C) Survival probability distributions versus total distance traveled (B) and versus event duration (C) for Dam1-4D (green), Ndc80-7D (red), and Ndc80-7A (blue) kinetochore particles. (D) Mean attachment lifetimes for the indicated kinetochore particles under 2.5 pN of tension. Error bars represent uncertainty due to counting statistics (n = 16–53) (Table S2). (E and F) Measured rates of detachment during growth (E) and during shortening (F), corresponding to rates k3 and k4 in Fig. 1A, respectively. Error bars represent uncertainty because of counting statistics (n = 4–47) (Tables S3 and S4). (G and H) Measured rates of catastrophe (G) and rescue (H), corresponding to rates k1 and k2 in Fig. 1A, respectively. Error bars represent uncertainty because of counting statistics (n = 3–11) (Tables S3 and S4). **P < 0.05 (statistically significant differences) (Table S5). Rates for Dam1-S20D (SBY10280) are given in Tables S2S4 and Fig. S4.

References

    1. Cheeseman IM, Desai A. Molecular architecture of the kinetochore-microtubule interface. Nat Rev Mol Cell Biol. 2008;9(1):33–46. - PubMed
    1. DeLuca JG, Musacchio A. Structural organization of the kinetochore-microtubule interface. Curr Opin Cell Biol. 2012;24(1):48–56. - PMC - PubMed
    1. McAinsh AD, Tytell JD, Sorger PK. Structure, function, and regulation of budding yeast kinetochores. Annu Rev Cell Dev Biol. 2003;19:519–539. - PubMed
    1. Biggins S, et al. The conserved protein kinase Ipl1 regulates microtubule binding to kinetochores in budding yeast. Genes Dev. 1999;13(5):532–544. - PMC - PubMed
    1. Hauf S, et al. The small molecule Hesperadin reveals a role for Aurora B in correcting kinetochore-microtubule attachment and in maintaining the spindle assembly checkpoint. J Cell Biol. 2003;161(2):281–294. - PMC - PubMed

Publication types

LinkOut - more resources