

Measuring iron in the brain using quantitative susceptibility mapping and X-ray fluorescence imaging
- PMID: 23591072
- PMCID: PMC3843006
- DOI: 10.1016/j.neuroimage.2013.04.022
Measuring iron in the brain using quantitative susceptibility mapping and X-ray fluorescence imaging
Abstract
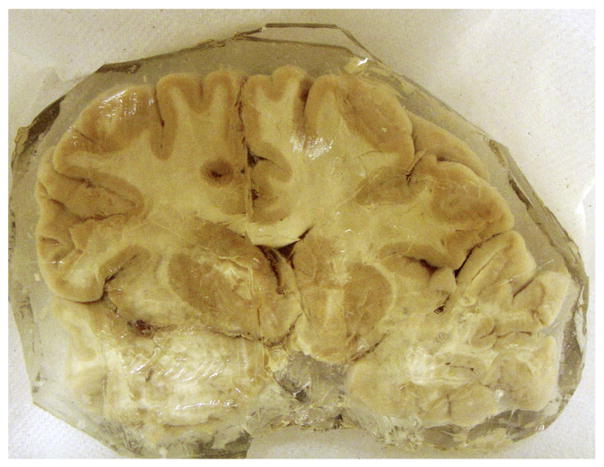
Measuring iron content in the brain has important implications for a number of neurodegenerative diseases. Quantitative susceptibility mapping (QSM), derived from magnetic resonance images, has been used to measure total iron content in vivo and in post mortem brain. In this paper, we show how magnetic susceptibility from QSM correlates with total iron content measured by X-ray fluorescence (XRF) imaging and by inductively coupled plasma mass spectrometry (ICPMS). The relationship between susceptibility and ferritin iron was estimated at 1.10±0.08 ppb susceptibility per μg iron/g wet tissue, similar to that of iron in fixed (frozen/thawed) cadaveric brain and previously published data from unfixed brains. We conclude that magnetic susceptibility can provide a direct and reliable quantitative measurement of iron content and that it can be used clinically at least in regions with high iron content.
Copyright © 2013 Elsevier Inc. All rights reserved.
Conflict of interest statement
The authors have no Conflicts of interest.
Figures


References
-
- Bartzokis G, Aravagiri M, Oldendorf WH, Mintz J, Marder SR. Field dependent transverse relaxation rate increase may be a specific measure of tissue iron stores. Magn Reson Med. 1993;29:459–464. - PubMed
-
- Bartzokis G, Tishler TA, Lu PH, Villablanca P, Altshuler LL, Carter M, Huang D, Edwards N, Mintz J. Brain ferritin iron may influence age- and gender-related risks of neurodegeneration. Neurobiol Aging. 2007;28:414–423. - PubMed
-
- Bouras C, Giannakopoulos P, Good PF, Hsu A, Hof PR, Perl DP. A laser microprobe mass analysis of brain aluminum and iron in dementia pugilistica: comparison with Alzheimer’s disease. Eur Neurol. 1997;38:53–58. - PubMed
-
- Butz T, Flagmeyer R-H, Heitmann J, Jamieson DN, Legge GJF, Lehmann D, Reibetanz U, Reinert T, Saint A, Spemann D, Szymanski R, Tröger W, Vogt J, Zhu J. The Leipzig high-energy ion nanoprobe: a report on first results. Nucl Instrum Methods Phys Res B. 2000;161–163:323–327.
Publication types
MeSH terms
Substances
Grants and funding
LinkOut - more resources
Full Text Sources
Other Literature Sources
Medical
