

Early prediction of treatment resistance in low-risk gestational trophoblastic neoplasia using population kinetic modelling of hCG measurements
- PMID: 23591194
- PMCID: PMC3664307
- DOI: 10.1038/bjc.2013.123
Early prediction of treatment resistance in low-risk gestational trophoblastic neoplasia using population kinetic modelling of hCG measurements
Abstract
Background: In low-risk gestational trophoblastic neoplasia (GTN) patients, a predictive marker for early identification of methotrexate (MTX) resistance would be useful. We previously demonstrated that kinetic modelling of human chorionic gonadotrophin (hCG) measurements could provide such a marker. Here we validate this approach in a large independent patient cohort.
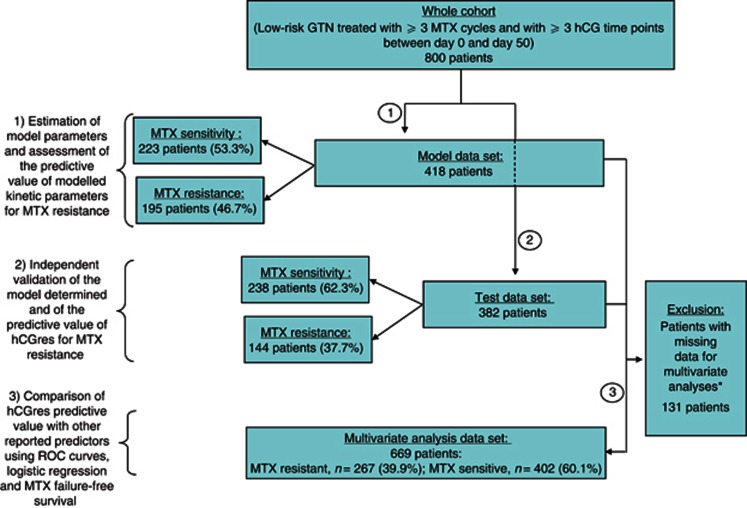
Methods: Serum hCG measurements of 800 low-risk GTN patients treated with MTX were analysed. The cohort was divided into Model and Test data sets. hCG kinetics were described from initial treatment day to day 50 using: '(hCG(time))=hCG0*exp(-k*time)+hCGres', where hCGres is the modelled residual production, hCG0 is the baseline hCG level, and k is the rate constant. HCGres-predictive value was investigated against previously reported predictors of MTX resistance.
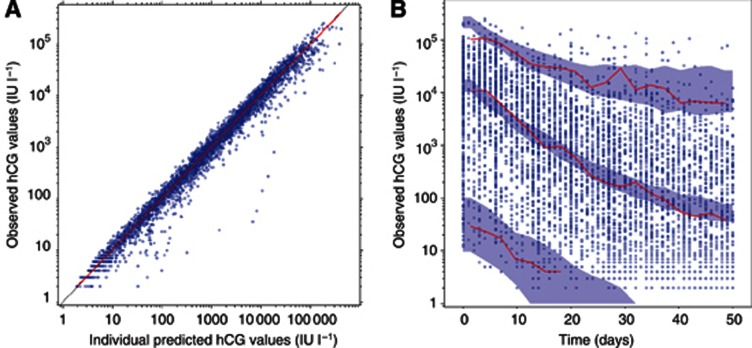
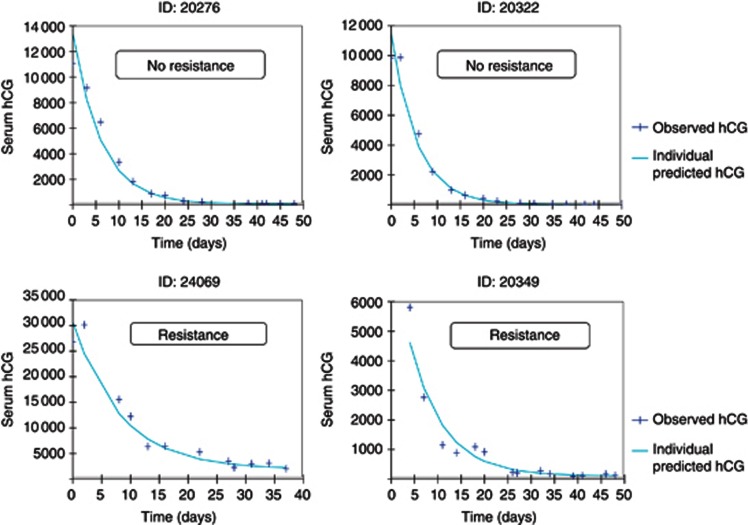
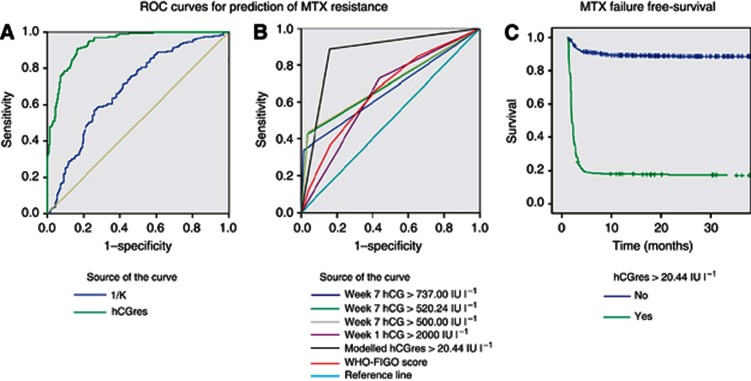
Results: Declining hCG measurements were well fitted by the model. The best discriminator of MTX resistance in the Model data set was hCGres, categorised by an optimal cut-off value of >20.44 IU l(-1): receiver-operating characteristic (ROC) area under the curve (AUC)=0.87; Se=0.91; Sp=0.83. The predictive value of hCGres was reproducible using the Test data set: ROC AUC=0.87; Se=0.88; Sp=0.86. Multivariate analyses revealed hCGres as a better predictor of MTX resistance (HR=1.01, P<0.0001) and MTX failure-free survival (HR=13.25, P<0.0001) than other reported predictive factors.
Conclusion: hCGres, a modelled kinetic parameter calculated after fully dosed three MTX cycles, has a reproducible value for identifying patients with MTX resistance.
Figures
Similar articles
-
Validation of the Predictive Value of Modeled Human Chorionic Gonadotrophin Residual Production in Low-Risk Gestational Trophoblastic Neoplasia Patients Treated in NRG Oncology/Gynecologic Oncology Group-174 Phase III Trial.Int J Gynecol Cancer. 2016 Jan;26(1):208-15. doi: 10.1097/IGC.0000000000000581. Int J Gynecol Cancer. 2016. PMID: 26569059 Free PMC article. Clinical Trial.
-
Validation of an online tool for early prediction of the failure-risk in gestational trophoblastic neoplasia patients treated with methotrexate.Cancer Chemother Pharmacol. 2020 Jul;86(1):15-24. doi: 10.1007/s00280-020-04086-0. Epub 2020 Jun 4. Cancer Chemother Pharmacol. 2020. PMID: 32500221
-
Predictive values of hCG clearance for risk of methotrexate resistance in low-risk gestational trophoblastic neoplasias.Ann Oncol. 2010 Aug;21(8):1643-1650. doi: 10.1093/annonc/mdq033. Epub 2010 Feb 12. Ann Oncol. 2010. PMID: 20154304
-
Does a human chorionic gonadotropin level of over 20,000 IU/L four weeks after uterine evacuation for complete hydatidiform mole constitute an indication for chemotherapy for gestational trophoblastic neoplasia?Eur J Obstet Gynecol Reprod Biol. 2018 Apr;223:50-55. doi: 10.1016/j.ejogrb.2018.02.001. Epub 2018 Feb 15. Eur J Obstet Gynecol Reprod Biol. 2018. PMID: 29477553 Review.
-
[Trophoblastic diseases].Ned Tijdschr Geneeskd. 2008 Oct 11;152(41):2219-24. Ned Tijdschr Geneeskd. 2008. PMID: 19009808 Review. Dutch.
Cited by
-
SEOM clinical guidelines in gestational trophoblastic disease (2017).Clin Transl Oncol. 2018 Jan;20(1):38-46. doi: 10.1007/s12094-017-1793-0. Epub 2017 Nov 17. Clin Transl Oncol. 2018. PMID: 29149431 Free PMC article.
-
Establishing the Quantitative Relationship Between Lanreotide Autogel®, Chromogranin A, and Progression-Free Survival in Patients with Nonfunctioning Gastroenteropancreatic Neuroendocrine Tumors.AAPS J. 2016 May;18(3):703-12. doi: 10.1208/s12248-016-9884-3. Epub 2016 Feb 23. AAPS J. 2016. PMID: 26908127 Free PMC article. Clinical Trial.
-
Validation of the Predictive Value of Modeled Human Chorionic Gonadotrophin Residual Production in Low-Risk Gestational Trophoblastic Neoplasia Patients Treated in NRG Oncology/Gynecologic Oncology Group-174 Phase III Trial.Int J Gynecol Cancer. 2016 Jan;26(1):208-15. doi: 10.1097/IGC.0000000000000581. Int J Gynecol Cancer. 2016. PMID: 26569059 Free PMC article. Clinical Trial.
-
Risk factors for methotrexate resistance in low-risk gestational trophoblastic neoplasia patients (FIGO score 0-4).Am J Cancer Res. 2024 Mar 15;14(3):1353-1362. doi: 10.62347/ZUCG8140. eCollection 2024. Am J Cancer Res. 2024. PMID: 38590416 Free PMC article.
-
A review on management of gestational trophoblastic neoplasia.J Family Med Prim Care. 2020 Mar 26;9(3):1287-1295. doi: 10.4103/jfmpc.jfmpc_876_19. eCollection 2020 Mar. J Family Med Prim Care. 2020. PMID: 32509606 Free PMC article. Review.
References
-
- Ahn JE, Karlsson MO, Dunne A, Ludden TM. Likelihood based approaches to handling data below the quantification limit using NONMEM VI. J Pharmacokinet Pharmacodyn. 2008;35:401–421. - PubMed
-
- Alifrangis C, Agarwal R, Short D, Fisher RA, Sebire NJ, Harvey R, Savage PM, Seckl MJ. EMA/CO for high-risk gestational trophoblastic neoplasia: good outcomes with induction low-dose etoposide-cisplatin and genetic analysis. J Clin Oncol. 2013;31:280–286. - PubMed
-
- Bagshawe KD. Choriocarcinoma. A model for tumour markers. Acta Oncol. 1992;31:99–106. - PubMed
-
- Bagshawe KD, Dent J, Newlands ES, Begent RH, Rustin GJ. The role of low-dose methotrexate and folinic acid in gestational trophoblastic tumours (GTT) Br J Obstet Gynaecol. 1989;96:795–802. - PubMed
-
- Beal SL. Ways to fit a PK model with some data below the quantification limit. J Pharmacokinet Pharmacodyn. 2001;28:481–504. - PubMed
Publication types
MeSH terms
Substances
Grants and funding
LinkOut - more resources
Full Text Sources
Other Literature Sources
