. 2013 Apr 16:9:660.
doi: 10.1038/msb.2013.16.

Indirect and suboptimal control of gene expression is widespread in bacteria

Affiliations

Indirect and suboptimal control of gene expression is widespread in bacteria

Morgan N Price et al. Mol Syst Biol. .

Abstract

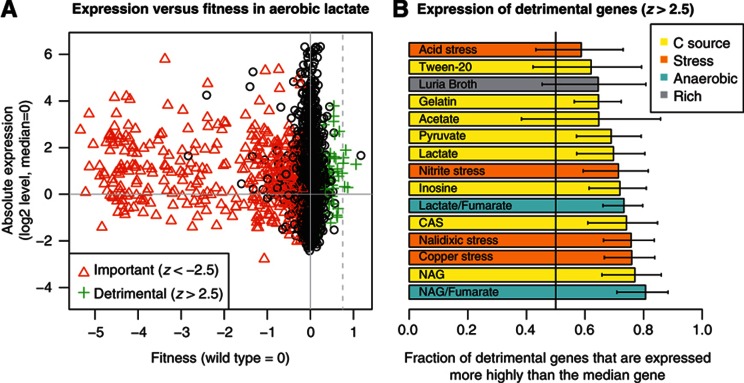
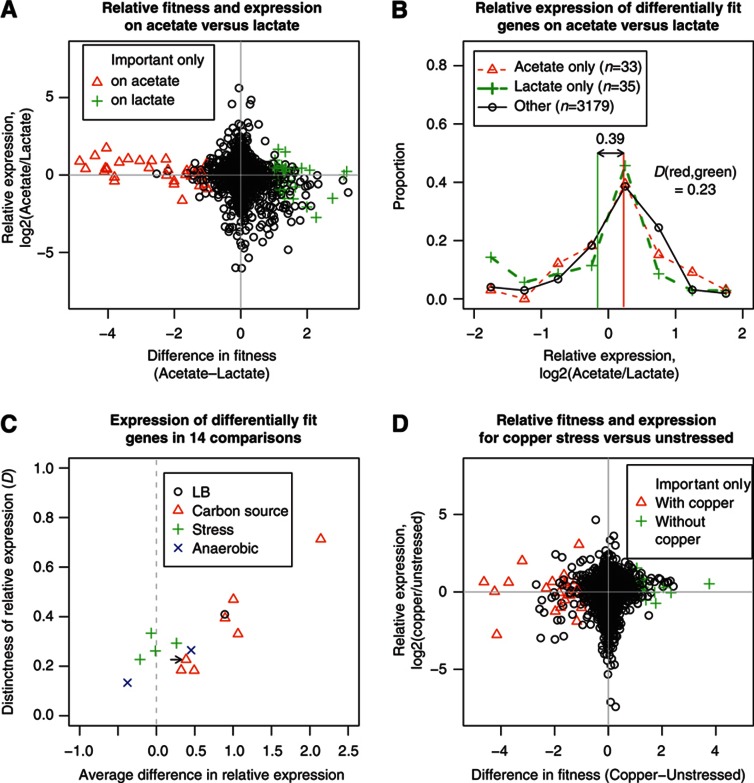
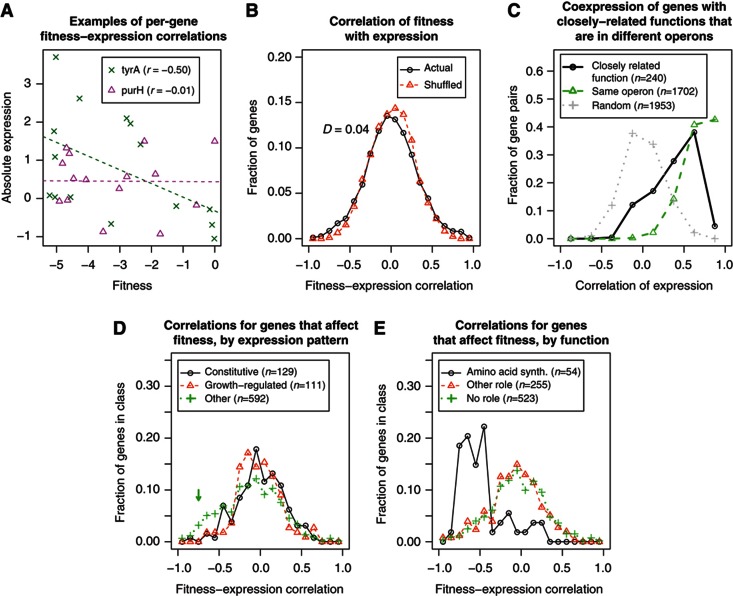
Gene regulation in bacteria is usually described as an adaptive response to an environmental change so that genes are expressed when they are required. We instead propose that most genes are under indirect control: their expression responds to signal(s) that are not directly related to the genes' function. Indirect control should perform poorly in artificial conditions, and we show that gene regulation is often maladaptive in the laboratory. In Shewanella oneidensis MR-1, 24% of genes are detrimental to fitness in some conditions, and detrimental genes tend to be highly expressed instead of being repressed when not needed. In diverse bacteria, there is little correlation between when genes are important for optimal growth or fitness and when those genes are upregulated. Two common types of indirect control are constitutive expression and regulation by growth rate; these occur for genes with diverse functions and often seem to be suboptimal. Because genes that have closely related functions can have dissimilar expression patterns, regulation may be suboptimal in the wild as well as in the laboratory.


Conflict of interest statement

The authors declare that they have no conflict of interest.

Figures

Figure 1
Figure 1
In S. oneidensis MR-1, genes that are detrimental to fitness are highly expressed. (A) Absolute expression level and mutant fitness during aerobic growth in minimal lactate medium. The median gene’s expression is set to 0. Genes with significant fitness effects (|z|>2.5) are color-coded. The dotted vertical line at 0.75 demarcates seven strongly detrimental genes. (B) In all 15 conditions, genes that are detrimental to fitness (z>2.5) tend to be expressed more highly than the typical gene. The vertical line shows the proportion that we would expect by chance (50%). NAG is N-acetylglucosamine and CAS is casamino acids. Error bars are 95% confidence intervals (binomial test).
Figure 2
Figure 2
In S. oneidensis MR-1, differential fitness and relative expression are poorly correlated. (A) Relative expression versus the difference in fitness for aerobic growth on acetate versus aerobic growth on lactate. Genes are color-coded if they are important for fitness on acetate or lactate but not the other condition (specifically, if fitness is below −0.75 in that condition but not in the other condition and if the difference in fitness between the conditions is at least 1.0). (B) Another view of the relative expression from (A): the distribution of relative expression for genes that are only important on acetate, only important on lactate, or other genes. Out-of-range values are included in the left- or right-most bins. The vertical lines show the averages for genes that are important only in acetate (in red) or only in lactate (in green). The average upregulation of these two types of genes differs by 0.39 and the distributions overlap considerably (D=0.23). (C) The change in expression of differentially fit genes in each of 14 conditions when compared with aerobic lactate. Each comparison is performed as in (B): the x axis shows the difference between the two averages and the y axis shows the Kolmogorov–Smirnov D statistic for how distinct the two distributions are. The arrow highlights the comparison between acetate and lactate from (B). (D) Relative expression versus the difference in fitness for cells growing in minimal lactate medium with or without copper added.
Figure 3
Figure 3
In S. oneidensis MR-1, few genes are under adaptive control. (A) Absolute expression versus fitness for tyrA and purH across 15 growth conditions. The lines show the best fit for each gene: tyrA tends to be expressed more highly when it is more important for fitness (r=−0.50), but purH does not (r=−0.01). (B) The distribution of fitness–expression correlations, computed as in (A), for 3247 genes and for 3247 shuffled controls. (C) The distribution of coexpression, across 329 experiments, of pairs of genes that are not in the same operon and have closely related functions (i.e., matching TIGR subroles and similar patterns of mutant fitness across 195 experiments). We also show the distribution of coexpression for genes that are predicted to be in the same operon, as a positive control, and for random pairs of genes that have different TIGR subroles and are not adjacent or predicted to be in the same operon, as a negative control. (D, E) The distribution of fitness–expression correlations (as in B) when considering only genes that have fitness of above 0.75 or below −0.75 in at least one of the 15 conditions. In (D), we separate out constitutive and growth-regulated genes from other genes, and the green arrow highlights the adaptive regulation of some of the other genes. In (E), the genes are classified by their TIGR roles, which highlights the adaptive control of amino-acid synthesis genes but not other genes.
Figure 4
Figure 4
Biosynthetic pathways are upregulated in minimal media in some bacteria but not in others. We examined whether auxotrophs were upregulated in minimal media, as compared with other genes, in (A) E. coli K-12; (B) S. oneidensis MR-1; (C) Z. mobilis ZM4; and (D) D. alaskensis G20. In all four organisms, the auxotrophs are annotated by TIGR role as being involved in amino acid, nucleotide, or cofactor synthesis, and experimental data confirm that they are important for growth in a defined medium but not in rich medium. For E. coli K-12, we used growth data of deletion mutants from the Keio collection (Baba et al, 2006) and expression data from Allen et al (2003). For the other organisms, we collected fitness data using pooled transposon mutants and we collected gene expression data using microarrays. Genes were considered as important only in defined medium if their fitness was below −0.75 in defined medium but not in rich medium and the difference in fitness was at least 1. The expression log2 ratios are normalized so that the median value is 0. Log2 ratios that are below −2 or above 2 are included in the left- or right-most bins, respectively.
Figure 5
Figure 5
Adaptive, low-cost, or suboptimal control of genes in Shewanella oneidensis MR-1. Among the genes with both fitness and expression data, we classified their control by the following criteria. If a gene fit into multiple categories, then it was counted only in the first (top-most) category. First, we classified genes as being under adaptive control if the fitness–expression correlation, across 15 matched conditions, was under −0.5. We used a threshold of −0.5 because this is roughly where the actual distribution of fitness–expression correlations diverges from the shuffled distribution (Figure 3B); also, 53% of amino-acid synthesis genes are below this threshold. We classified genes as constitutive and low cost if they had a low standard deviation of expression (in a large compendium), they were not detrimental to growth (in 38 groups of fitness experiments), and their absolute expression level was at most two-fold above the median gene in all of our 15 conditions. Genes that are significantly detrimental to growth in 1 or more of 38 groups of fitness experiments were subclassified into genes that are important for motility (motility ‘fitness’ below −0.4), selfish genes such as transposons, prophages, and restriction elements, or other unexplained genes. Genes were considered to change expression without being important for fitness if, in any of 14 comparisons between conditions, the expression changed by two-fold or more but the fitness value was between −0.4 and 0.4 in both conditions. The remaining genes were classified as having little phenotype or change in expression if their fitness value was between −0.75 and +0.75 in all 15 matched conditions.

Comment in

Similar articles

Cited by

References

    1. Allen TE, Herrgard MJ, Liu M, Qiu Y, Glasner JD, Blattner FR, Palsson BO (2003) Genome-scale analysis of the uses of the Escherichia coli genome: model-driven analysis of heterogeneous data sets. J Bacteriol 185: 6392–6399 - PMC - PubMed
    1. Baba T, Ara T, Hasegawa M, Takai Y, Okumura Y, Baba M, Datsenko KA, Tomita M, Wanner BL, Mori H (2006) Construction of Escherichia coli K-12 in-frame, single-gene knockout mutants: the Keio collection. Mol Syst Biol 2: 2006.0008 - PMC - PubMed
    1. Berg J, Willmann S, Lassig M (2004) Adaptive evolution of transcription factor binding sites. BMC Evol Biol 4: 42. - PMC - PubMed
    1. Birrell GW, Brown JA, Wu HI, Giaever G, Chu AM, Davis RW, Brown JM (2002) Transcriptional response of Saccharomyces cerevisiae to DNA-damaging agents does not identify the genes that protect against these agents. Proc Natl Acad Sci USA 99: 8778–8783 - PMC - PubMed
    1. Bremer H, Dennnis PP (1996) Modulation of chemical composition and other parameters of the cell by growth rate. In Escherichia coli and Salmonella typhimurium: Cellular and Molecular Biology Washington, DC: American Society for Microbiology2nd edn pp 1553–1569

Publication types

MeSH terms