. 2013:4:1717.
doi: 10.1038/ncomms2727.

Dynamic switching of calmodulin interactions underlies Ca2+ regulation of CaV1.3 channels

Affiliations

Dynamic switching of calmodulin interactions underlies Ca2+ regulation of CaV1.3 channels

Manu Ben Johny et al. Nat Commun. 2013.

Abstract

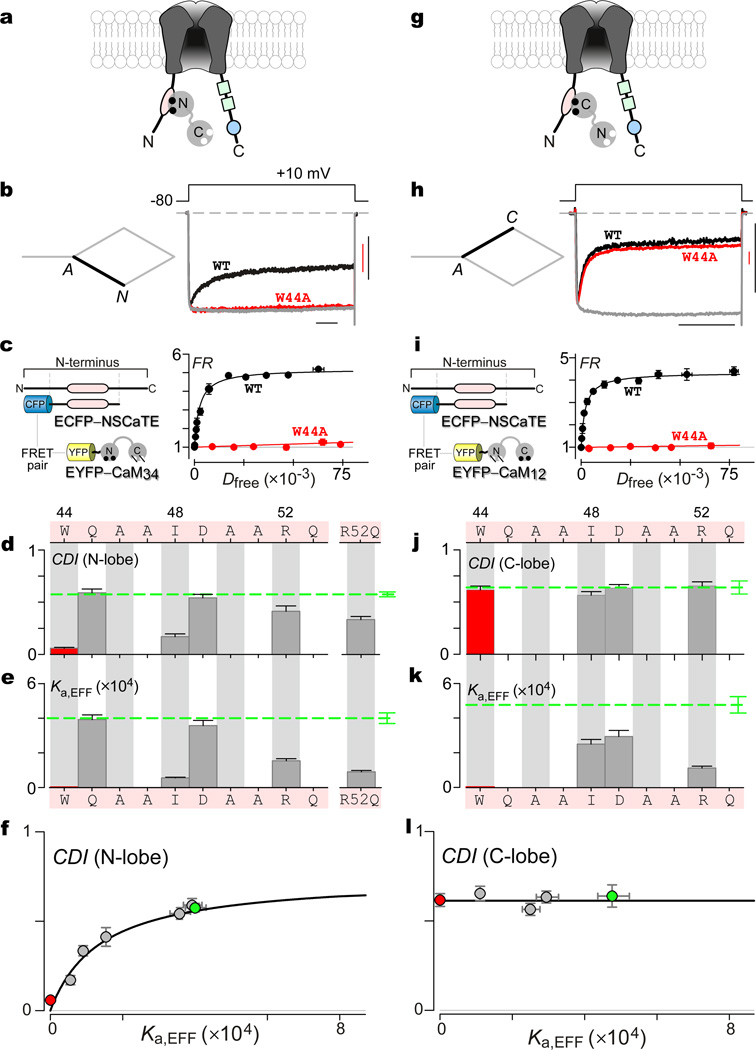
Calmodulin regulation of CaV channels is a prominent Ca(2+) feedback mechanism orchestrating vital adjustments of Ca(2+) entry. The long-held structural correlation of this regulation has been Ca(2+)-bound calmodulin, complexed alone with an IQ domain on the channel carboxy terminus. Here, however, systematic alanine mutagenesis of the entire carboxyl tail of an L-type CaV1.3 channel casts doubt on this paradigm. To identify the actual molecular states underlying channel regulation, we develop a structure-function approach relating the strength of regulation to the affinity of underlying calmodulin/channel interactions, by a Langmuir relation (individually transformed Langmuir analysis). Accordingly, we uncover frank exchange of Ca(2+)-calmodulin to interfaces beyond the IQ domain, initiating substantial rearrangements of the calmodulin/channel complex. The N-lobe of Ca(2+)-calmodulin binds an N-terminal spatial Ca(2+) transforming element module on the channel amino terminus, whereas the C-lobe binds an EF-hand region upstream of the IQ domain. This system of structural plasticity furnishes a next-generation blueprint for CaV channel modulation.


Figures

Figure 1
Figure 1. General schema for CaM regulation of representative L-type CaV1.3 channels
(a) Primary configurations of CaM/channel complex with respect to CaM-regulatory phenomena (E, A, IC, IN, and ICN). Inset at far right, cartoon of main channel landmarks involved in CaM regulation, with only the pore-forming α1D subunit of CaV1.3 diagrammed. Ca2+-inactivation (CI) region, in the proximal channel carboxy terminus (~160 aa), contains elements potentially involved in CaM regulation. IQ domain (IQ), comprising the C-terminal ~30 aa of the CI segment, long proposed as preeminent for CaM/channel binding. Dual vestigial EF-hand (EF) motifs span the proximal ~100 aa of the CI module; these have been proposed to play a transduction role in channel regulation. Proximal Ca2+-inactivating (PCI) region constitutes the CI element exclusive of the IQ domain. NSCaTE on channel amino terminus of CaV1.2–1.3 channels may be the N-lobe Ca2+/CaM effector site. (b) Whole-cell CaV1.3 currents expressed in HEK293 cell, demonstrating CDI in the presence of endogenous CaM only. CDI observed here can reflect properties of the entire system diagrammed in a, as schematized by the stick-figure diagram at the bottom of b. Here and throughout, the vertical scale bar pertains to 0.2 nA of Ca2+ current (black); and the Ba2+ current (gray) has been scaled ~3-fold downward to aid comparison of decay kinetics, here and throughout. Horizonal scale bar, 100 ms. (c) Currents during overexpression of CaMWT, isolating the behavior of the diamond-shaped subsystem at bottom. (d) Currents during overexpression of CaM12, isolating C-lobe form of CDI. (e) Currents during overexpression of CaM34, isolating N-lobe form of CDI. (c–e) Vertical bar, 0.2 nA Ca2+ current. Timebase as in b.
Figure 2
Figure 2. Probing functionally relevant CaM regulatory interactions via iTL analysis
(a) Isolated C- or N-lobe regulatory system (denoted by stick-figure diagrams on left) can be coarsely represented by a five-state scheme on right. A single lobe of apoCaM begins preassociated to channel (state 1). Following disassociation (state 2), CaM may bind two Ca2+ ions (state 3, black dots). Ca2+/CaM may subsequently bind to channel effector site (state 4). From here, transduction step leads to state 5, equivalent to CDI. Association constant for lobe of apoCaM binding to preassociation site is ɛ; whereas γ1 and γ2 are association constants for respective transitions from states 3 to 4, and states 4 to 5. (b) Unique Langmuir relation (Eq. 1) that will emerge upon plotting channel CDI (defined Fig. 1b, right) as a function of Ka,EFF (association constant measured for isolated channel peptide), if Ka,EFF is proportional to one of the actual association constants in the scheme as in a. Black symbols, hypothetical results for various channel/peptide mutations; green symbol, hypothetical wild type. (c) Predicted outcome if peptide association constant Ka,EFF has no bearing on association constants within holochannels. (d) Outcome if mutations affect holochannel association constants, but not peptide association constants. (e) Outcome if mutations affect holochannel association constant(s) and peptide association constant, but in ways that are poorly correlated.
Figure 3
Figure 3. Inconsistencies with IQ domain role as Ca2+/CaM effector site
(a) No appreciable deficit in isolated N-lobe CDI upon point alanine substitutions across the IQ domain (sequence at top with bolded isoleucine at ‘0’ position). Left, corresponding subsystem schematic. Middle, bar-graph summary of CDI metric, as defined in Fig. 1b. Bars, mean ± SEM for ~6 cells each. Green dashed line, wild-type profile; red bar, I[0]A; blue symbol in all panels, Y[3]D. Right, exemplar currents, demonstrating no change in N-lobe CDI upon I[0]A substitution. Horizontal scale bar, 100 ms; vertical scale bar, 0.2 nA Ca2+ current. Red, Ca2+ current; gray, Ba2+ current. (b) Isolated C-lobe CDI (corresponding subsystem schematized on left) exhibits significant attenuation by mutations surrounding the central isoleucine (colored bars). Format as in a. I[0]A shows the strongest attenuation (red bar and exemplar currents at right). Bars average ~5 cells ± SEM . Dashed green line, wild-type profile. Timebase as in b; vertical scale bar, 0.2 nA Ca2+ current . (c) Bar-graph summary of association constants (Ka,EFF = 1 / Kd,EFF) for Ca2+/CaM binding to IQ, evaluated for constructs exhibiting significant effects in b (colored bars, with I[0]A in red), or chosen at random (hashed in b). Error bars, nonlinear standard-deviation estimates. FRET partners schematized on the left, and exemplar binding curves on the right for I[0]A (red) and wild-type (black). Symbols average ~7 cells. Smooth curve fits, 1:1 binding model. Calibration to efficiency EA = 0.1, far right vertical scale bar. Horizontal scale bar corresponds to 100 nM. (d) Plots of N-lobe CDI versus Ka,EFF deviate from Eq. 1, much as in Fig. 2c. Green, wild type; red, I[0]A; blue, Y[3]D. (e) Plots of C-lobe CDI versus Ka,EFF also diverge from Langmuir, as in Fig. 1e. This result further argues against the IQ per se acting as an effector site for the C-lobe of Ca2+/CaM. Symbols as in d. (d, e) Y[3]D (blue symbol, CDI mean of 4 cells) yields poor Ca2+/CaM binding, but unchanged CDI. Supplementary Note 7, further FRET data.
Figure 4
Figure 4. iTL analysis of Ca2+/CaM effector role of NSCaTE module of CaV1.3 channels
(a) Cartoon depicting NSCaTE as putative effector interface for N-lobe of Ca2+/CaM. (b) Exemplar CaV1.3 whole-cell currents exhibiting robust isolated N-lobe CDI, as seen from the rapid decay of Ca2+ current (black trace). Corresponding stick-figure subsystem appears on the left. W[44]A mutation abolishes N-lobe CDI, as seen from the lack of appreciable Ca2+ current decay (red trace). Gray trace, averaged Ba2+ trace for wild-type (WT) and W[44]A constructs. Horizontal scale bar, 100 ms; vertical scale bar, 0.2 nA Ca2+ current (red, W44A; black, WT). (c) FRET 2-hybrid binding curves for Ca2+/CaM34 and NSCaTE segment, with FRET partners schematized on the left. Wild-type pairing (WT) in black; W[44]A mutant pairing in red. Each symbol, mean ± SEM of ~5 cells. (d) Bar-graph summary of N-lobe CDI for NSCaTE mutations measured after 800-ms depolarization, with NSCaTE sequence at the top, as numbered by position within CaV1.3.. Data for W[44]A in red; dashed green line, wild type. Bars, mean ± SEM of ~5 cells. (e) Association constants (Ka,EFF = 1 / Kd,EFF) for Ca2+/CaM34 binding to NSCaTE module evaluated for constructs exhibiting significant effects in panel d. Error bars, nonlinear standard deviation estimates. Data for W[44]A in red; dashed green line, wild type. (f) Plotting N-lobe CDI versus Ka,EFF uncovers a Langmuir, identifying NSCaTE as functionally relevant effector site. W[44]A in red; wild type in green. (g-l) iTL fails to uphold NSCaTE as effector site for C-lobe of Ca2+/CaM. Format as in a–f. (h, j) C-lobe CDI at 300 ms, unchanged by NSCaTE mutations. Bars in j, mean ± SEM of ~5 cells. (i, k) Changes in Ka,EFF of NSCaTE module for Ca2+/CaM12 via 33-FRET. Each symbol in i, mean ± SEM of ~5 cells. (l) C-lobe CDI versus Ka,EFF deviates from Langmuir, as in Fig. 2c.
Figure 5
Figure 5. iTL analysis of PCI segment as C-lobe Ca2+/CaM effector interface
(a) Channel cartoon depicting PCI segment as putative effector site for C-lobe of Ca2+/CaM. (b) Isolated N-lobe CDI for wild type (WT) and LGF→AAA (LGF) mutant channels. Ca2+ current for WT in red, and for LGF in red. Gray, averaged Ba2+ trace. Horizontal scale bar, 100 ms; vertical scale bar, 0.2 nA Ca2+ current (red, LGF; black, WT). (c) Isolated C-lobe CDI for WT and LGF mutant channels, indicating strong CDI attenuation by LGF mutation. Format as in b. (d) FRET 2-hybrid binding curves for Ca2+/CaM pitted against PCI segments, for WT (black) and LGF (red). Each symbol, mean ± SEM from ~ 9 cells. (e) Bar-graph summary confirming no appreciable reduction of isolated N-lobe CDI, over all alanine scanning mutants across the PCI region (sequence at the top). Schematic of corresponding system under investigation at the left. Green dashed line, wild type; red, LGF mutant; gaps, nonexpressing configurations. Bars, mean ± SEM of ~5 cells. (f) Bar-graph summary, C-lobe CDI for alanine scan of PCI. Red bar, LGF→AAA mutant showing strong CDI reduction. Rose bar, other loci showing substantial CDI reduction. Hashed, randomly chosen loci for subsequent FRET analysis below. Bars, mean ± SEM of ~5 cells. (e, f) CDI decrease for YLT cluster (Fig. 5e, f) reflects reduced Ca2+ entry from 30-mV depolarizing shift in activation, not CDI attenuation per se. Shifts for all other loci were at most ±10 mV (not shown). (g) Association constants for Ca2+/CaM binding to PCI region, with FRET partners as diagrammed on the left. Green dashed line, wild-type profile. PCI mutations yielding large C-lobe CDI deficits were chosen for FRET analysis (red and rose in f), as well as those chosen at random (hashed in f). Error bars, nonlinear estimates of standard deviation. (h) Plots of N-lobe CDI versus Ka,EFF for Ca2+/CaM binding to PCI deviated from Langmuir. Red, LGF; green, WT. (i) Alternatively, plotting C-lobe CDI revealed Langmuir relation, supporting PCI as C-lobe Ca2+/CaM effector site. Symbols as in h.
Figure 6
Figure 6. Role of IQ domain in C-lobe CDI
(a) Cartoon depicting putative binding interaction between IQ domain and PCI segment, which is also required for C-lobe CDI. (b) Bar-graph summary of C-lobe CDI measured for alanine scan of IQ domain, reproduced from Fig. 3b. Strongest CDI reduction for I[0]A mutant (red), followed closely by loci affiliated with rose and blue bars underneath gray dashed-line. Dashed-green line, wild-type. (c) Association constants Ka,EFF determined for 33-FRET binding between IQ domain and PCI region (partners diagrammed at left), under elevated levels of Ca2+. Wild-type profile, green dashed line. Bars, Ka,EFF for mutants with strongest effects (colored bars in b) or chosen at random (hashed bars in b). Error bars, nonlinear standard deviation estimates. (d) Exemplar 33-FRET binding curves for IQ/PCI interaction. Each symbol, mean ± SEM of ~8 cells. Absent Ca2+, the IQ domain associates only weakly with the PCI region (gray). However, elevated Ca2+ greatly enhances binding (black). (e) 33-FRET binding curves for I[0]A (red) and Q[1]A (blue) mutations under elevated Ca2+. Each symbol, mean ± SEM of ~5 cells. Fit for wild type IQ/PCI interaction reproduced from d in black. (f) Plotting C-lobe CDI versus Ka,EFF under elevated Ca2+ unveils a well-resolved Langmuir relation. WT (green), I[0]A (red), and Q[1]A (blue).
Figure 7
Figure 7. Footprint of apoCaM preassociation with the PCI segment
(a) Channel cartoon depicting apoCaM preassociated with the CI region, with C-lobe engaging IQ domain, and N-lobe associated with PCI region. (b) Whole-cell currents for TVM→AAA mutant in the PCI segment (Ca2+ in red; Ba2+ in gray), with only endogenous CaM present. Horizontal scale bar, 100 ms; vertical scale bar, 0.2 nA Ca2+ current. (c) Overexpressing CaMWT rescues CDI for TVM→AAA mutation, suggesting that PCI region harbors an apoCaM preassociation locus. Format as in b. (d) 33-FRET binding curves show strong apoCaM binding to CI region. Wild type (WT) in black; TVM→AAA in red. Each symbol, mean ± SEM of ~7 cells. (e) Bar-graph summary of CDI with only endogenous CaM present (CDICaMendo), across alanine scan of PCI region. TVM→AAA (red) shows strongest effect, with rose colored bars also showing appreciable CDI reduction. Bars, mean ± SEM of ~5 cells. Left, schematic of relevant CaM subsystem. (f) Bar-graph summary of CDI rescue upon overexpressing CaMWT (CDICaMhi), for mutations showing significant loss of CDI (colored bars in e), or chosen at random (hashed bars in e). Bars, mean ± SEM of ~5 cells. Corresponding subsystem of regulation on the left. (g) Bar-graph summary of Ka,EFF for apoCaM binding to CI region, with partners as sketched on the left. Data obtained for nearly all mutants with significant CDI reduction (colored in e), and for some mutants chosen at random (hashed in e). Error bars, nonlinear estimates of standard deviation. (h) iTL analysis confirms role of PCI as functionally relevant apoCaM site. Plotting CDICaMendo/CDICaMhi (e and f) versus Ka,EFF for apoCaM/CI binding uncovers well-resolved Langmuir relation. TVM→AAA, red; WT, green. (i) Overlaying like data for IQ-domain analysis presented elsewhere (blue symbols here) displays remarkable agreement, consistent with the same apoCaM binding both PCI and IQ domains. Deep blue symbols, A[−4], I[0], F[+4] hotspots for apoCaM interaction with IQ element.
Figure 8
Figure 8. New view of CaM regulatory configurations of CaV1.3 channels
(a) Molecular layout of configurations A, IC, IN, and ICN for conceptual scheme in Fig. 1a. ApoCaM preassociates with CI region: C-lobe articulates IQ domain, and N-lobe engages the PCI segment. Once Ca2+ binds CaM, the N-lobe of Ca2+/CaM departs to NSCaTE on channel amino terminus, eliciting N-lobe CDI (IN). Alternatively, the C-lobe of Ca2+/CaM migrates to PCI segment, recruiting IQ domain to tri-partite complex (IC). Finally, ICN corresponds to channel that has undergone both N- and C-lobe CDI. (b) De novo model of CaV1.3 CI region docked to apoCaM (PCI region: green; IQ domain: blue). ApoCaM hotspots (Fig. 6e–g) in red. C-lobe of apoCaM contacts IQ, while N-lobe binds EF-hand region. (c) Left, atomic structure of NSCaTE bound to N-lobe of Ca2+/CaM (2LQC). NSCaTE peptide in tan; and N-lobe Ca2+/CaM in cyan. Ca2+, yellow. N-lobe CDI hotspots on NSCaTE in red. Right, de novo model of tripartite IQ-PCI-Ca2+/CaM complex (PCI region, green; IQ domain, blue). C-lobe CDI hotspots in red for both PCI and IQ domains.

References

    1. Dunlap K. Calcium channels are models of self-control. J. Gen. Physiol. 2007;129:379–383. - PMC - PubMed
    1. Halling DB, Aracena-Parks P, Hamilton SL. Regulation of voltage-gated Ca2+ channels by calmodulin. Sci STKE. 2006;2006 er1. - PubMed
    1. Erickson MG, Alseikhan BA, Peterson BZ, Yue DT. Preassociation of calmodulin with voltage-gated Ca(2+) channels revealed by FRET in single living cells. Neuron. 2001;31:973–985. - PubMed
    1. Erickson MG, Liang H, Mori MX, Yue DT. FRET two-hybrid mapping reveals function and location of L-type Ca2+ channel CaM preassociation. Neuron. 2003;39:97–107. - PubMed
    1. Pitt GS, et al. Molecular basis of calmodulin tethering and Ca2+-dependent inactivation of L-type Ca2+ channels. J. Biol. Chem. 2001;276:30794–30802. - PubMed

Publication types

MeSH terms

LinkOut - more resources