. 2013:4:1735.
doi: 10.1038/ncomms2719.

Mutually exclusive regulation of T cell survival by IL-7R and antigen receptor-induced signals

Affiliations
Free PMC article

Mutually exclusive regulation of T cell survival by IL-7R and antigen receptor-induced signals

Paul Koenen et al. Nat Commun. 2013.
Free PMC article

Abstract

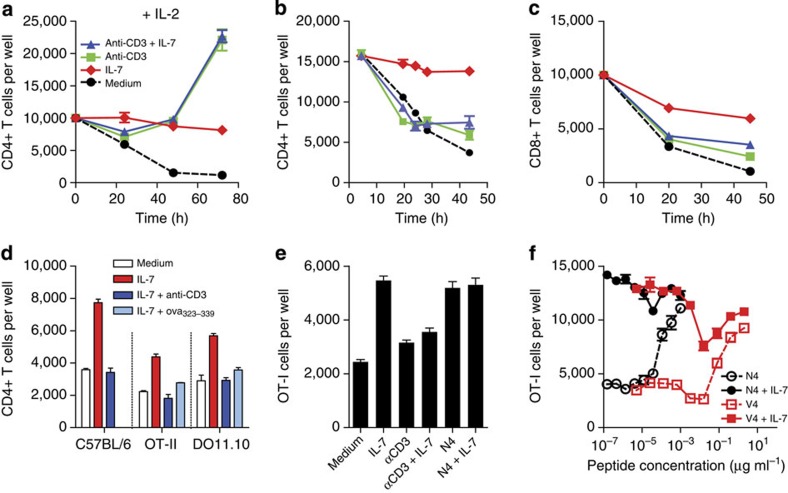
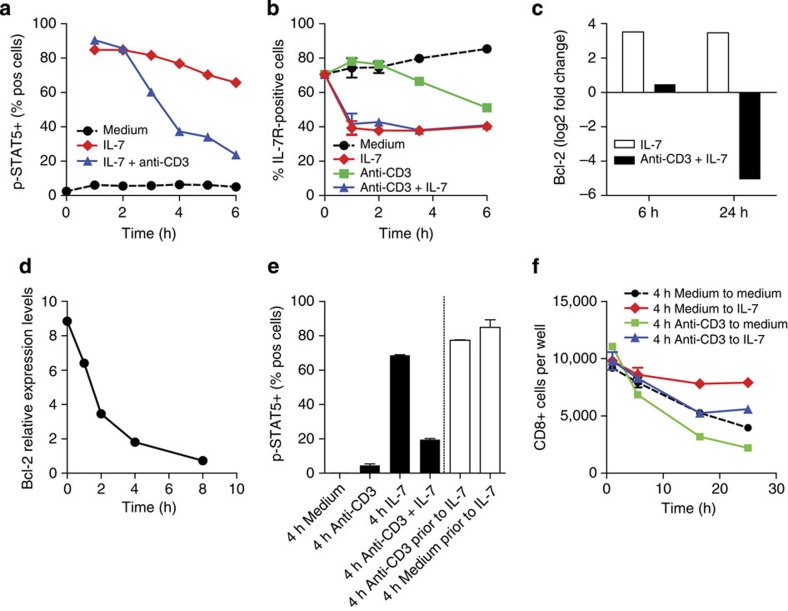
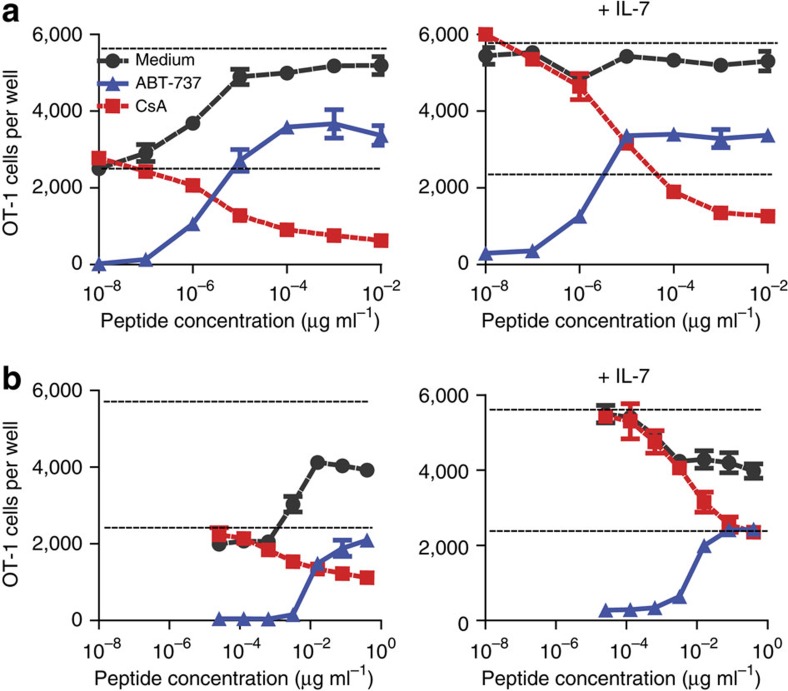
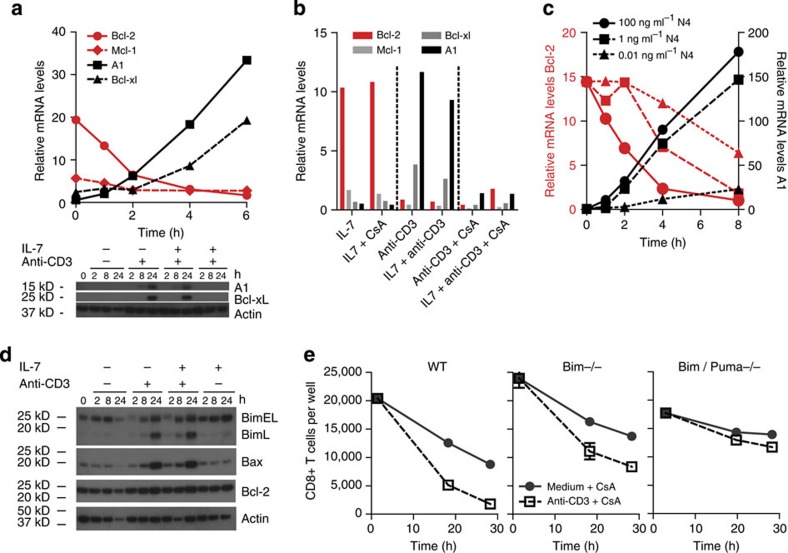
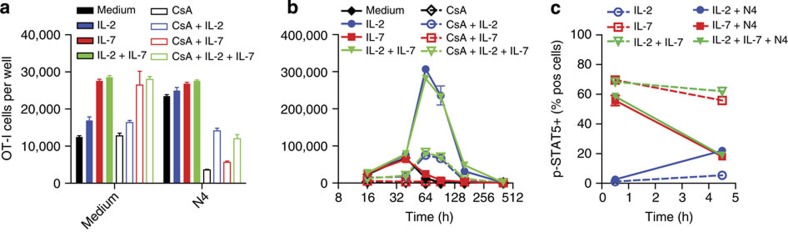
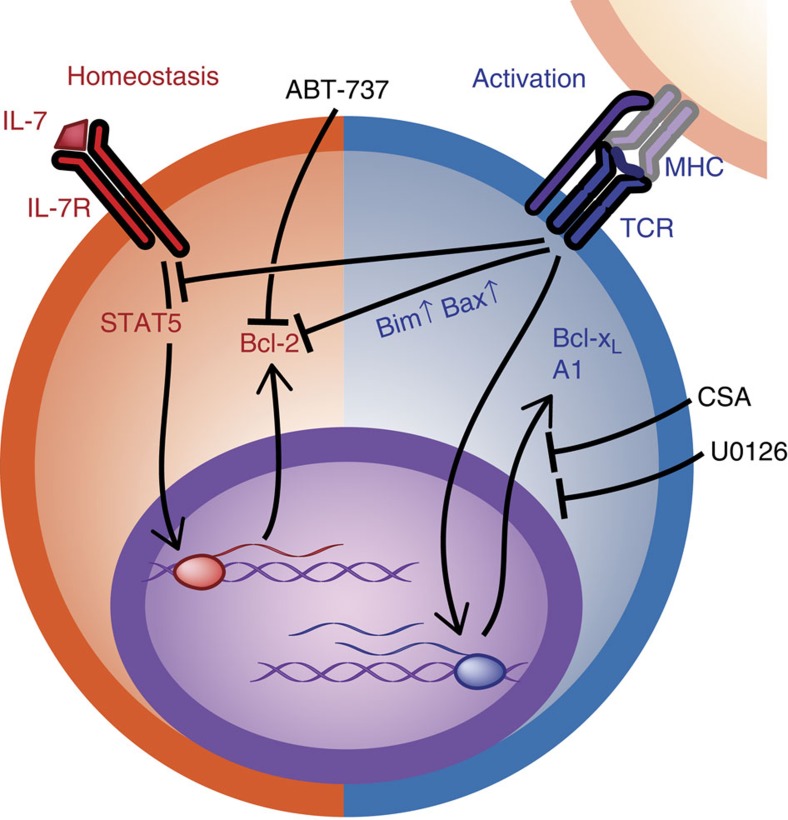
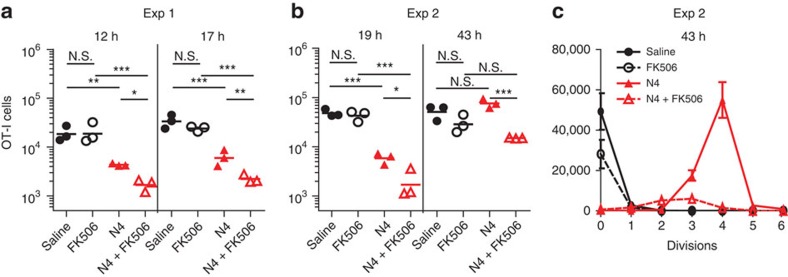
Two major processes govern T cell proliferation and survival: interleukin-7-mediated homeostasis and antigen-induced selection. How cells transit between the two states is unknown. Here we show that T cell receptor ligation actively inhibits homeostatic survival signals while initiating a new, dominant survival programme. This switch is mediated by a change in the expression of pro- and anti-apoptosis proteins through the downregulation of Bcl-2 and the induction of Bim, A1 and Bcl-xL. Calcineurin inhibitors prevent the initiation of the new survival programme, while permitting the dominant repression of Bcl-2. Thus, in the presence of these drugs the response to antigen receptor ligation is cell death. Our results identify a molecular switch that can serve as an attractive target for inducing antigen-specific tolerance in treating autoimmune disease patients and transplant recipients.


Figures

Figure 1
Figure 1. TCR stimulation inhibits IL-7-mediated survival.
Purified CD4+ or CD8+ T cells were stimulated in vitro and total viable cells were measured at time points indicated. (a, b) Time course of viable CD4+ T cells from C57BL/6 mice cultured in medium alone or after stimulation with plate-bound anti-CD3 with and without 1 ng ml−1 IL-7 in the presence of 100 Ug ml−1 IL-2 (a) or without IL-2 (b). (c) Time course of viable CD8+ T cells from C57BL/6 mice cultured in medium alone or after stimulation with plate-bound anti-CD3 with and without 1 ng ml−1 IL-7. (d) CD4+ T cells from C57BL/6, OT-II and DO11.10 TCR tg mice were cultured for 16 h in medium with or without 1 ng ml−1 IL-7, or stimulated with plate-bound anti-CD3 or OVA peptide, and autologous splenocytes in the presence of 1 ng ml−1 IL-7. (e) OT-I CD8+ T cells were cultured for 22 h in medium or stimulated with plate-bound anti-CD3 or 0.01 μg ml−1 N4 peptide with and without 1 ng ml−1 IL-7. (f) CD8+ OT-I cells were stimulated for 20 h with a range of N4 (10−7– 10−3 μg ml−1) or V4 (5 × 10⁻⁶–2 μg ml−1) peptide concentrations in medium with or without 1 ng ml−1 IL-7. Symbols and colours of b and c as in a. Data are presented as means±s.e.m. of triplicate cultures.
Figure 2
Figure 2. TCR ligation inhibits Bcl-2 and phosporylation of STAT5.
(a) Time course of percentage of cells positive for phospho-STAT-5 of CD4+ T cells from C57BL/6 mice cultured in medium alone, with 10 ng ml−1 IL-7 or stimulated with plate-bound anti-CD3 with 10 ng ml−1 IL-7 measured by flow cytometry. (b) Expression of IL-7Rα on CD8+ T cells from C57BL/6 mice cultured in medium or stimulated with plate-bound anti-CD3 with or without 1 ng ml−1 IL-7. IL-7Rα levels were measured by flow cytometry at indicated times and expressed as percentage IL-7Rα-positive cells. (c) Relative expression levels of bcl-2 mRNA in CD4+ T cells from C57BL/6 mice cultured in 1 ng ml−1 IL-7 alone or stimulated with plate-bound anti-CD3+1 ng ml−1 IL-7 measured by quantitative PCR (qPCR). Data are expressed as log2 of the fold change: bcl-2 mRNA expression relative to bcl-2 levels in freshly isolated cells. (d) Relative expression levels of bcl-2 mRNA of CD4+ from C57BL/6 mice T cells stimulated with anti-CD3 after overnight culture in IL-7 measured by qPCR. Data are expressed as expression relative to freshly isolated cells. (e) Loss of STAT5 phosphorylation is reversible after removal from antigen stimulus. Phosphorylation of STAT5 was measured by flow cytometry in CD8+ T cells unstimulated or stimulated with plate-bound anti-CD3 before exposure to IL-7. CD8+ T cells from C57BL/6 mice were cultured either continuously for 4 h in medium or on CD3 antibody-coated plates with or without 1 ng ml−1 IL-7 (filled columns) or were cultured in medium or on CD3 antibody-coated plates for 4 h without IL-7 before being removed from stimulus, and then exposed to 1 ng ml−1 IL-7 for 15 min (open columns). (f) Removal from TCR stimulation does not fully restore IL-7-mediated survival. CD8+ T cells C57BL/6 mice were cultured in medium or on anti-CD3-coated plates for 4 h before being removed from stimulus (indicated as 0 h), and cultured in new medium with or without 1 ng ml−1 IL-7 for up to 24 h. Data represent viable cells per well. (b, e, f) Data are presented as means±s.e.m. of triplicate cultures.
Figure 3
Figure 3. A switch in survival regulation after TCR stimulation.
Effects of CsA and ABT-737 on the survival of OT-1 CD8+ after antigen stimulation were measured. OT-1 CD8+ were stimulated for 22 h with (a) N4 (10−8–10−2 μg ml−1) or (b) V4 (2.6 × 10⁻⁵ to 4 × 10⁻¹ μg ml−1) in the presence of 1 μg ml−1 CsA or 10 μM ABT-737 in medium (left panels) or in 1 ng ml−1 IL-7 (right panels). CsA was added at the start of culture, whereas ABT-737 was added 6 h after beginning of culture. Data show number of viable cells per well. Horizontal dotted lines represent number of live cells without stimulation in medium (lower line) or 1 ng ml−1 IL-7 (upper line). Data are presented as means±s.e.m. of triplicate cultures.
Figure 4
Figure 4. TCR signalling alters Bcl-2 family gene expression.
(a) Relative expression levels of bcl-2, mcl-1, A1 and bcl-xL mRNA measured by quantitative PCR (qPCR) in CD4+ T cells from C57BL/6 mice cultured overnight with 10 ng ml−1 IL-7 before stimulation with plate-bound anti-CD3. Time represents time after exposure to anti-CD3 (top). Protein expression of A1 and Bcl-xL (with actin as the loading control) in CD8+ T cells from C57BL/6 mice cultured for the time point indicated in medium or on CD3 antibody-coated plates with or without 10 ng ml−1 IL-7 (bottom). (b) qPCR analysis of bcl-2, mcl-1, A1 and bcl-xL mRNA in CD4+ T cells from C57BL/6 mice cultured overnight with 10 ng ml−1 IL-7 before culture for 6 h in medium or on plate-bound CD3 antibodies in presence or absence of CsA (2.5 μg ml−1) and presence or absence of 10 ng ml−1 IL-7. (c) Time course of relative expression levels of bcl-2 and A1 mRNA in OT-1 CD8+ T cells pre-cultured with IL-7 overnight before stimulation with cognate N4 peptide (0.01, 10 or 100 ng ml−1) measured by qPCR. Time represents time after exposure to N4 peptide. (a–c) qPCR data are expressed as relative mRNA expression relative to freshly isolated uncultured cells. (d) Western blot analysis of Bim, Bax and Bcl-2 (with actin as the loading control) in CD8+ T cells from C57BL/6 mice cultured in medium or on CD3 antibody-coated plates with or without 10 ng ml−1 IL-7. (e) Effect of loss of Bim and Puma on survival of CD8+ T cells after TCR ligation. CD8+ T cells from C57BL/6-wild type (WT), Bim−/− or Bim/Puma−/− were cultured in medium or on CD3 antibody-coated plates in the presence of 1 μg ml−1 CsA. Total viable cells were measured at indicated time points. Data are presented as means±s.e.m. of triplicate cultures.
Figure 5
Figure 5. IL-2 enhances survival but does not affect inhibition of STAT5 phosphorylation.
OT-1 CD8+ T cells were cultured in medium or stimulated with 0.01 μg ml−1 N4 peptide in the presence or absence of 100 U ml−1 IL-2 and 1 ng ml−1 IL-7. (a, b) IL-2 partially overcomes CSA-mediated inhibition on TCR stimulation. Number of total viable OT-1 CD8+ was measured after culture in the presence or absence of cytokines and with or without 1 μg ml−1 CsA 16 h post stimulation (a) or over a time course up to 400 h post stimulation (b). (c) IL-2 does not affect stimulation-induced inhibition of pSTAT5. Phosphorylation of STAT5 in OT-1 CD8+ T cells was measured by flow cytomerty after incubation for 30 min and 4.5 h with medium or N4 peptide in the presence of IL-2 or IL-7. (a–c) Data are presented as means±s.e.m. of triplicate cultures.
Figure 6
Figure 6. Summary of interactions of TCR and IL-7R signals and inhibitory drugs.
IL-7 mediates cell survival through induction of Bcl-2 (red section). TCR signalling inhibits bcl-2 while upregulating pro-survival molecules bcl-xL and A1 at the same time as pro-apoptotic proteins Bim and Bax are increased (blue). Inhibition of calcineurin or MEK1/2 with CsA or U0126, respectively, blocks TCR-mediated A1 and bcl-xL induction, but has no effect on inhibition of bcl-2.
Figure 7
Figure 7. FK506 enhances loss of antigen-specific T cells after TCR stimulation in vivo.
CTV-labelled OT-I CD8+ T cells were adoptively transferred into wild-type C57BL/6 mice. Commencing the following day, mice were treated with 2.5 mg kg−1 FK506 or saline (control groups) every 6 h until the end of the experiment. Peptide-stimulated groups received 10 μg N4 1 h (a) or 2 h (b, c) after FK506 treatment had begun. (a) Total number of OT-I TCR-tg CD8+ T cells recovered from pooled spleen and lymph node (LN) at 12 or 17 h post immunization. (b) Total number of OT-I TCR-tg CD8+ T cells recovered from pooled spleen and LN at 19 and 43 h post immunization. Geometric means of data points are shown with results of Tukey multiple comparison test from analysis of variance *0.01<P<0.05; **0.001<P<0.01; ***P<0.001; N.S., not significant. (c) Number of OT-I TCR-tg CD8+ T cells per division recovered from spleen and LN 43 h post immunization as determined by CTV dilution. Data are presented as means±s.e.m., n=3.

References

    1. Almeida A. R., Rocha B., Freitas A. A. & Tanchot C.. Homeostasis of T cell numbers: from thymus production to peripheral compartmentalization and the indexation of regulatory T cells. Semin. Immunol. 17, 239–249 (2005). - PubMed
    1. Stockinger B., Kassiotis G. & Bourgeois C.. Homeostasis and T cell regulation. Curr. Opin. Immunol. 16, 775–779 (2004). - PubMed
    1. Boyman O., Purton J. F., Surh C. D. & Sprent J.. Cytokines and T-cell homeostasis. Curr. Opin. Immunol. 19, 320–326 (2007). - PubMed
    1. Marrack P. & Kappler J.. Control of T cell viability. Annu. Rev. Immunol. 22, 765–787 (2004). - PubMed
    1. Polic B., Kunkel D., Scheffold A. & Rajewsky K.. How alpha beta T cells deal with induced TCR alpha ablation. Proc. Natl Acad. Sci. USA 98, 8744–8749 (2001). - PMC - PubMed

Publication types

Substances