

Rapid preconcentration for liquid chromatography-mass spectrometry assay of trace level neuropeptides
- PMID: 23592077
- PMCID: PMC3769462
- DOI: 10.1007/s13361-013-0605-1
Rapid preconcentration for liquid chromatography-mass spectrometry assay of trace level neuropeptides
Abstract
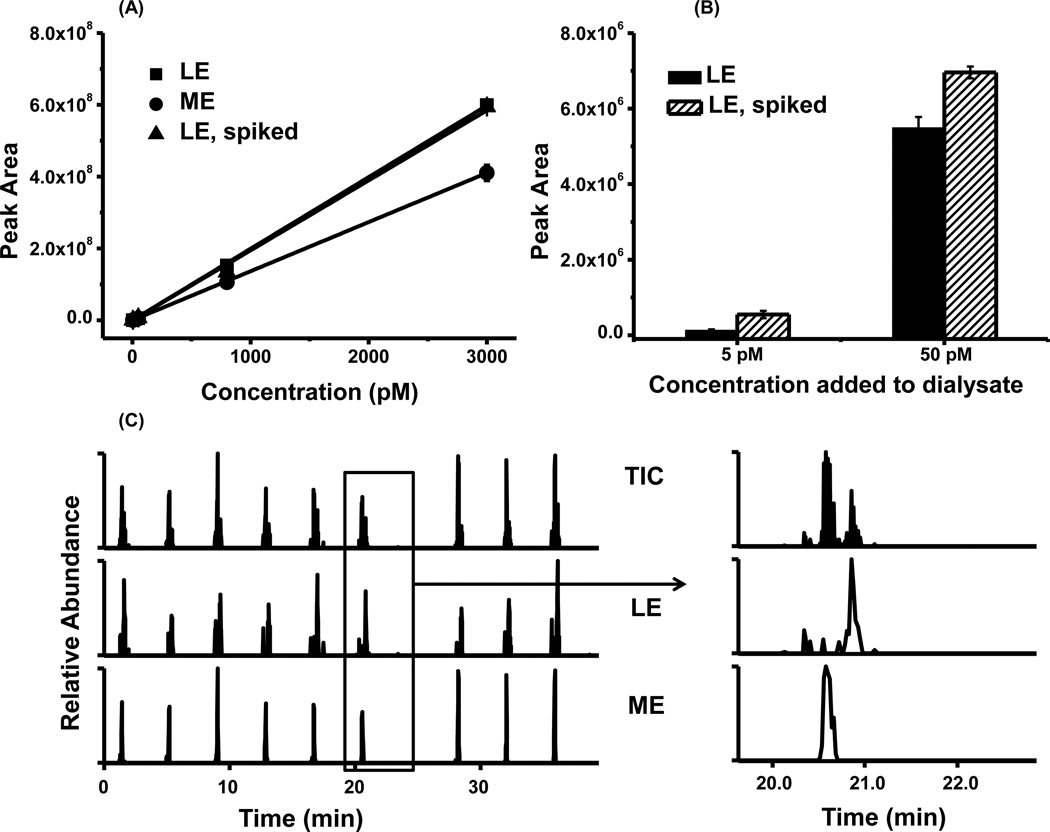
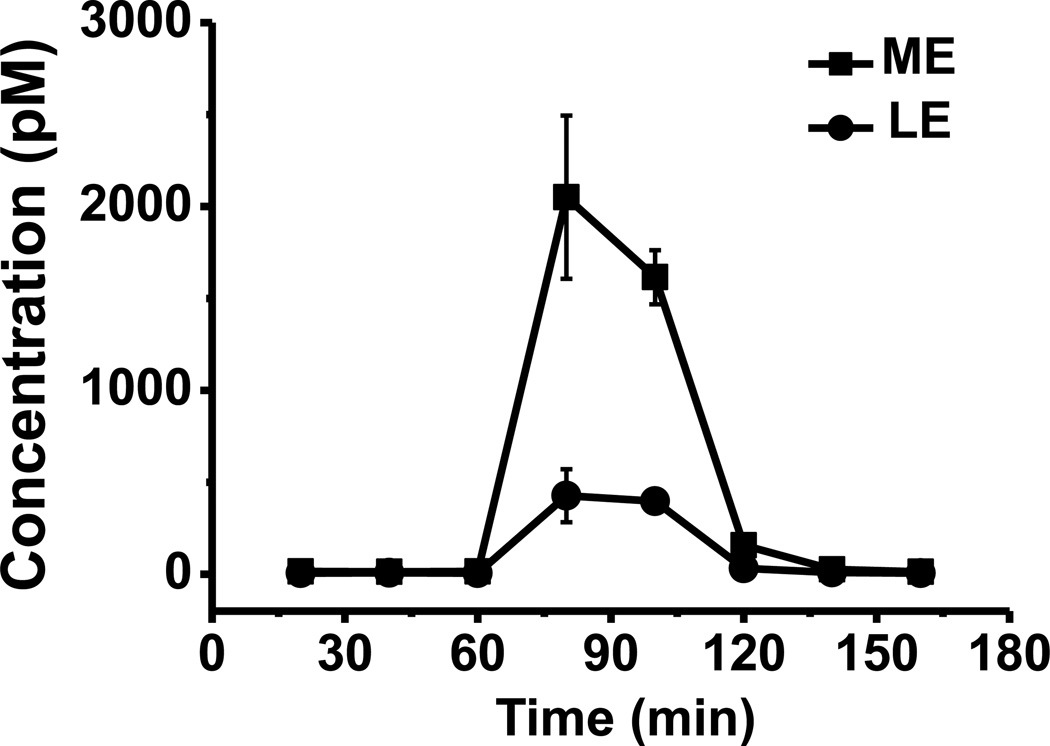
Measurement of neuropeptides in the brain through in vivo microdialysis sampling provides direct correlation between neuropeptide concentration and brain function. Capillary liquid chromatography-multistage mass spectrometry (CLC-MS(n)) has proven to be effective at measuring endogenous neuropeptides in microdialysis samples. In the method, microliter samples are concentrated onto nanoliter volume packed beds before ionization and mass spectrometry analysis. The long times required for extensive preconcentration present a barrier to routine use because of the many samples that must be analyzed and instability of neuropeptides. In this study, we evaluated the capacity of 75 μm inner diameter (i.d.) capillary column packed with 10 μm reversed phase particles for increasing the throughput in CLC-MS(n) based neuropeptide measurement. Coupling a high injection flow rate for fast sample loading/desalting with a low elution flow rate to maintain detection sensitivity, this column has reduced analysis time from ∼30 min to 3.8 min for 5 μL sample, with 3 pM limit of detection (LOD) for enkephalins and 10 pM LOD for dynorphin A1-8 in 5 μL sample. The use of isotope-labeled internal standard lowered peptide signal variation to less than 5 %. This method was validated for in vivo detection of Leu and Met enkephalin with microdialysate collected from rat globus pallidus. The improvement in speed and stability makes CLC-MS(n) measurement of neuropeptides in vivo more practical.
Figures
Similar articles
-
Practical aspects of in vivo detection of neuropeptides by microdialysis coupled off-line to capillary LC with multistage MS.Anal Chem. 2009 Mar 15;81(6):2242-50. doi: 10.1021/ac802391b. Anal Chem. 2009. PMID: 19196160 Free PMC article.
-
Monitoring of met-enkephalin in vivo with 5-min temporal resolution using microdialysis sampling and capillary liquid chromatography with electrochemical detection.J Chromatogr B Biomed Sci Appl. 1997 Dec 19;704(1-2):43-52. doi: 10.1016/s0378-4347(97)00436-2. J Chromatogr B Biomed Sci Appl. 1997. PMID: 9518176
-
Capillary liquid chromatography with MS3 for the determination of enkephalins in microdialysis samples from the striatum of anesthetized and freely-moving rats.J Mass Spectrom. 2005 Feb;40(2):146-53. doi: 10.1002/jms.733. J Mass Spectrom. 2005. PMID: 15706617
-
Challenges for the in vivo quantification of brain neuropeptides using microdialysis sampling and LC-MS.Bioanalysis. 2016 Sep;8(18):1965-85. doi: 10.4155/bio-2016-0119. Epub 2016 Aug 24. Bioanalysis. 2016. PMID: 27554986 Review.
-
The absolute quantification of endogenous levels of brain neuropeptides in vivo using LC-MS/MS.Bioanalysis. 2011 Jun;3(11):1271-85. doi: 10.4155/bio.11.91. Bioanalysis. 2011. PMID: 21649502 Review.
Cited by
-
Investigation of signaling molecules and metabolites found in crustacean hemolymph via in vivo microdialysis using a multifaceted mass spectrometric platform.Electrophoresis. 2016 Apr;37(7-8):1031-8. doi: 10.1002/elps.201500497. Epub 2016 Feb 25. Electrophoresis. 2016. PMID: 26691021 Free PMC article.
-
Characterization of a Multiple-Scan-Rate Voltammetric Waveform for Real-Time Detection of Met-Enkephalin.ACS Chem Neurosci. 2019 Apr 17;10(4):2022-2032. doi: 10.1021/acschemneuro.8b00351. Epub 2019 Jan 12. ACS Chem Neurosci. 2019. PMID: 30571911 Free PMC article.
-
Microdialysis Coupled with LC-MS/MS for In Vivo Neurochemical Monitoring.AAPS J. 2017 Sep;19(5):1284-1293. doi: 10.1208/s12248-017-0114-4. Epub 2017 Jun 28. AAPS J. 2017. PMID: 28660399 Free PMC article.
-
On-Column Dimethylation with Capillary Liquid Chromatography-Tandem Mass Spectrometry for Online Determination of Neuropeptides in Rat Brain Microdialysate.Anal Chem. 2018 Apr 3;90(7):4561-4568. doi: 10.1021/acs.analchem.7b04965. Epub 2018 Mar 22. Anal Chem. 2018. PMID: 29504751 Free PMC article.
-
Temperature-assisted solute focusing with sequential trap/release zones in isocratic and gradient capillary liquid chromatography: Simulation and experiment.J Chromatogr A. 2016 Nov 25;1474:95-108. doi: 10.1016/j.chroma.2016.10.062. Epub 2016 Oct 26. J Chromatogr A. 2016. PMID: 27836226 Free PMC article.
References
-
- Ogren SO, Kuteeva E, Elvander-Tottie E, Hokfelt T. Neuropeptides in Learning and Memory Processes with Focus on Galanin. Eur. J. Pharmacol. 2010;626(1):9–17. - PubMed
-
- Willie JT, Chemelli RM, Sinton CM, Yanagisawa M. To Eat or to Sleep? Orexin in the Regulation of Feeding and Wakefulness. Annu. Rev. Neurosci. 2001;24:429–458. - PubMed
-
- Heilig M. The Npy System in Stress, Anxiety and Depression. Neuropeptides. 2004;38(4):213–224. - PubMed
-
- DiLeone RJ, Georgescu D, Nestler EJ. Lateral Hypothalamic Neuropeptides in Reward and Drug Addiction. Life Sci. 2003;73(6):759–768. - PubMed
-
- Lambert RC, Moos FC, Richard P. Action of Endogenous Oxytocin within the Paraventricular or Supraoptic Nuclei - a Powerful Link in the Regulation of the Bursting Pattern of Oxytocin Neurons During the Milk-Ejection Reflex in Rats. Neuroscience. 1993;57(4):1027–1038. - PubMed
Publication types
MeSH terms
Substances
Grants and funding
LinkOut - more resources
Full Text Sources
Other Literature Sources
Miscellaneous
