

Native SILAC: metabolic labeling of proteins in prototroph microorganisms based on lysine synthesis regulation
- PMID: 23592334
- PMCID: PMC3708181
- DOI: 10.1074/mcp.M112.025742
Native SILAC: metabolic labeling of proteins in prototroph microorganisms based on lysine synthesis regulation
Abstract
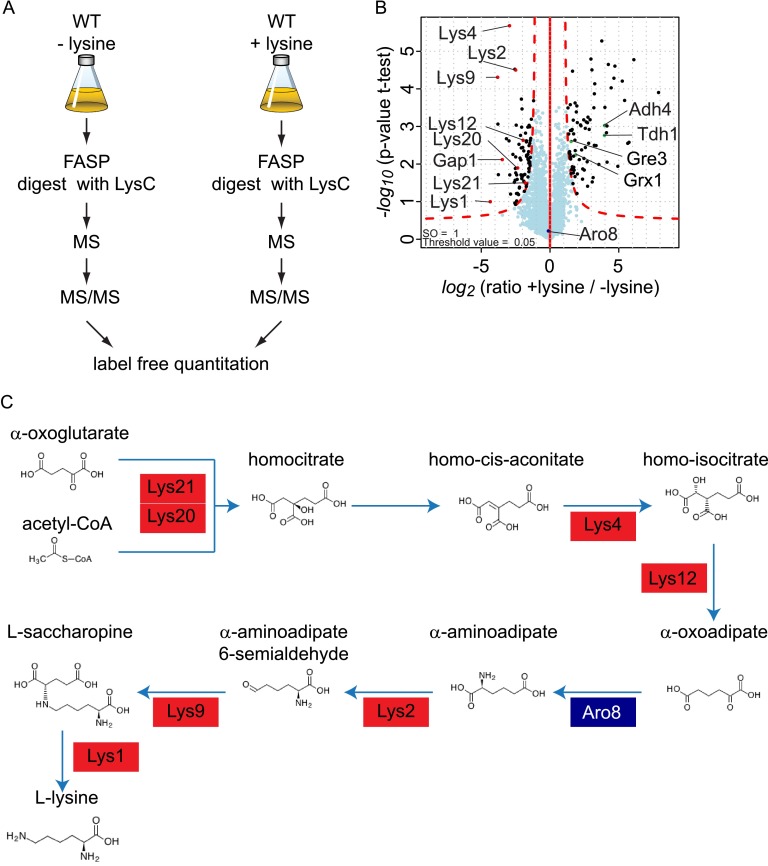
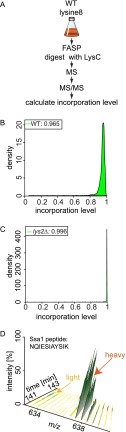
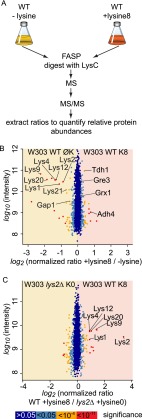
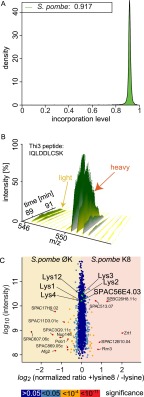
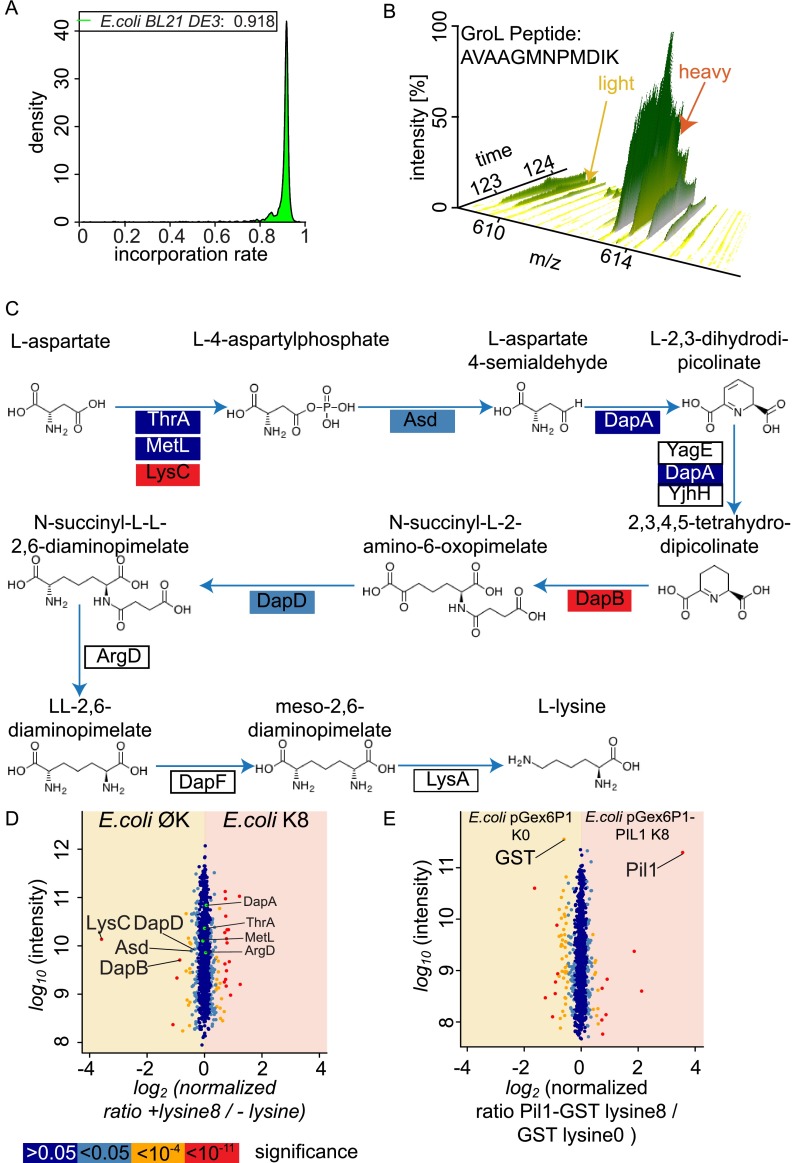
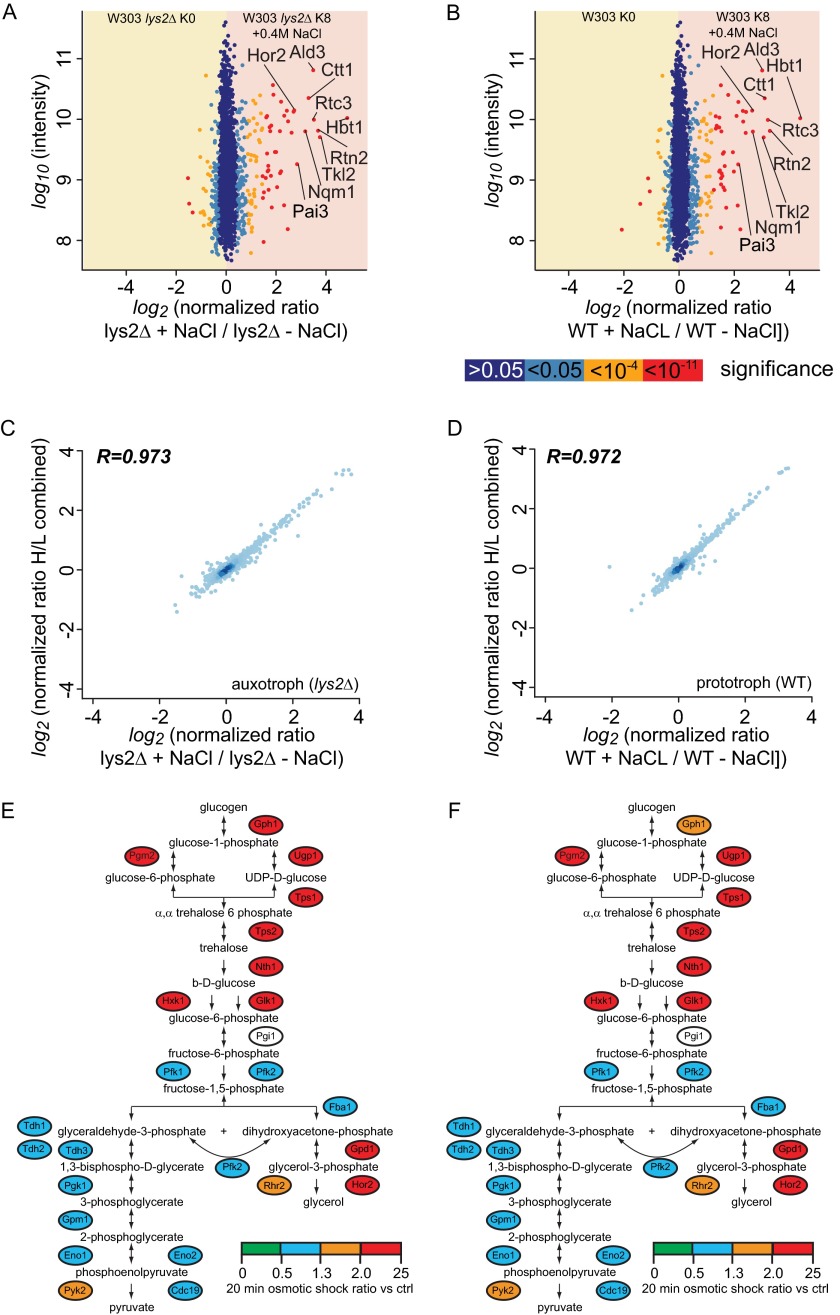
Mass spectrometry (MS)-based quantitative proteomics has matured into a methodology able to detect and quantitate essentially all proteins of model microorganisms, allowing for unprecedented depth in systematic protein analyses. The most accurate quantitation approaches currently require lysine auxotrophic strains, which precludes analysis of most existing mutants, strain collections, or commercially important strains (e.g. those used for brewing or for the biotechnological production of metabolites). Here, we used MS-based proteomics to determine the global response of prototrophic yeast and bacteria to exogenous lysine. Unexpectedly, down-regulation of lysine synthesis in the presence of exogenous lysine is achieved via different mechanisms in different yeast strains. In each case, however, lysine in the medium down-regulates its biosynthesis, allowing for metabolic proteome labeling with heavy-isotope-containing lysine. This strategy of native stable isotope labeling by amino acids in cell culture (nSILAC) overcomes the limitations of previous approaches and can be used for the efficient production of protein standards for absolute SILAC quantitation in model microorganisms. As proof of principle, we have used nSILAC to globally analyze yeast proteome changes during salt stress.
Figures
Similar articles
-
2nSILAC for Quantitative Proteomics of Prototrophic Baker's Yeast.Methods Mol Biol. 2021;2228:253-270. doi: 10.1007/978-1-0716-1024-4_18. Methods Mol Biol. 2021. PMID: 33950496
-
Stable Isotope Labeling by Amino Acids in Cell Culture (SILAC) Technology in Fission Yeast.Cold Spring Harb Protoc. 2017 Jun 1;2017(6):pdb.top079814. doi: 10.1101/pdb.top079814. Cold Spring Harb Protoc. 2017. PMID: 28572211
-
Construction, Growth, and Harvesting of Fission Yeast Stable Isotope Labeling by Amino Acids in Cell Culture (SILAC) Strains.Cold Spring Harb Protoc. 2017 Jun 1;2017(6):pdb.prot091678. doi: 10.1101/pdb.prot091678. Cold Spring Harb Protoc. 2017. PMID: 28572184
-
Stable Isotope Labeling by Amino Acids in Cell Culture (SILAC) for Quantitative Proteomics.Adv Exp Med Biol. 2019;1140:531-539. doi: 10.1007/978-3-030-15950-4_31. Adv Exp Med Biol. 2019. PMID: 31347069 Review.
-
Stable isotope labeling by amino acids in cell culture (SILAC) for quantitative proteomics.Adv Exp Med Biol. 2014;806:93-106. doi: 10.1007/978-3-319-06068-2_5. Adv Exp Med Biol. 2014. PMID: 24952180 Review.
Cited by
-
A lysosomal biogenesis map reveals the cargo spectrum of yeast vacuolar protein targeting pathways.J Cell Biol. 2022 Apr 4;221(4):e202107148. doi: 10.1083/jcb.202107148. Epub 2022 Feb 17. J Cell Biol. 2022. PMID: 35175277 Free PMC article.
-
Prolyl dihydroxylation of unassembled uS12/Rps23 regulates fungal hypoxic adaptation.Elife. 2017 Oct 30;6:e28563. doi: 10.7554/eLife.28563. Elife. 2017. PMID: 29083304 Free PMC article.
-
Heavy Sugar and Heavy Water Create Tunable Intact Protein Mass Increases for Quantitative Mass Spectrometry in Any Feed and Organism.Anal Chem. 2016 Nov 15;88(22):11139-11146. doi: 10.1021/acs.analchem.6b03234. Epub 2016 Oct 28. Anal Chem. 2016. PMID: 27744677 Free PMC article.
-
A role for eisosomes in maintenance of plasma membrane phosphoinositide levels.Mol Biol Cell. 2014 Sep 15;25(18):2797-806. doi: 10.1091/mbc.E13-11-0639. Epub 2014 Jul 23. Mol Biol Cell. 2014. PMID: 25057013 Free PMC article.
-
Stromal cell-derived factor 2 is critical for Hsp90-dependent eNOS activation.Sci Signal. 2015 Aug 18;8(390):ra81. doi: 10.1126/scisignal.aaa2819. Sci Signal. 2015. PMID: 26286023 Free PMC article.
References
-
- Bensimon A., Heck A. J., Aebersold R. (2012) Mass spectrometry-based proteomics and network biology. Ann. Rev. Biochem. 81, 379–405 - PubMed
-
- Yates J. R., Ruse C. I., Nakorchevsky A. (2009) Proteomics by mass spectrometry: approaches, advances, and applications. Ann. Rev. Biomed. Eng. 11, 49–79 - PubMed
-
- Bantscheff M., Lemeer S., Savitski M. M., Kuster B. (2012) Quantitative mass spectrometry in proteomics: critical review update from 2007 to the present. Anal. Bioanal. Chem. 404, 939–65 - PubMed
-
- Ong S. E., Blagoev B., Kratchmarova I., Kristensen D. B., Steen H., Pandey A., Mann M. (2002) Stable isotope labeling by amino acids in cell culture, SILAC, as a simple and accurate approach to expression proteomics. Mol. Cell. Proteomics 1, 376–86 - PubMed
Publication types
MeSH terms
Substances
Grants and funding
LinkOut - more resources
Full Text Sources
Other Literature Sources
Molecular Biology Databases
Research Materials
