. 2013 May 31;288(22):15581-9.
doi: 10.1074/jbc.M112.435396. Epub 2013 Apr 16.

Facilitated hyperpolarization signaling in vascular smooth muscle-overexpressing TRIC-A channels

Affiliations

Facilitated hyperpolarization signaling in vascular smooth muscle-overexpressing TRIC-A channels

Shengchen Tao et al. J Biol Chem. .

Abstract

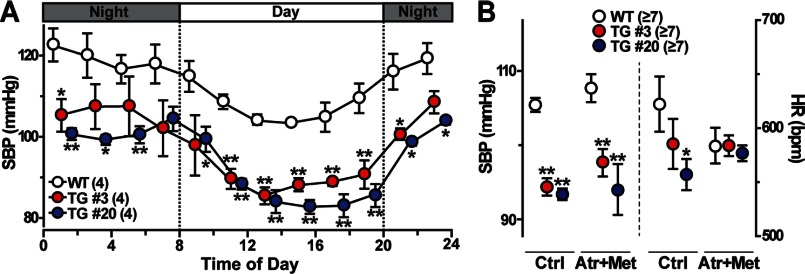
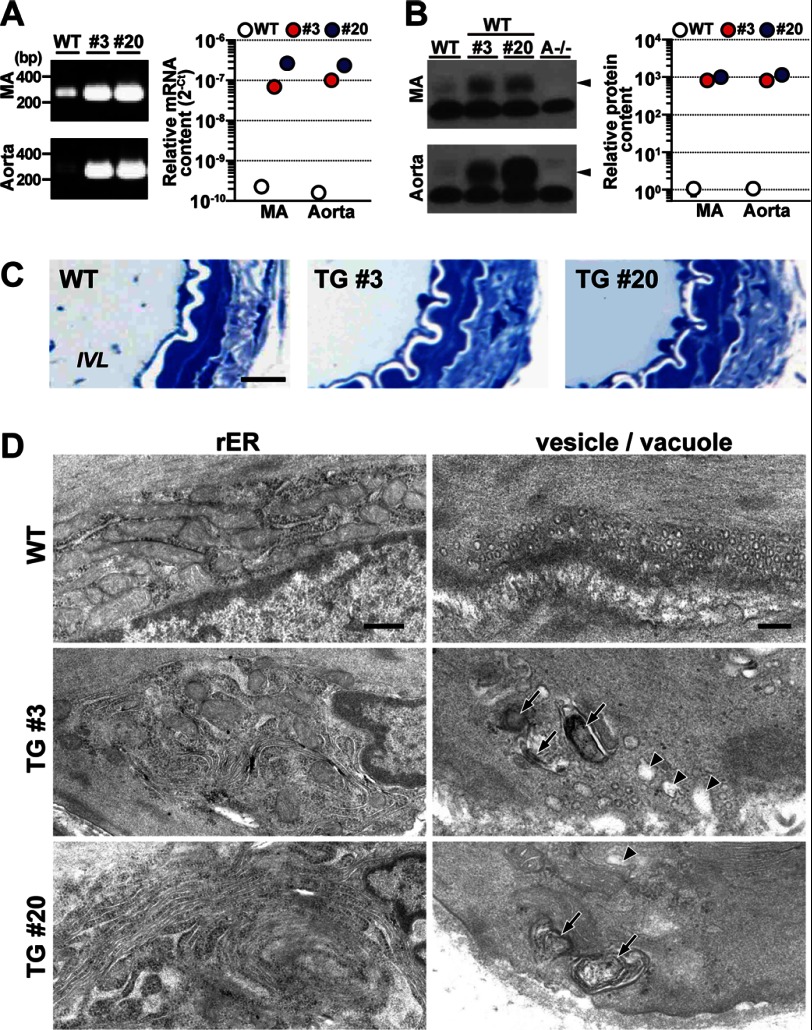
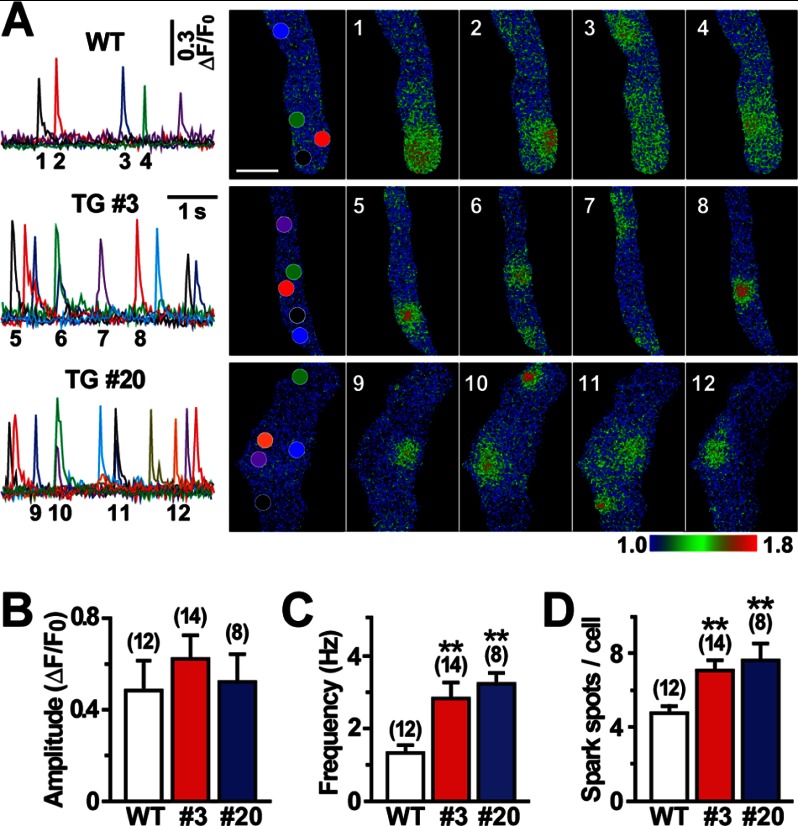
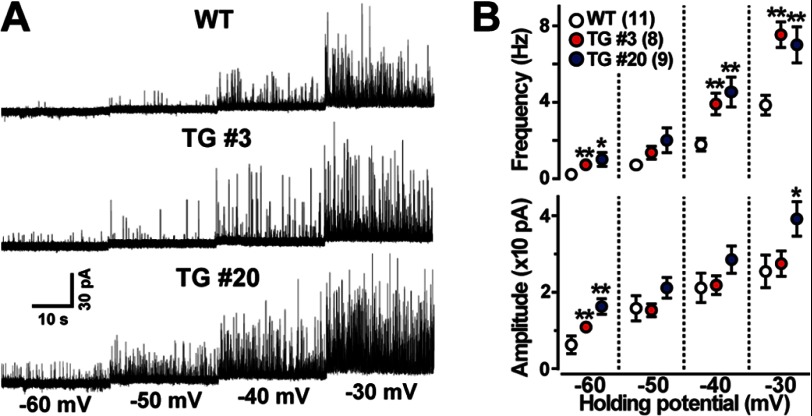
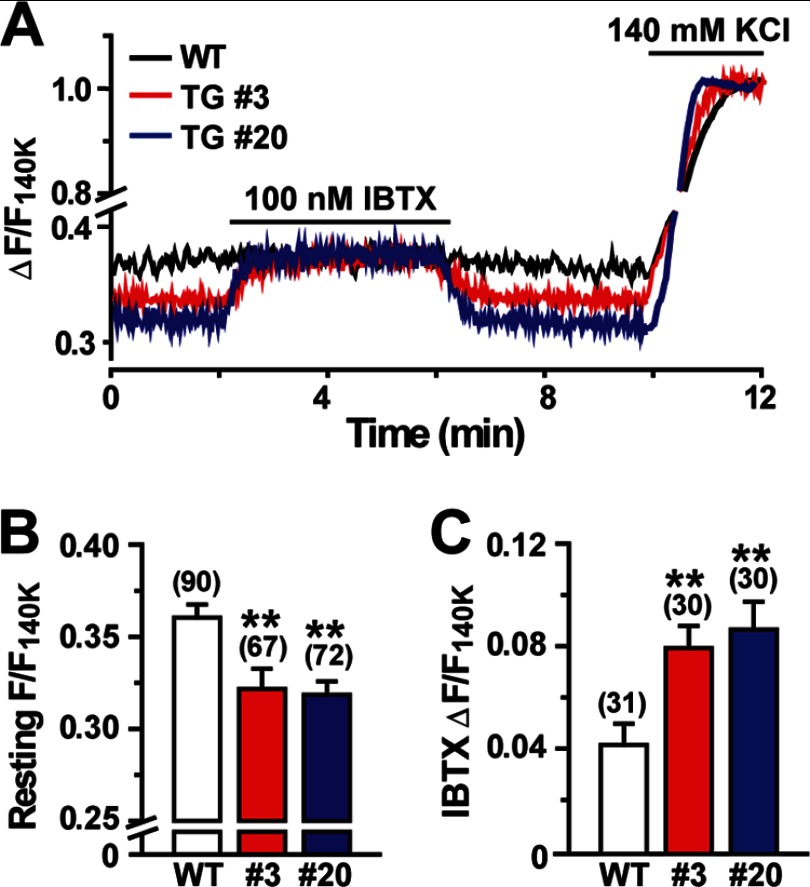
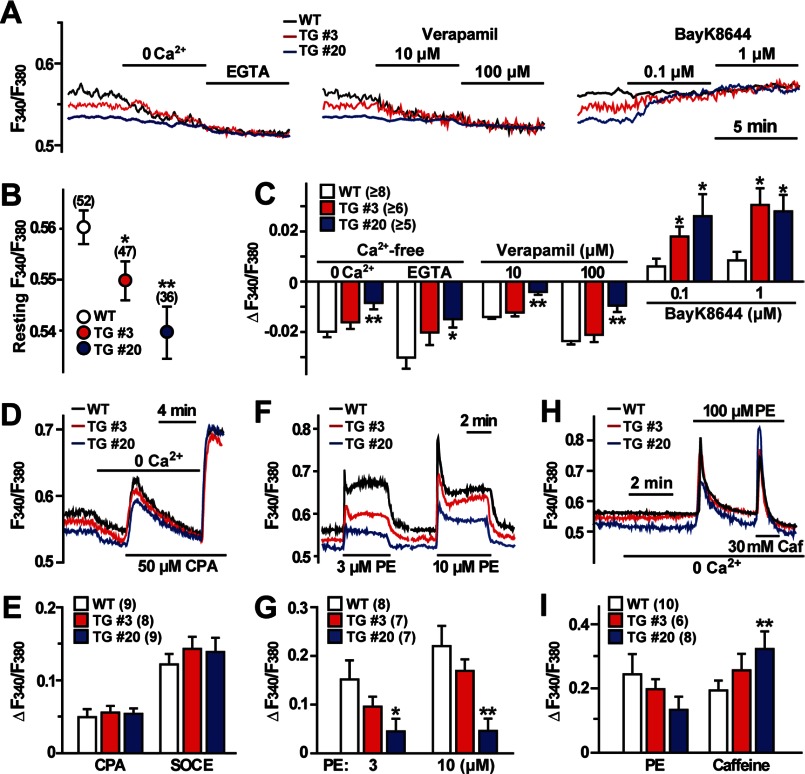
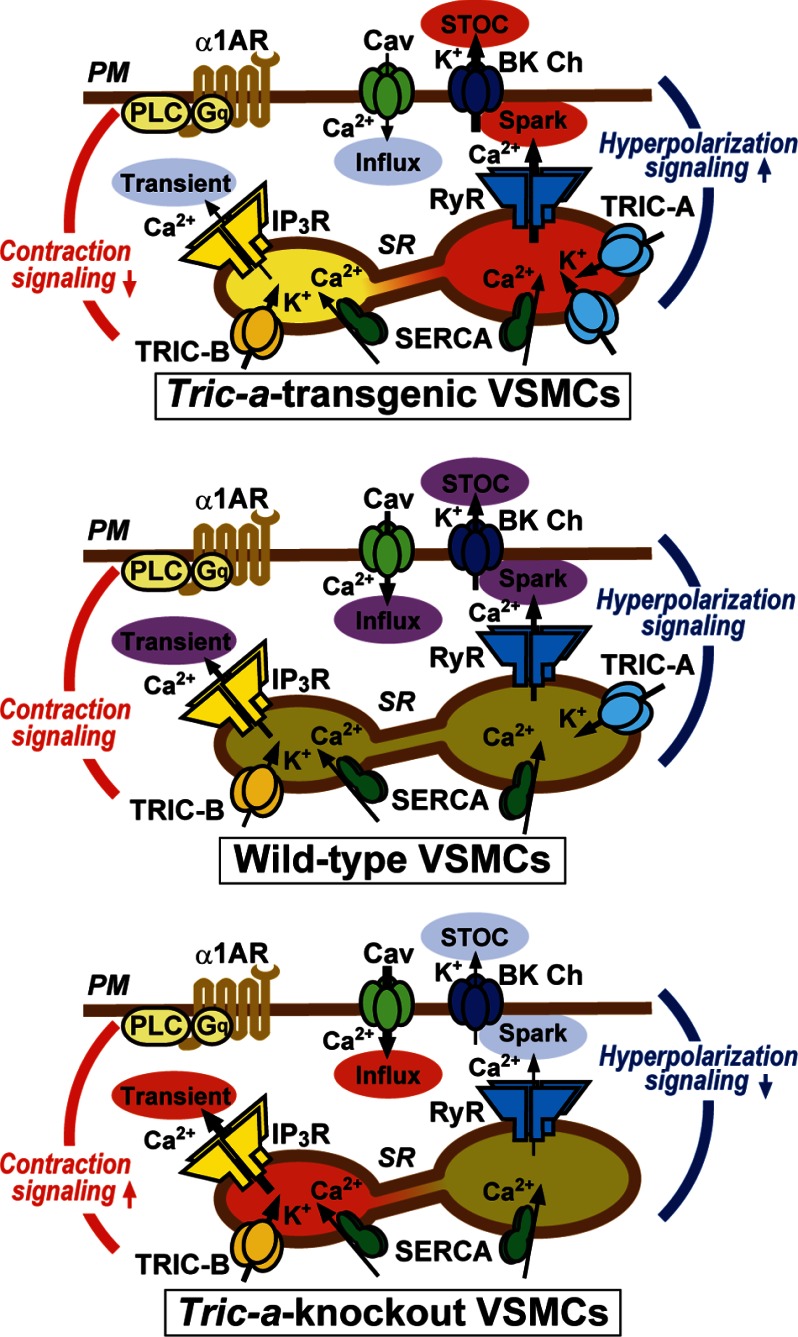
The TRIC channel subtypes, namely TRIC-A and TRIC-B, are intracellular monovalent cation-specific channels and likely mediate counterion movements to support efficient Ca(2+) release from the sarco/endoplasmic reticulum. Vascular smooth muscle cells (VSMCs) contain both TRIC subtypes and two Ca(2+) release mechanisms; incidental opening of ryanodine receptors (RyRs) generates local Ca(2+) sparks to induce hyperpolarization and relaxation, whereas agonist-induced activation of inositol trisphosphate receptors produces global Ca(2+) transients causing contraction. Tric-a knock-out mice develop hypertension due to insufficient RyR-mediated Ca(2+) sparks in VSMCs. Here we describe transgenic mice overexpressing TRIC-A channels under the control of a smooth muscle cell-specific promoter. The transgenic mice developed congenital hypotension. In Tric-a-overexpressing VSMCs from the transgenic mice, the resting membrane potential decreased because RyR-mediated Ca(2+) sparks were facilitated and cell surface Ca(2+)-dependent K(+) channels were hyperactivated. Under such hyperpolarized conditions, L-type Ca(2+) channels were inactivated, and thus, the resting intracellular Ca(2+) levels were reduced in Tric-a-overexpressing VSMCs. Moreover, Tric-a overexpression impaired inositol trisphosphate-sensitive stores to diminish agonist-induced Ca(2+) signaling in VSMCs. These altered features likely reduced vascular tonus leading to the hypotensive phenotype. Our Tric-a-transgenic mice together with Tric-a knock-out mice indicate that TRIC-A channel density in VSMCs is responsible for controlling basal blood pressure at the whole-animal level.

Keywords: Blood Pressure; Ca2+ Spark; Ca2+-dependent K+ Channel; Calcium Imaging; Calcium Intracellular Release; Inositol 1,4,5-Trisphosphate receptor; Potassium Channels; Ryanodine Receptor; TRIC Channel; Vascular Smooth Muscle Cells.


Figures

FIGURE 1.
FIGURE 1.
Hypotension in SMC-specific Tric-a-transgenic mice. A, telemetric blood pressure monitoring is shown. Circadian fluctuations in systolic blood pressure (SBP) were monitored, and the data were averaged over each 2-h interval during a 24-h period. B, systolic blood pressure and heart rate (HR) monitoring by tail-cuff plethysmography during the daytime. After the base-line monitoring (Ctrl), autonomic controls were blocked using an intraperitoneal injection of the muscarinic antagonist atropine (Atr, 4 mg/kg) and the β-antagonist metoprolol (Met, 4 mg/kg). Upon drug application, HR was quickly attenuated, but systolic blood pressure changed in a time-dependent manner (see supplemental Fig. S1E). The data represent the mean ± S.E., and the numbers of mice examined are shown in parentheses. Significant differences between the genotypes are marked with asterisks (*, p < 0.05; **, p < 0.01 by Student's t test).
FIGURE 2.
FIGURE 2.
Irregular membranous features of Tric-a-overexpressing VSMCs. A, shown is quantitative detection of Tric-a mRNA in mesenteric artery (MA) and aorta. Total tissue RNA preparations from transgenic (#3 and #20) and wild-type mice (n = 3) were examined by quantitative RT-PCR using a primer set for amplifying Tric-a mRNA from both the endogenous gene and the transgene. The cDNA fragments amplified by 33 PCR cycles were analyzed by agarose gel electrophoresis. RT-PCR data obtained are summarized in the right graph. The cycle threshold (Ct) indicates the cycle number at which the amount of amplified cDNA reached a fixed threshold in each reaction. B, Western blot analysis of TRIC-A protein in MA and aorta is shown. The vessels dissected from the Tric-a-transgenic (#3 and #20), Tric-a knock-out (A−/−), and wild-type mice were homogenized to prepare total cell lysates (post-nuclear fractions). Wild-type lysates (10 μg of protein) with or without lysates from the transgenic mice (0.1 μg) were analyzed with an antibody against the TRIC-A protein. Lysates from the Tric-a knock-out mice (10 μg) served as negative controls. Arrowheads indicate TRIC-A protein bands. Immunoreactive signals were digitalized and statistically analyzed to estimate the relative contents of TRIC-A protein in the different genotypes as shown in the right graph. C, normal histology in MA from Tric-a-transgenic mice is shown. Mesenteric artery preparations were incubated in a Ca2+-free solution for ∼20 min and then fixed for anatomical analysis. Thin sections were stained with toluidine blue for photomicroscopic observation. IVL, intravascular lumen. Scale bar, 10 μm. D, shown is formation of stacked ER elements and vacuoles in Tric-a-overexpressing VSMCs. Rough ER (rER) elements at the cell-interior portion (left panels: scale bar, 500 nm) are shown. Stacks of rough ER elements were frequently observed in VSMCs from transgenic mice (∼27% of TgA3 cells and 80% of TgA20 cells), whereas such stacked ER was not detected in wild-type controls (n = 45–97 cells from 3–6 mice in each genotype). Surface vesicles and vacuoles were located at the cell periphery (right panels: scale bar, 200 nm). TRIC-A overexpression appeared to promote the formation of large-sized vacuoles containing myelin figures (arrows) or no electron-dense materials (arrowheads). Such vacuoles were frequently observed in >50% of VSMCs from TgA3 and TgA20 mice but only detected in 9.5% of wild-type VSMCs (n = 53–89 cells from 6 mice in each genotype).
FIGURE 3.
FIGURE 3.
Facilitated Ca2+ sparks in Tric-a-overexpressing VSMCs. Single VSMCs were prepared from mesenteric arteries and loaded with Fluo-4 for total internal reflection fluorescence imaging. A, shown are representative Ca2+-spark monitoring data in a normal bathing solution. The fluorescence intensity was normalized to the base-line intensity to yield the relative intensity (F/F0), and time courses of the intensity changes at the subcellular hotspots (see colored circles in the F0 cell images) are illustrated in the traces (scale bar, 5 μm). The F/F0 images were color-coded as indicated by the bar to prepare the Ca2+-spark images at the numbered time points. The data on spark amplitude (B), frequency (C), and spot number (D) are summarized for each genotype. Significant differences between the genotypes are indicated by asterisks (**, p < 0.01 by t test).
FIGURE 4.
FIGURE 4.
Facilitated STOCs in Tric-a-overexpressing VSMCs. The membrane potential of single VSMCs was controlled by the whole-cell patch clamp technique using the STOC pipette to monitor membrane currents. Representative STOC recording data are illustrated in A. The data for STOC frequency and amplitude are summarized in B. The data represent the mean ± S.E., and the numbers of cells examined from at least three mice are shown in parentheses. Significant differences between the genotypes are indicated by asterisks (*, p < 0.05; **, p < 0.01 by t test).
FIGURE 5.
FIGURE 5.
Decreased resting membrane potential in Tric-a-overexpressing VSMCs. Single VSMCs were examined by confocal microscopic imaging using the voltage-dependent dye oxonol VI. Cellular fluorescence intensities were normalized to the maximum value to yield the fractional intensity (F/F140K). A, shown are representative imaging data. B, shown are the summarized data of the resting intensity. C, shown are the summarized data of the intensity shift by iberiotoxin (IBTX). The data represent the mean ± S.E., and the numbers of cells examined from at least three mice are shown in parentheses. Significant differences between the genotypes are indicated by asterisks (**, p < 0.01 by t test).
FIGURE 6.
FIGURE 6.
Abnormal Ca2+ handling in Tric-a-overexpressing VSMCs. VSMC segments were examined by Fura-PE3 Ca2+ imaging. The change in [Ca2+]i was expressed as ratio of the fluorescence intensity (F340/F380). A–C, shown is decreased resting [Ca2+]i in Tric-a-overexpressing VSMCs. A, representative traces under normal conditions and responses to Ca2+ removal and L-type Ca2+ channel modulators are illustrated. Resting [Ca2+]i data are summarized in B, and [Ca2+]i responses are analyzed in C. D and E, normal Ca2+ store contents in Tric-a-overexpressing VSMCs are shown. Representative CPA-induced responses are shown in D, and the data are summarized in E. F and G, impaired IP3-mediated Ca2+ release in Tric-a-overexpressing VSMCs . Representative PE-induced responses are shown in F, and the data are summarized in G. H and I, altered Ca2+ distribution to store compartments in Tric-a-overexpressing VSMCs are shown. Sequential responses to PE and caffeine (Caf) under Ca2+-free conditions are shown in (H), and the data are summarized in (I). The data represent the mean ± S.E., and the numbers of mice examined are shown in parentheses. Significant differences between the genotypes are indicated by asterisks (*, p < 0.05; **, p < 0.01 by t test).
FIGURE 7.
FIGURE 7.
Facilitated hyperpolarization signaling in Tric-a-overexpressing VSMCs. Tric-a overexpression appears to activate Ca2+ spark generation directly, thus facilitating the hyperpolarization signaling produced by functional coupling between RyRs and BK channels (BK Ch) and decreasing the resting membrane potential in VSMCs. In this situation, L-type Ca2+ channels (Cav) are inactivated in the plasma membrane (PM), and resting [Ca2+]i is decreased to develop insufficient spontaneous tonus in resistance arteries and hypotension in the transgenic mice. Upon sympathetic stimulation, the α1-adrenoreceptor (α1AR), trimeric GTP-binding protein Gq, and phospholipase C (PLC) are coordinately activated to trigger IP3R-mediated Ca2+ release. In Tric-a-overexpressing VSMCs, IP3R-mediated Ca2+ release is unexpectedly impaired. The poor agonist-induced Ca2+ release may be due to partial depletion of IP3-sensitive stores or TRIC-A-mediated inhibition of IP3Rs. In contrast, hyperpolarization signaling is impaired, and IP3-sensitive stores are likely overloaded in Tric-a knock-out VSMCs (15). SERCA, sarco(endo)plasmic reticulum calcium ATPase.

References

    1. Bezprozvanny I., Ehrlich B. E. (1995) The inositol 1,4,5-trisphosphate (InsP3) receptor. J. Membr. Biol. 145, 205–216 - PubMed
    1. Meissner G. (1994) Ryanodine receptor/Ca2+ release channels and their regulation by endogenous effectors. Annu. Rev. Physiol. 56, 485–508 - PubMed
    1. Berridge M. J. (2008) Smooth muscle cell calcium activation mechanisms. J. Physiol. 586, 5047–5061 - PMC - PubMed
    1. Wellman G. C., Nelson M. T. (2003) Signaling between SR and plasmalemma in smooth muscle. Sparks and the activation of Ca2+-sensitive ion channels. Cell Calcium 34, 211–229 - PubMed
    1. Somlyo A. V., Gonzalez-Serratos H. G., Shuman H., McClellan G., Somlyo A. P. (1981) Calcium release and ionic changes in the sarcoplasmic reticulum of tetanized muscle. An electron-probe study. J. Cell Biol. 90, 577–594 - PMC - PubMed

Publication types

LinkOut - more resources