. 2013 Apr 1;27(7):767-77.
doi: 10.1101/gad.216200.113.

In vivo live imaging of RNA polymerase II transcription factories in primary cells

Affiliations

In vivo live imaging of RNA polymerase II transcription factories in primary cells

Alireza Ghamari et al. Genes Dev. .

Erratum in

  • Genes Dev. 2013 Jun 15;27(12):1434
  • Genes Dev. 2013 May 15;27(10):1216

Abstract

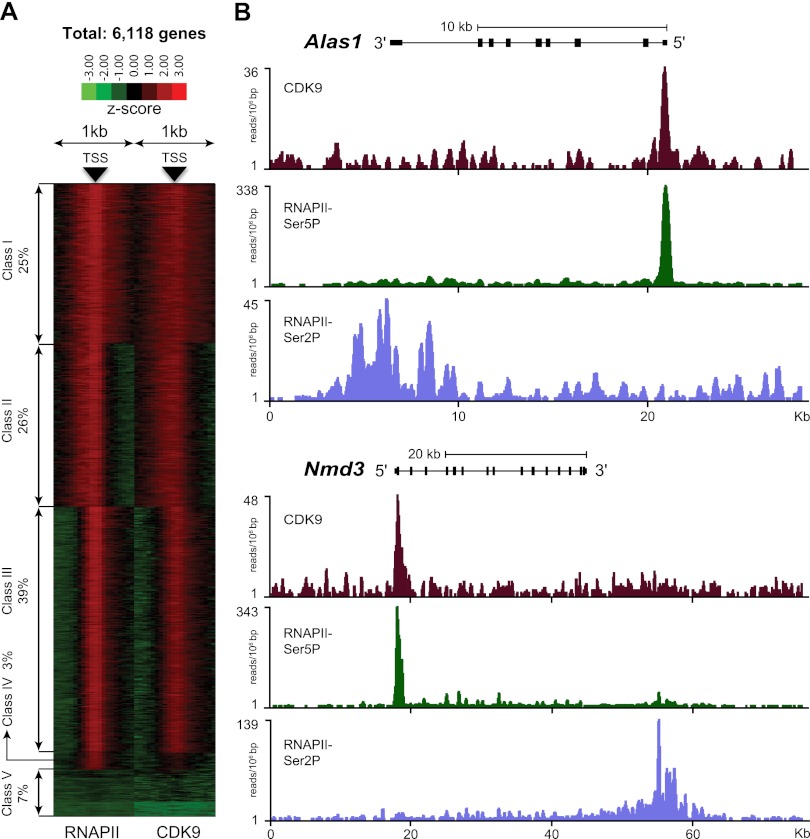
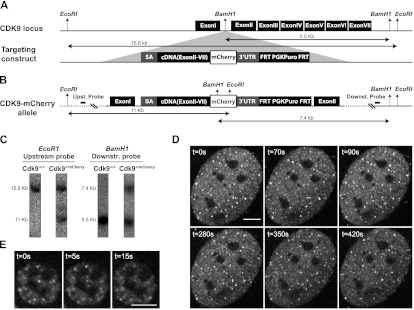
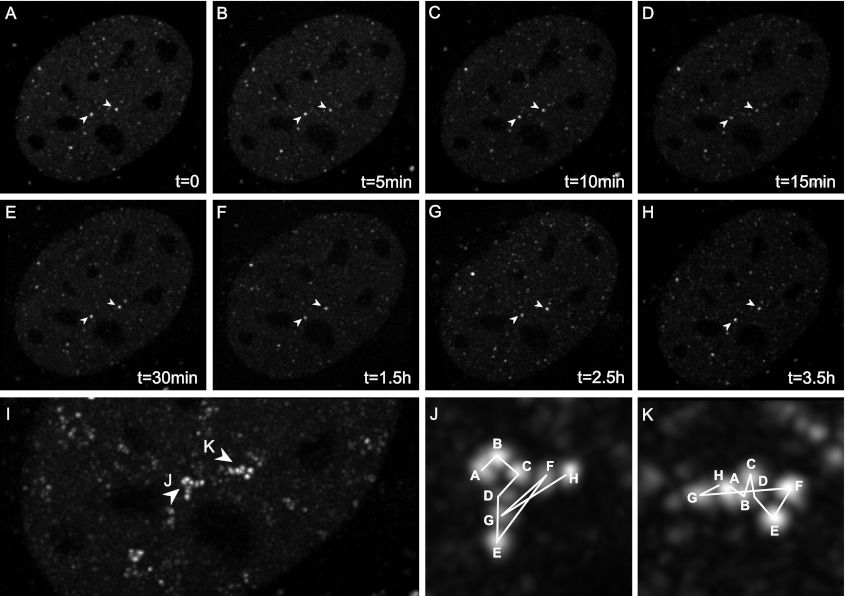
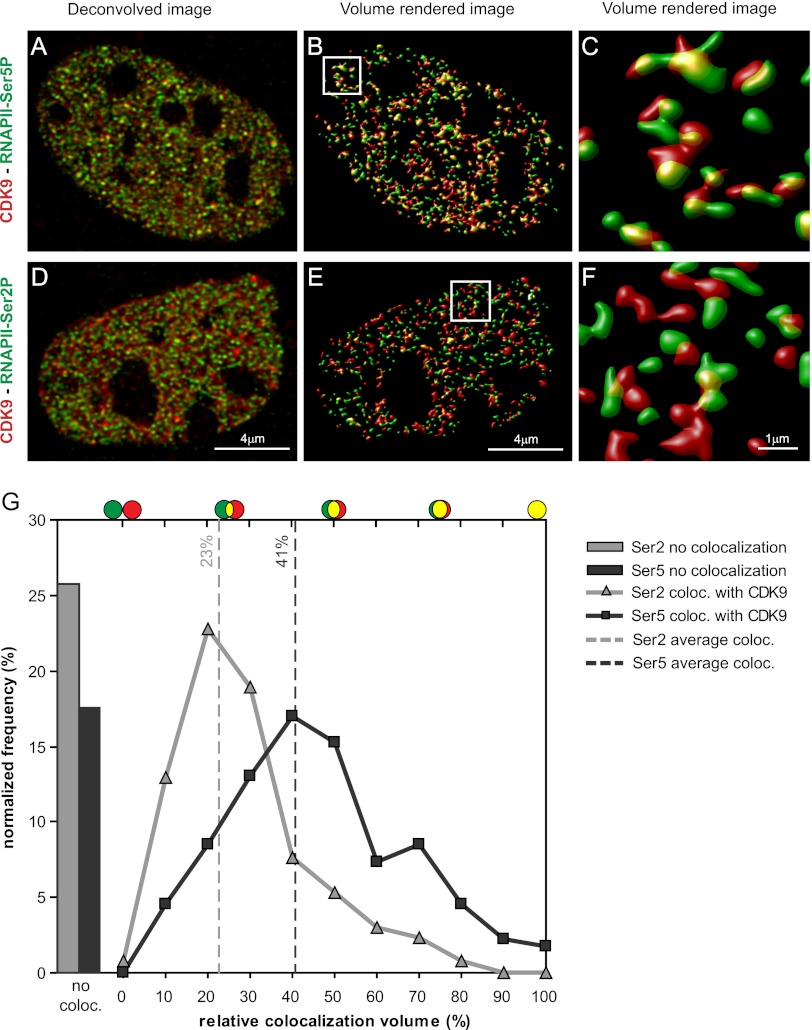
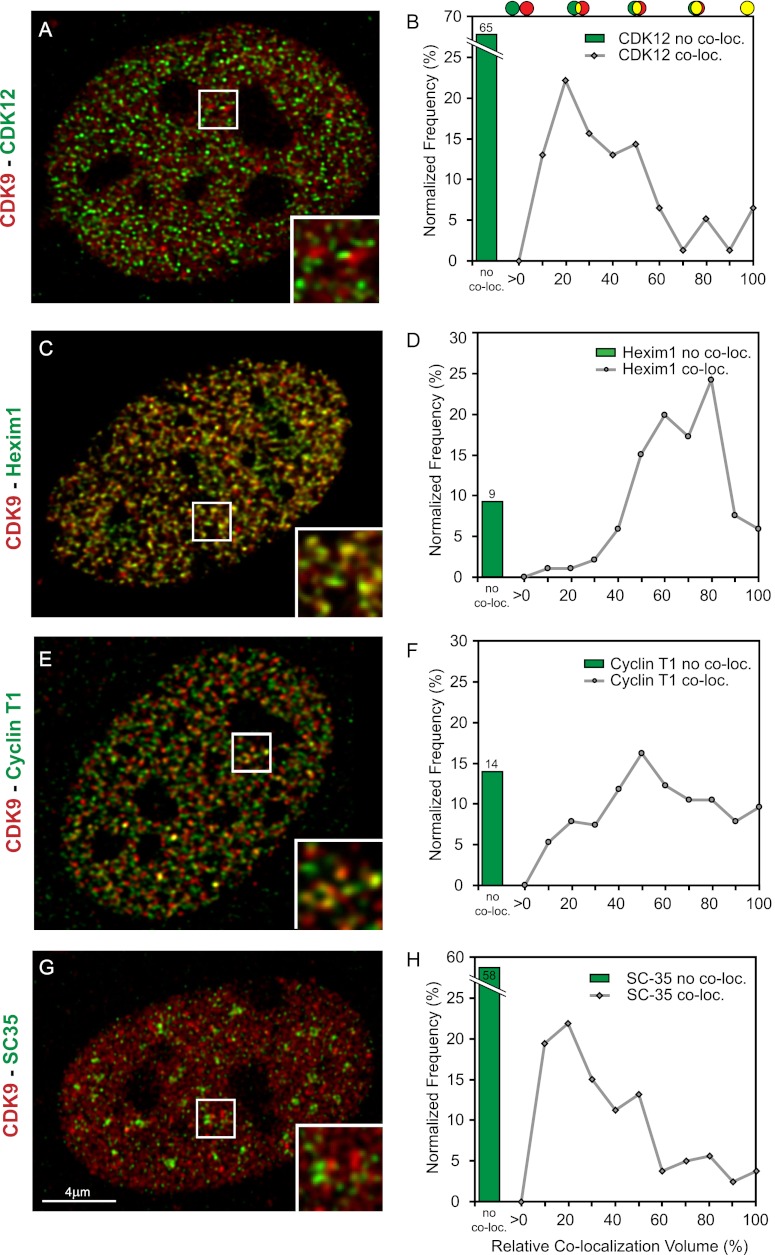
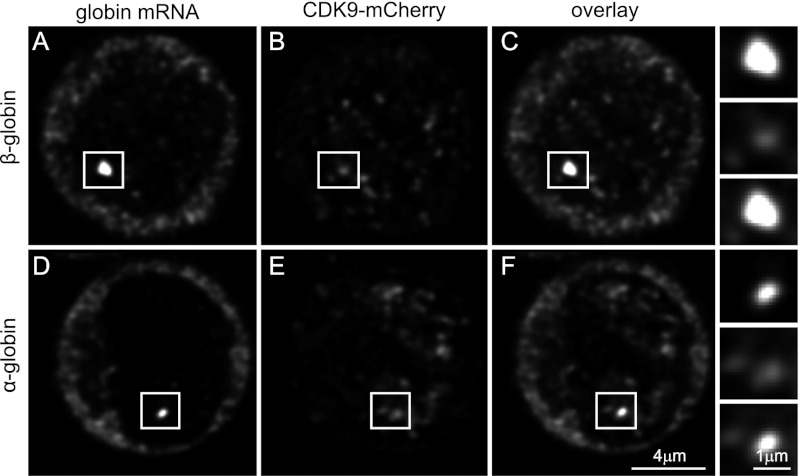
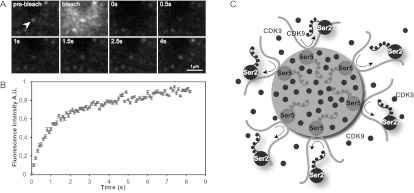
Transcription steps are marked by different modifications of the C-terminal domain of RNA polymerase II (RNAPII). Phosphorylation of Ser5 and Ser7 by cyclin-dependent kinase 7 (CDK7) as part of TFIIH marks initiation, whereas phosphorylation of Ser2 by CDK9 marks elongation. These processes are thought to take place in localized transcription foci in the nucleus, known as "transcription factories," but it has been argued that the observed clusters/foci are mere fixation or labeling artifacts. We show that transcription factories exist in living cells as distinct foci by live-imaging fluorescently labeled CDK9, a kinase known to associate with active RNAPII. These foci were observed in different cell types derived from CDK9-mCherry knock-in mice. We show that these foci are very stable while highly dynamic in exchanging CDK9. Chromatin immunoprecipitation (ChIP) coupled with deep sequencing (ChIP-seq) data show that the genome-wide binding sites of CDK9 and initiating RNAPII overlap on transcribed genes. Immunostaining shows that CDK9-mCherry foci colocalize with RNAPII-Ser5P, much less with RNAPII-Ser2P, and not with CDK12 (a kinase reported to be involved in the Ser2 phosphorylation) or with splicing factor SC35. In conclusion, transcription factories exist in living cells, and initiation and elongation of transcripts takes place in different nuclear compartments.


Figures

Figure 1.
Figure 1.
CDK9 and RNAPII co-occupy the promoter-proximal region of transcribed genes. (A) Clustering of RNAPII (left) and CDK9 (right) binding in a window of ±1 kb relative to the transcription start site (TSS) of 6618 expressed genes in erythroid cells. This analysis shows five different classes of expressed genes. In 90% of the genes (classes I, II, and III), the pattern of binding of the two proteins relative to the TSS is very similar. In 3% of genes (class IV), a high level of RNAPII but a low level of CDK9 was detected. Seven percent of genes (class V) did not show significant binding of RNAPII and CDK9. (B) Binding of CDK9, RNAPII-Ser5P, and RNAPII-Ser2P on two representative genes. CDK9 and RNAPII-Ser5P co-occupy the promoter-proximal region, whereas RNAPII-Ser2P is enriched in the 3′ ends of genes.
Figure 2.
Figure 2.
Generation of a CDK9-mCherry knock-in mouse and imaging of primary cells. (A) The CDK9 locus was targeted with a construct consisting of upstream and downstream homology arms flanking a DNA fragment that has a splice acceptor, cDNA (exon II–VII), fused in-frame to mCherry, followed by a stop codon, the 3′ untranslated region (UTR( of the Cdk9 gene, and the puromycin selection marker flanked by FRT sequences. The insert was recombined into a unique BamH1 site in the intron I of Cdk9 gene. (B) The targeted (CDK9-mCherry) allele is shown with restriction sites and the corresponding fragment sizes. Probes for Southern blot analysis are located outside the targeting arms (distances are not scaled). (WT) Wild type; (Puro) puromycin. (C) Southern blot of a correctly targeted clone. Upstream and downstream probes were hybridized with DNA digested with EcoRI and BamH1, respectively. Unprocessed in vivo images of primary MEFs (D) and fetal liver cells (E) isolated from a knock-in CDK9-mCherry mouse. The real-time unprocessed movies are shown in Supplemental Movies S2 and S3. Bar, 5 μm.
Figure 3.
Figure 3.
Long time-lapse live imaging shows stable CDK9-mCherry foci. Stabilized and deconvolved image projection of 3D stacks of a CDK9-mCherry MEF cell. (AH) Various time frames show CDK9-mCherry foci. (Arrowheads) Example of two large foci that remain stable during a period of 3.5 h. (I) Overlay of all time frames shown in AH. (J,K) Movement of two large CDK9-mCherry foci positioned at the arrowheads as seen in AH over a period of 3.5 h.
Figure 4.
Figure 4.
CDK9 foci colocalize with RNAPII-Ser5P but not with RNAPII-Ser2P. Deconvolved optical slice of a CDK9-mCherry MEF cell immunostained for RNAPII-Ser5P (A) or RNAPII-Ser2P (D). Volume-rendered images of A (B) and D (E) and zoom in C and F of insets of B and E. (G) Normalized frequency distribution of all of the colocalizing objects of RNAPII-Ser2P (gray line) and RNAPII-Ser5P (black line) with CDK9-mCherry. Bars show the percentage of noncolocalized staining. Bar, 4 μm.
Figure 5.
Figure 5.
CDK9 foci colocalize with Hexim1 and cyclin T1 but not with CDK12 and SC35. Deconvolved optical slice of CDK9-mCherry MEF cells derived from a CDK9-mCherry knock-in mouse. Cells were immunostained for CDK12 (A), Hexim1 (C), cyclin T1 (E), or SC35 (G). (B,D,F,H) Graphs show the percentage of noncolocalized staining (green bars) and the normalized frequency distribution of all colocalizing objects (gray line graphs) (see also the Material and Methods).
Figure 6.
Figure 6.
CDK9 foci mark transcription sites. Confocal image projection of a 3D image stack of RNA-FISH-stained fetal liver cells isolated from a CDK9-mCherry knock-in 14.5-d-post-coitum (dpc) embryo. β-Globin (AC) and α-globin (DF) RNA staining (A,D) with CDK9-mCherry fluorescence (B,E). Overlay images (C,F) show a large overlap of globin transcripts and CDK9-mCherry fluorescence in the nucleus.
Figure 7.
Figure 7.
CDK9 is dynamically recruited to transcription factories. FRAP of CDK9-mCherry foci in MEFs. (A) Stills of the live imaging to show the rapid exchange of CDK9. (B) Plot of the average of recovery after bleaching of seven FRAP measurements (±SEM) (AU) Arbitrary units. The real-time movie is shown in Supplemental Movie S5. (C) A model of transcription; gene promoters are loaded with RNAPII-Ser5P (Ser5 light gray) in factories. Elongating RNAPII-Ser2P (Ser2, dark gray) moves to the adjacent nuclear space when it becomes phosphorylated at Ser2 by CDK9. Filled circles represent CDK9, which, together with RNAPII-Ser5P (light gray), is enriched in the factory. CDK9 is also present outside the factory and is exchanged quickly.

References

    1. Bartkowiak B, Liu P, Phatnani HP, Fuda NJ, Cooper JJ, Price DH, Adelman K, Lis JT, Greenleaf AL 2010. CDK12 is a transcription elongation-associated CTD kinase, the metazoan ortholog of yeast Ctk1. Genes Dev 24: 2303–2316 - PMC - PubMed
    1. Baumli S, Lolli G, Lowe ED, Troiani S, Rusconi L, Bullock AN, Debreczeni JE, Knapp S, Johnson LN 2008. The structure of P-TEFb (CDK9/cyclin T1), its complex with flavopiridol and regulation by phosphorylation. EMBO J 27: 1907–1918 - PMC - PubMed
    1. Brookes E, Pombo A 2009. Modifications of RNA polymerase II are pivotal in regulating gene expression states. EMBO Rep 10: 1213–1219 - PMC - PubMed
    1. Brown JM, Green J, das Neves RP, Wallace HA, Smith AJ, Hughes J, Gray N, Taylor S, Wood WG, Higgs DR, et al. 2008. Association between active genes occurs at nuclear speckles and is modulated by chromatin environment. J Cell Biol 182: 1083–1097 - PMC - PubMed
    1. Chandler D 2005. Interfaces and the driving force of hydrophobic assembly. Nature 437: 640–647 - PubMed

Publication types