. 2013 Apr 16;6(271):ra24.
doi: 10.1126/scisignal.2003520.

Nutrient signaling in protein homeostasis: an increase in quantity at the expense of quality

Affiliations

Nutrient signaling in protein homeostasis: an increase in quantity at the expense of quality

Crystal S Conn et al. Sci Signal. .

Abstract

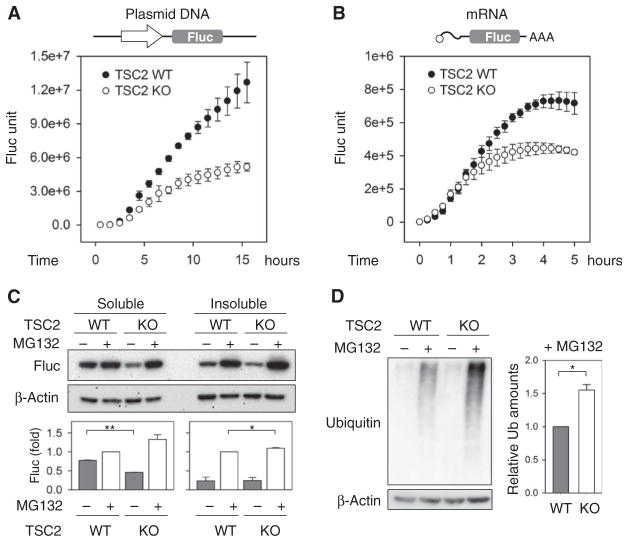
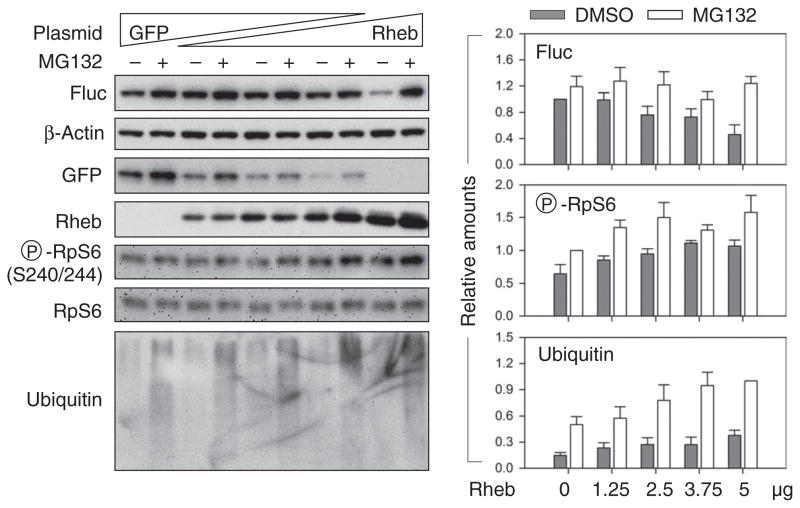
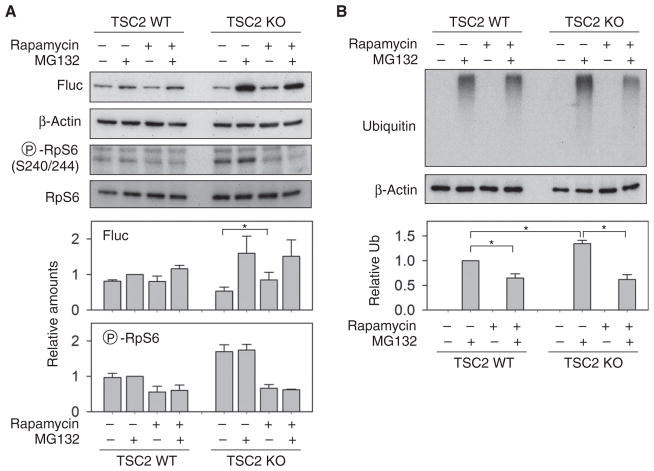
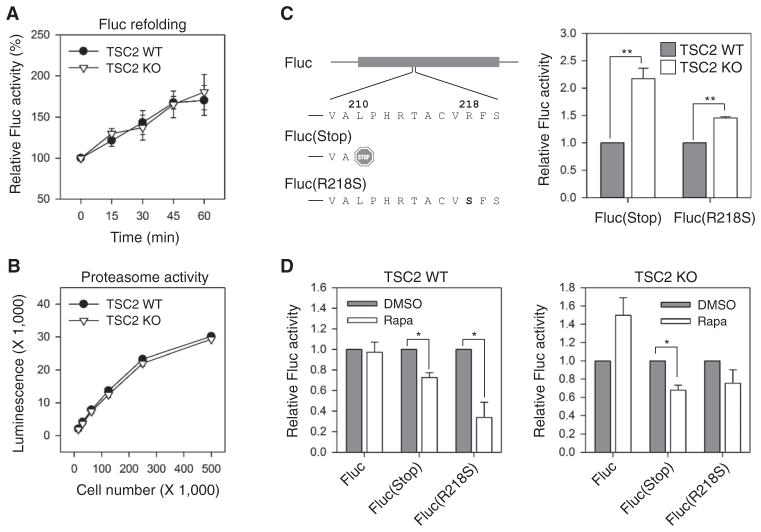
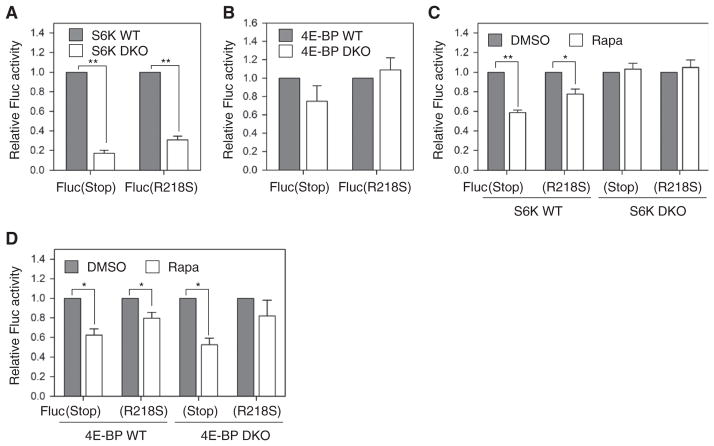
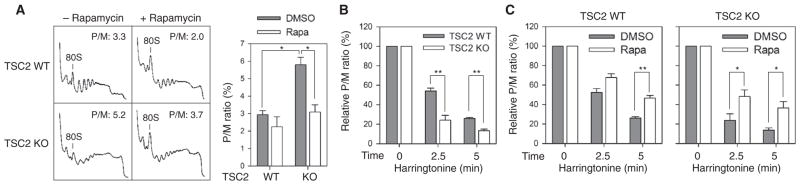
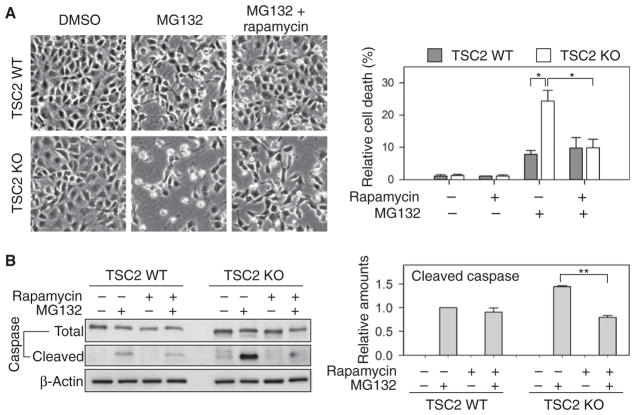
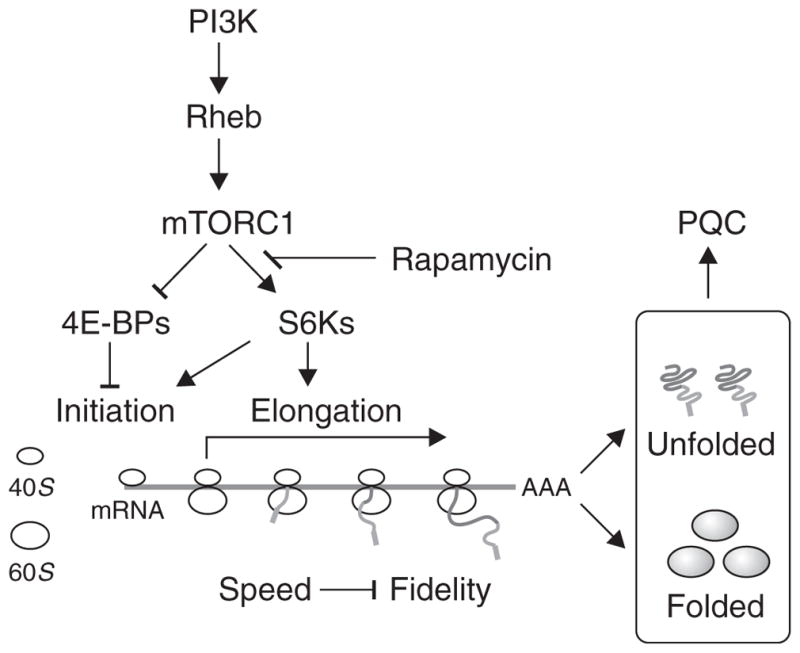
The discovery that rapamycin extends the life span of diverse organisms has triggered many studies aimed at identifying the underlying molecular mechanisms. Mammalian target of rapamycin complex 1 (mTORC1) regulates cell growth and may regulate organismal aging by controlling mRNA translation. However, how inhibiting mTORC1 and decreasing protein synthesis can extend life span remains an unresolved issue. We showed that constitutively active mTORC1 signaling increased general protein synthesis but unexpectedly reduced the quality of newly synthesized polypeptides. We demonstrated that constitutively active mTORC1 decreased translation fidelity by increasing the speed of ribosomal elongation. Conversely, rapamycin treatment restored the quality of newly synthesized polypeptides mainly by slowing the rate of ribosomal elongation. We also found distinct roles for mTORC1 downstream targets in maintaining protein homeostasis. Loss of S6 kinases, but not 4E-BP family proteins, which are both involved in regulation of translation, attenuated the effects of rapamycin on the quality of newly translated proteins. Our results reveal a mechanistic connection between mTORC1 and protein quality, highlighting the central role of nutrient signaling in growth and aging.


Conflict of interest statement

Competing interests: The authors declare that they have no competing interests.

Figures

Fig. 1
Fig. 1. Constitutively active mTORC1 reduces the stability of synthesized polypeptides
(A) Wild-type (WT) and TSC2 knockout (KO) cells were transfected with Fluc plasmids, and the Fluc activity was monitored continuously (means ± SEM; n = 6 independent experiments). (B) Similar to (A) except that the cells were transfected with Fluc mRNA (means ± SEM; n = 3 independent experiments). (C) WT and TSC2 KO cells transfected with Fluc plasmids were treated with MG132. Whole-cell lysates were separated into soluble and insoluble fractions followed by immunoblotting using antibodies as indicated. Bottom panel shows quantification of Fluc amounts (means ± SEM; n = 3 independent experiments; *P < 0.05, **P < 0.01, ratio paired t test). (D) MG132-treated WT and TSC2 KO cells were immunoblotted with the indicated antibodies. Right panel shows quantification (means ± SEM; n = 3 independent experiments; *P = 0.014, ratio paired t test).
Fig. 2
Fig. 2. Rheb overexpression reduces the stability of synthesized polypeptides
MG132-treated HEK293 cells cotransfected with plasmids encoding Fluc and Rheb, supplemented with GFP, were immunoblotted with the indicated antibodies (left panel). Fluc and polyubiquitinated species were quantified after normalizing to β-actin abundance (right panels). Phosphorylated RpS6 was normalized to total RpS6 protein abundance (means ± SEM; n = 3 independent experiments).
Fig. 3
Fig. 3. Suppressing mTORC1 restores the stability of synthesized polypeptides
(A) WT and TSC2 KO cells transfected with Fluc were treated with rapamycin in the absence or presence of MG132 followed by immunoblotting with indicated antibodies. Middle panels show quantification of Fluc protein normalized to β-actin before and after rapamycin treatment. Lower panel is the quantification of phosphorylated RpS6 normalized to total RpS6 protein abundance (means ± SEM; n = 3 independent experiments; *P < 0.05, ratio paired t test). (B) Cells in (A) were immunoblotted using antibody against polyubiquitinated species. Lower panel shows quantitation of ubiquitin before and after rapamycin treatment normalized to β-actin (means ± SEM; n = 4 independent experiments; *P < 0.05, mixed model with random blots and fixed treatment using normalized values; P values are adjusted with a Bonferroni correction).
Fig. 4
Fig. 4. mTORC1 primarily affects translation fidelity
(A) Heat-denatured Fluc proteins were incubated with whole-cell lysates derived from TSC2 WT and KO cells at room temperature. Fluc refolding was monitored by measuring Fluc activities at the time points indicated. Relative Fluc activity is presented (means ± SEM; n = 3 independent experiments). (B) The intracellular chymotrypsin activities in TSC2 WT and KO cells were measured by luminescent reagent (Proteasome-Glo) (means ± SEM; n = 3 independent experiments). (C) Schematic diagram of Fluc mutants Fluc(Stop) and Fluc(R218S) (left panel). TSC2 WT and KO cells were transfected with plasmids encoding Fluc mutants followed by measurement of Fluc activity. Relative Fluc activities were normalized to WT Fluc (means ± SEM; n = 4 independent experiments; **P < 0.01, paired t test). (D) WT (left panel) and TSC2 KO cells (right panel) transfected with plasmids encoding Fluc mutants as in (C) were treated with rapamycin (Rapa) followed by measurement of Fluc activity. Relative Fluc activities were normalized to WT Fluc with dimethyl sulfoxide (DMSO) (means ± SEM; n = 4 independent experiments; *P < 0.05, paired t test).
Fig. 5
Fig. 5. Distinct roles of mTORC1 downstream targets in translation fidelity
(A) WT and S6K double-KO (DKO) cells were transfected with plasmids encoding Fluc mutants. Relative Fluc activities were normalized to WT Fluc (means ± SEM; n = 4 independent experiments;**P < 0.001, paired t test). (B) WT and 4E-BP DKO cells were transfected with plasmids encoding Fluc mutants. Relative Fluc activities were normalized to WT Fluc (means ± SEM; n = 4 independent experiments). (C) WT and S6K DKO cells transfected as in (A) were treated with rapamycin. Relative Fluc activities were normalized to WT Fluc (means ± SEM; n = 3 independent experiments; *P < 0.05, **P < 0.001, paired t test). (D) WT and 4E-BP DKO cells transfected as in (B) were treated with rapamycin. Relative Fluc activities were normalized to WT Fluc (means ± SEM; n = 4 independent experiments for WT and n = 3 independent experiments for DKO; *P < 0.05, **P < 0.001, paired t test).
Fig. 6
Fig. 6. mTORC1 alters ribosome dynamics during translation elongation
(A) Polysome profiles of WT and TSC2 KO cells in the presence of rapamycin were determined using sucrose gradient sedimentation. The P/M (polysome/monosome) ratio was calculated by measuring the areas under the polysome and 80S peak and further quantified in the left panel (means ± SEM; n = 3 independent experiments; *P < 0.05, ratio paired t test). (B) Polysome profiling of WT and TSC2 KO cells was conducted after treatment with harringtonine for indicated times. The P/M ratio was determined and normalized to no harringtonine treatment per cell type (means ± SEM; n = 4 independent experiments; **P < 0.01, paired t test). (C) WT and TSC2 KO cells were pretreated with rapamycin followed by harringtonine treatment for indicated times before polysome profiling. The P/M ratio was determined and normalized to no harringtonine treatment (means ± SEM; n = 3 independent experiments; *P < 0.05, **P < 0.01, unpaired t test).
Fig. 7
Fig. 7. mTORC1 regulates cellular susceptibility to proteotoxic stress
(A) WT and TSC2 KO cells were treated with MG132 in the absence or presence of rapamycin. Cell viability and morphology were assessed by phase-contrast microscope images (left panel). Images were assessed for cell viability and quantified (right panel) (means ± SEM; n = 4 independent experiments; *P < 0.05, ratio paired t test). (B) Cell samples from (A) were lysed and immunoblotted using the indicated antibodies. The amount of cleaved caspase-3 relative to the total caspase-3 was quantified (right panel) (means ± SEM; n = 3 independent experiments; **P < 0.01, ratio paired t test).
Fig. 8
Fig. 8. Model for functional connection between mTORC1 and protein homeostasis
mTORC1 regulates protein synthesis at multiple stages through different downstream targets. Whereas 4E-BPs control the initiation step, S6Ks mainly promote the elongation stage. The altered ribosome dynamics when mTORC1 signaling is deregulated results in protein dyshomeostasis and disruption of the protein quality control (PQC) network. Rapamycin restores protein homeostasis by enhancing translation fidelity through the S6Ks.

Similar articles

Cited by

References

    1. Wullschleger S, Loewith R, Hall MN. TOR signaling in growth and metabolism. Cell. 2006;124:471–484. - PubMed
    1. Laplante M, Sabatini DM. mTOR signaling in growth control and disease. Cell. 2012;149:274–293. - PMC - PubMed
    1. Ma XM, Blenis J. Molecular mechanisms of mTOR-mediated translational control. Nat Rev Mol Cell Biol. 2009;10:307–318. - PubMed
    1. Sonenberg N, Hinnebusch AG. Regulation of translation initiation in eukaryotes: Mechanisms and biological targets. Cell. 2009;136:731–745. - PMC - PubMed
    1. Inoki K, Guan KL. Complexity of the TOR signaling network. Trends Cell Biol. 2006;16:206–212. - PubMed

Publication types