

IL-27 receptor signalling restricts the formation of pathogenic, terminally differentiated Th1 cells during malaria infection by repressing IL-12 dependent signals
- PMID: 23593003
- PMCID: PMC3623720
- DOI: 10.1371/journal.ppat.1003293
IL-27 receptor signalling restricts the formation of pathogenic, terminally differentiated Th1 cells during malaria infection by repressing IL-12 dependent signals
Abstract
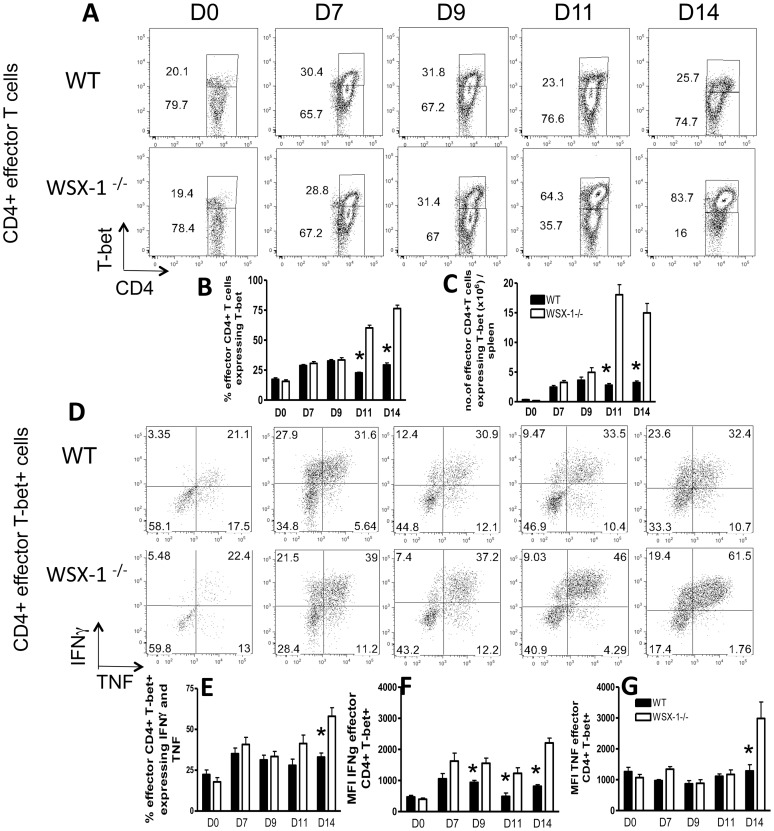
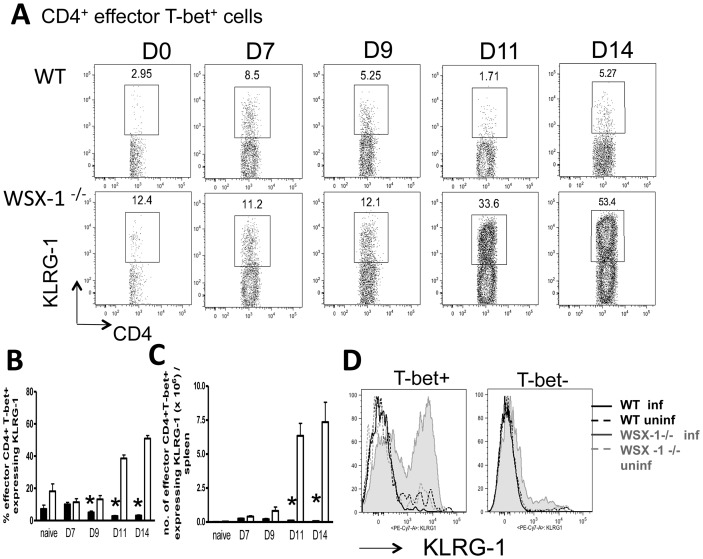
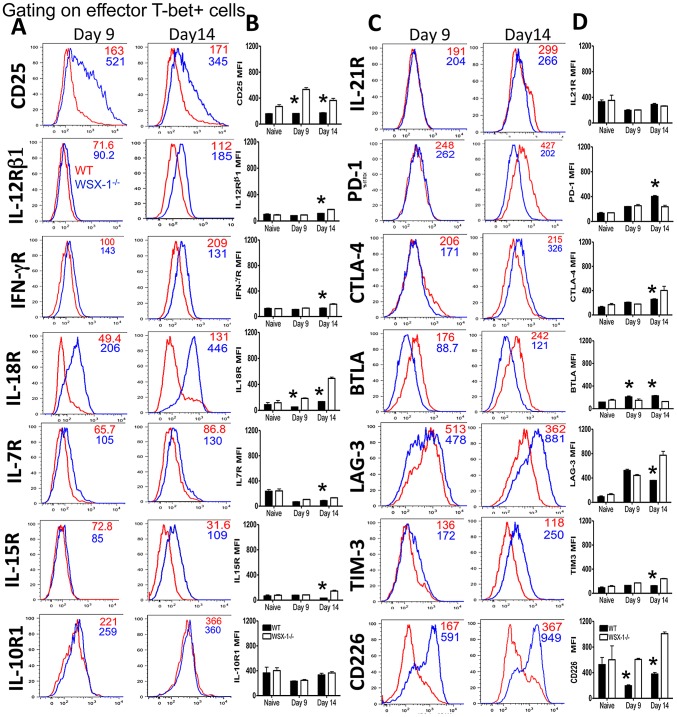
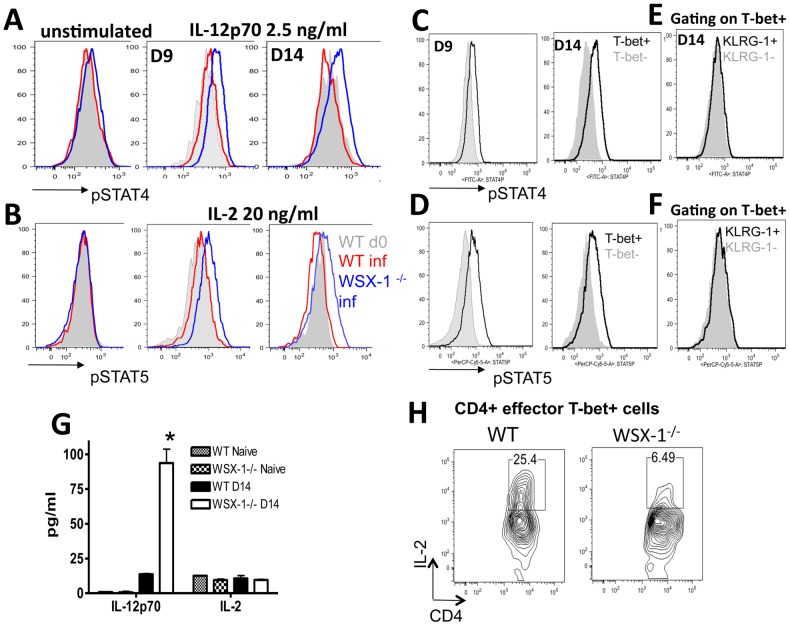
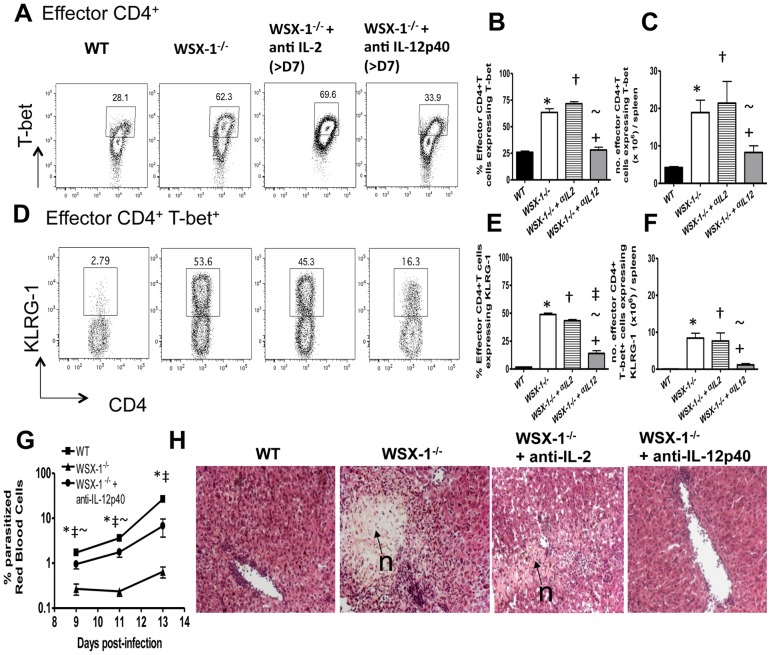
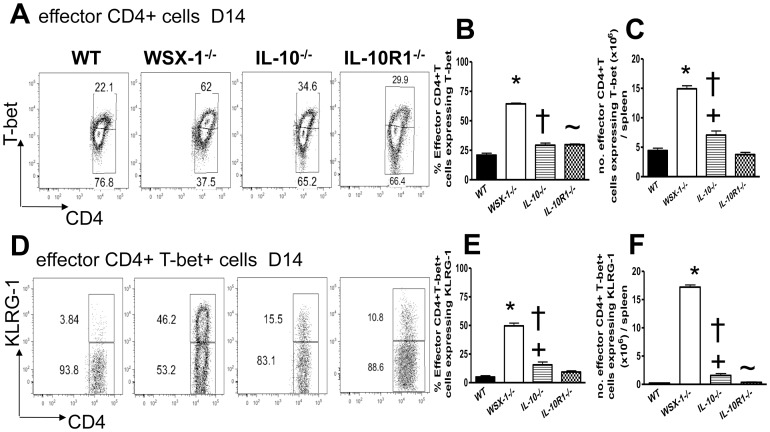
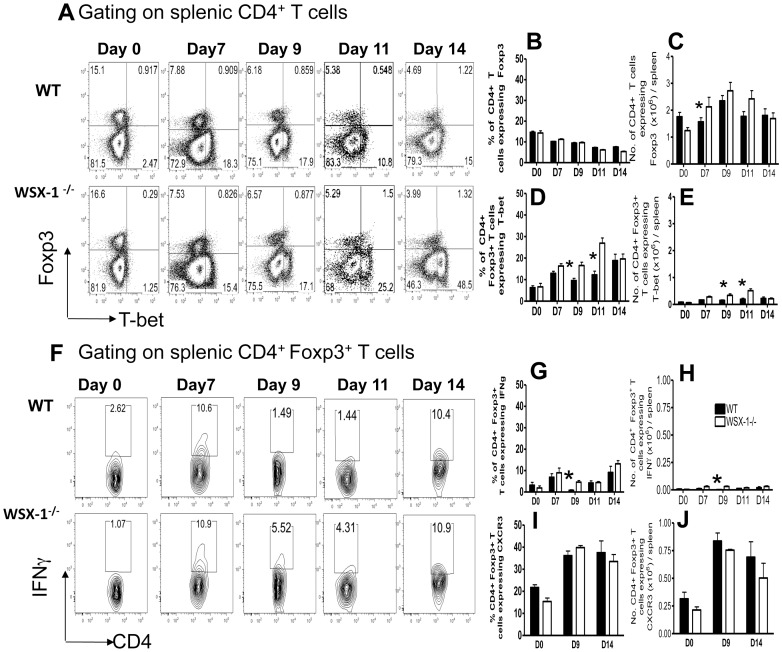
The IL-27R, WSX-1, is required to limit IFN-γ production by effector CD4⁺ T cells in a number of different inflammatory conditions but the molecular basis of WSX-1-mediated regulation of Th1 responses in vivo during infection has not been investigated in detail. In this study we demonstrate that WSX-1 signalling suppresses the development of pathogenic, terminally differentiated (KLRG-1⁺) Th1 cells during malaria infection and establishes a restrictive threshold to constrain the emergent Th1 response. Importantly, we show that WSX-1 regulates cell-intrinsic responsiveness to IL-12 and IL-2, but the fate of the effector CD4⁺ T cell pool during malaria infection is controlled primarily through IL-12 dependent signals. Finally, we show that WSX-1 regulates Th1 cell terminal differentiation during malaria infection through IL-10 and Foxp3 independent mechanisms; the kinetics and magnitude of the Th1 response, and the degree of Th1 cell terminal differentiation, were comparable in WT, IL-10R1⁻/⁻ and IL-10⁻/⁻ mice and the numbers and phenotype of Foxp3⁺ cells were largely unaltered in WSX-1⁻/⁻ mice during infection. As expected, depletion of Foxp3⁺ cells did not enhance Th1 cell polarisation or terminal differentiation during malaria infection. Our results significantly expand our understanding of how IL-27 regulates Th1 responses in vivo during inflammatory conditions and establishes WSX-1 as a critical and non-redundant regulator of the emergent Th1 effector response during malaria infection.
Conflict of interest statement
Christiaan J.M. Saris is a former employee of Amgen Inc. and owns stock and stock options in this company. Issued and pending Amgen patents on which he is a co-inventor are unrelated to the subject of this manuscript. This does not alter our adherence to all PLoS Pathogens policies on sharing data and materials.
Figures
Similar articles
-
Cutting edge: role of IL-27/WSX-1 signaling for induction of T-bet through activation of STAT1 during initial Th1 commitment.J Immunol. 2003 May 15;170(10):4886-90. doi: 10.4049/jimmunol.170.10.4886. J Immunol. 2003. PMID: 12734330
-
WSX-1 signalling inhibits CD4⁺ T cell migration to the liver during malaria infection by repressing chemokine-independent pathways.PLoS One. 2013 Nov 7;8(11):e78486. doi: 10.1371/journal.pone.0078486. eCollection 2013. PLoS One. 2013. PMID: 24244314 Free PMC article.
-
Essential role for IL-27 receptor signaling in prevention of Th1-mediated immunopathology during malaria infection.J Immunol. 2010 Aug 15;185(4):2482-92. doi: 10.4049/jimmunol.0904019. Epub 2010 Jul 14. J Immunol. 2010. PMID: 20631310
-
The Th1 life cycle: molecular control of IFN-γ to IL-10 switching.Trends Immunol. 2011 Jun;32(6):278-86. doi: 10.1016/j.it.2011.03.010. Epub 2011 Apr 30. Trends Immunol. 2011. PMID: 21531623 Review.
-
T cell-derived IL-10 and its impact on the regulation of host responses during malaria.Int J Parasitol. 2012 May 15;42(6):549-55. doi: 10.1016/j.ijpara.2012.03.010. Epub 2012 Apr 24. Int J Parasitol. 2012. PMID: 22549022 Review.
Cited by
-
Oral delivery of oligomeric procyanidins in Apple Poly® enhances type I IFN responses in vivo.J Leukoc Biol. 2014 May;95(5):841-847. doi: 10.1189/jlb.0513296. Epub 2014 Jan 13. J Leukoc Biol. 2014. PMID: 24421266 Free PMC article. Clinical Trial.
-
IL-27p28 Production by XCR1+ Dendritic Cells and Monocytes Effectively Predicts Adjuvant-Elicited CD8+ T Cell Responses.Immunohorizons. 2018 Jan 1;2(1):1-11. doi: 10.4049/immunohorizons.1700054. Immunohorizons. 2018. PMID: 29354801 Free PMC article.
-
Human Immunodeficiency Virus Type-1 Myeloid Derived Suppressor Cells Inhibit Cytomegalovirus Inflammation through Interleukin-27 and B7-H4.Sci Rep. 2017 Mar 24;7:44485. doi: 10.1038/srep44485. Sci Rep. 2017. PMID: 28338007 Free PMC article.
-
Interleukin-27 impairs BCG antigen clearance and T cell stimulatory potential by neonatal dendritic cells.Curr Res Microb Sci. 2022 Dec 1;4:100176. doi: 10.1016/j.crmicr.2022.100176. eCollection 2023. Curr Res Microb Sci. 2022. PMID: 36530844 Free PMC article.
-
Regulation of immunopathogenesis during Plasmodium and Toxoplasma infections: more parallels than distinctions?Trends Parasitol. 2013 Dec;29(12):593-602. doi: 10.1016/j.pt.2013.10.002. Epub 2013 Nov 1. Trends Parasitol. 2013. PMID: 24184186 Free PMC article. Review.
References
-
- Hall AO, Silver JS, Hunter CA (2012) The immunobiology of IL-27. Adv Immunol 115: 1–44. - PubMed
-
- Yoshida H, Miyazaki Y (2008) Regulation of immune responses by interleukin-27. Immunol Rev 226: 234–247. - PubMed
-
- Villarino A, Hibbert L, Lieberman L, Wilson E, Mak T, et al. (2003) The IL-27R (WSX-1) is required to suppress T cell hyperactivity during infection. Immunity 19: 645–655. - PubMed
-
- Hamano S, Himeno K, Miyazaki Y, Ishii K, Yamanaka A, et al. (2003) WSX-1 is required for resistance to Trypanosoma cruzi infection by regulation of proinflammatory cytokine production. Immunity 19: 657–667. - PubMed
-
- Holscher C, Holscher A, Ruckerl D, Yoshimoto T, Yoshida H, et al. (2005) The IL-27 receptor chain WSX-1 differentially regulates antibacterial immunity and survival during experimental tuberculosis. J Immunol 174: 3534–3544. - PubMed
Publication types
MeSH terms
Substances
Grants and funding
- G0900487/MRC_/Medical Research Council/United Kingdom
- 004161/BB_/Biotechnology and Biological Sciences Research Council/United Kingdom
- BB/I020950/2/BB_/Biotechnology and Biological Sciences Research Council/United Kingdom
- 020950/BB_/Biotechnology and Biological Sciences Research Council/United Kingdom
- BB/G004161/1/BB_/Biotechnology and Biological Sciences Research Council/United Kingdom
LinkOut - more resources
Full Text Sources
Other Literature Sources
Molecular Biology Databases
Research Materials
