

Bisphenol a exposure disrupts genomic imprinting in the mouse
- PMID: 23593014
- PMCID: PMC3616904
- DOI: 10.1371/journal.pgen.1003401
Bisphenol a exposure disrupts genomic imprinting in the mouse
Abstract
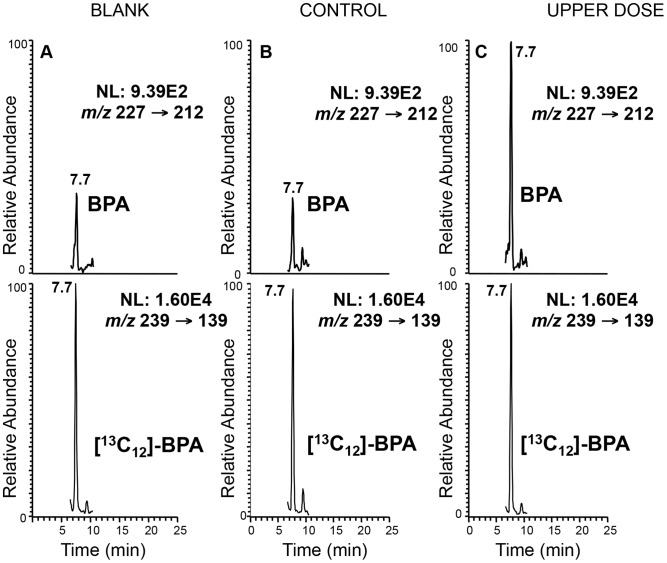
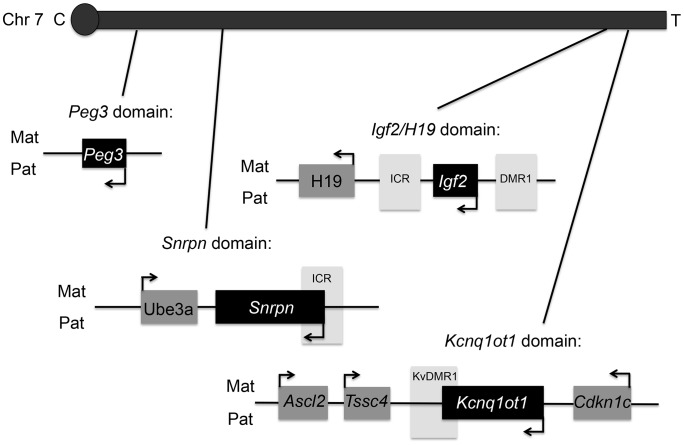
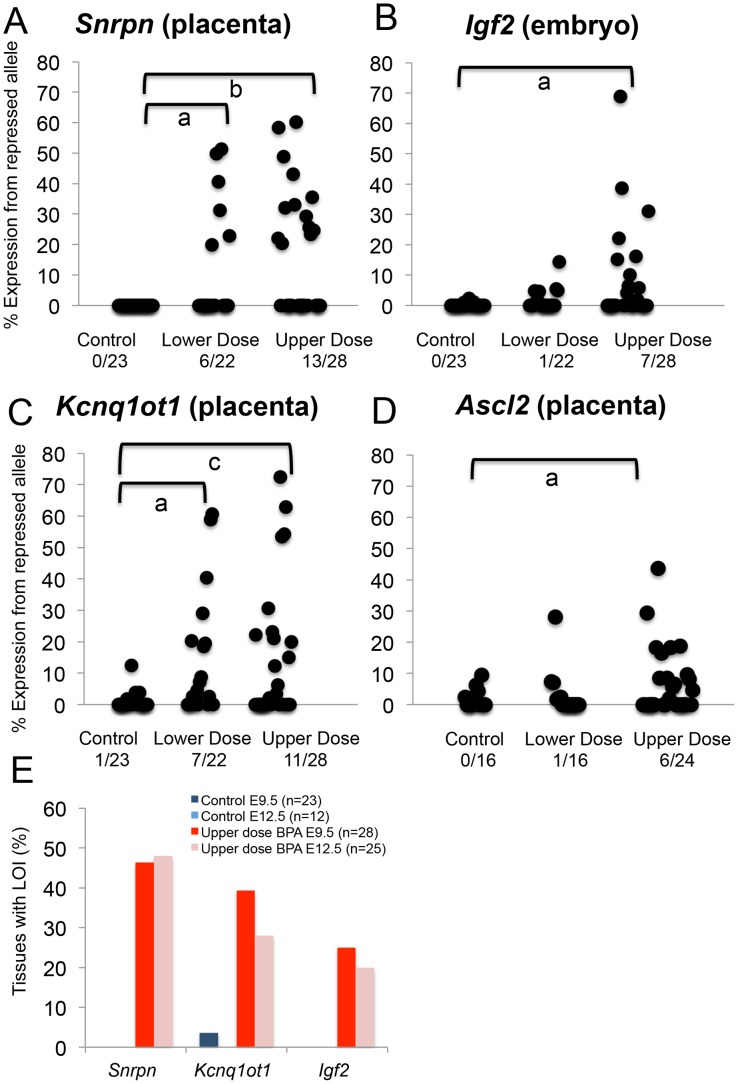
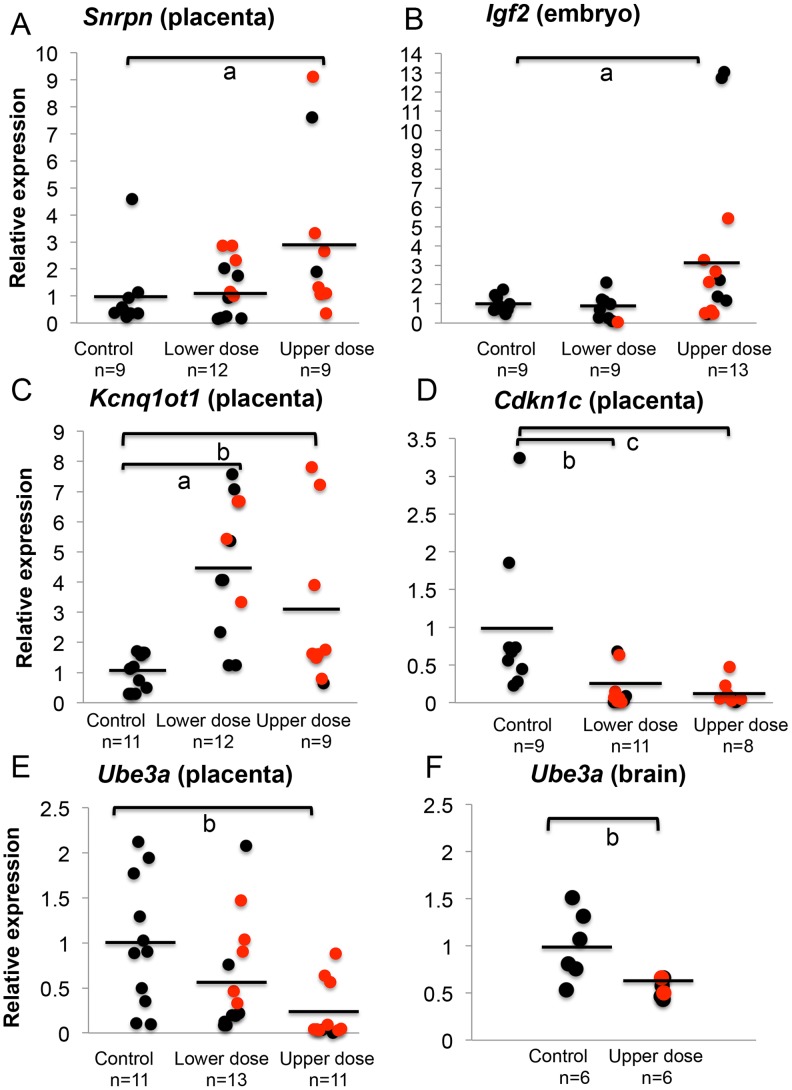
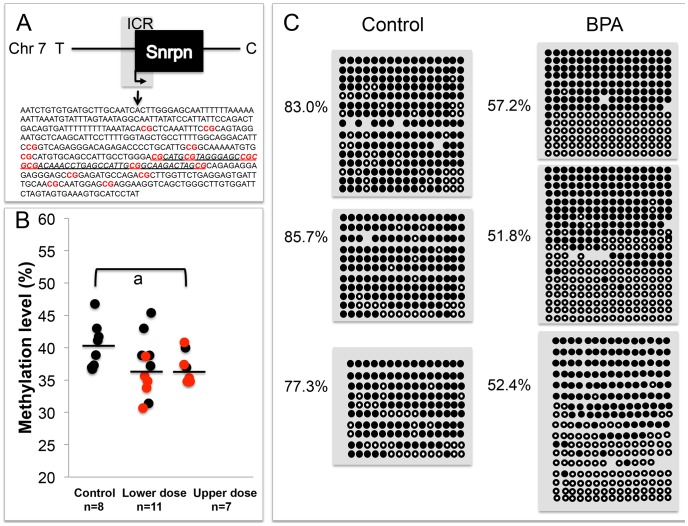
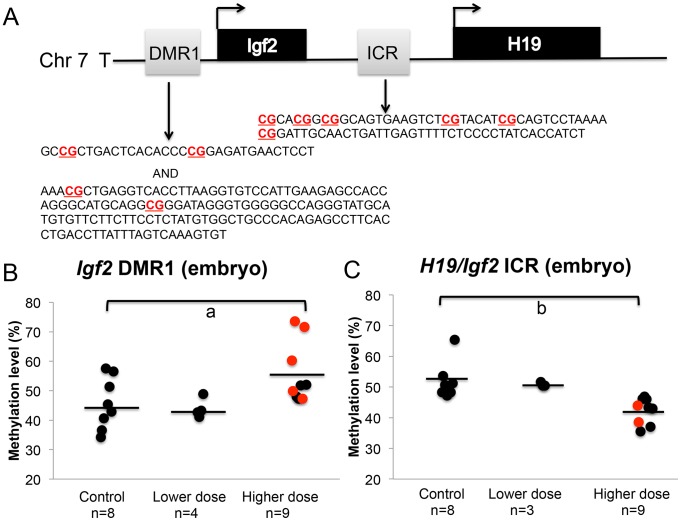
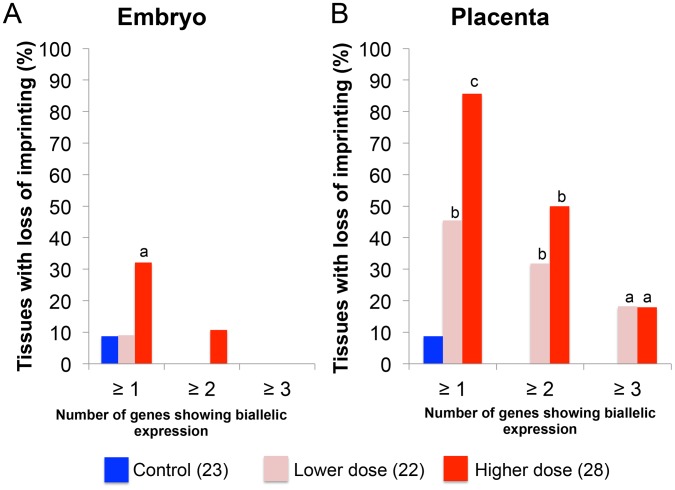
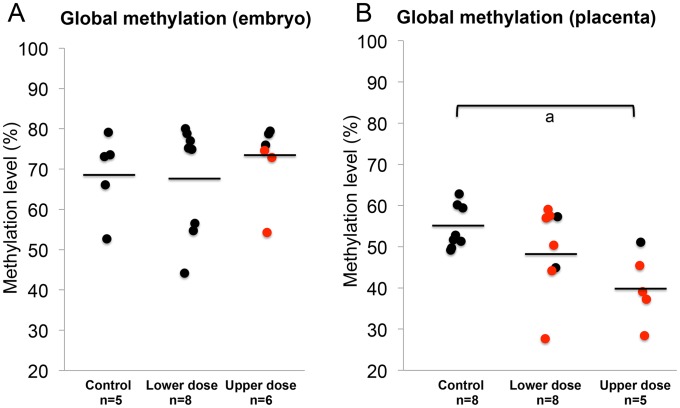
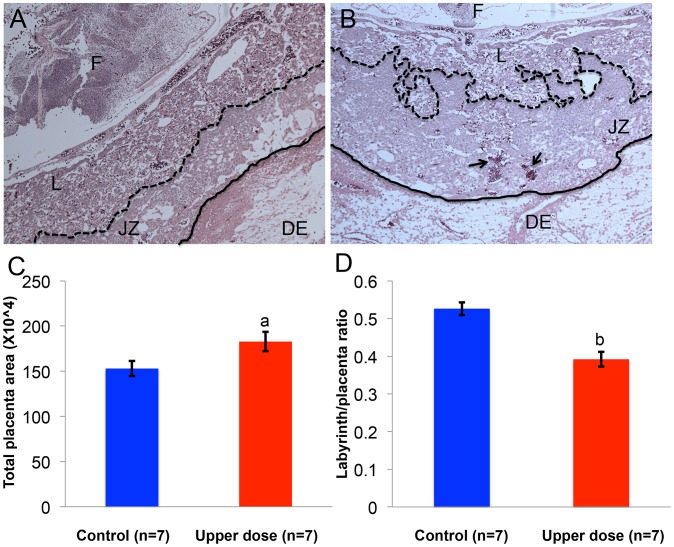
Exposure to endocrine disruptors is associated with developmental defects. One compound of concern, to which humans are widely exposed, is bisphenol A (BPA). In model organisms, BPA exposure is linked to metabolic disorders, infertility, cancer, and behavior anomalies. Recently, BPA exposure has been linked to DNA methylation changes, indicating that epigenetic mechanisms may be relevant. We investigated effects of exposure on genomic imprinting in the mouse as imprinted genes are regulated by differential DNA methylation and aberrant imprinting disrupts fetal, placental, and postnatal development. Through allele-specific and quantitative real-time PCR analysis, we demonstrated that maternal BPA exposure during late stages of oocyte development and early stages of embryonic development significantly disrupted imprinted gene expression in embryonic day (E) 9.5 and 12.5 embryos and placentas. The affected genes included Snrpn, Ube3a, Igf2, Kcnq1ot1, Cdkn1c, and Ascl2; mutations and aberrant regulation of these genes are associated with imprinting disorders in humans. Furthermore, the majority of affected genes were expressed abnormally in the placenta. DNA methylation studies showed that BPA exposure significantly altered the methylation levels of differentially methylated regions (DMRs) including the Snrpn imprinting control region (ICR) and Igf2 DMR1. Moreover, exposure significantly reduced genome-wide methylation levels in the placenta, but not the embryo. Histological and immunohistochemical examinations revealed that these epigenetic defects were associated with abnormal placental development. In contrast to this early exposure paradigm, exposure outside of the epigenetic reprogramming window did not cause significant imprinting perturbations. Our data suggest that early exposure to common environmental compounds has the potential to disrupt fetal and postnatal health through epigenetic changes in the embryo and abnormal development of the placenta.
Conflict of interest statement
The authors have declared that no competing interests exist.
Figures
Similar articles
-
Early prenatal alcohol exposure alters imprinted gene expression in placenta and embryo in a mouse model.PLoS One. 2018 May 15;13(5):e0197461. doi: 10.1371/journal.pone.0197461. eCollection 2018. PLoS One. 2018. PMID: 29763474 Free PMC article.
-
Aberrant DNA methylation at Igf2-H19 imprinting control region in spermatozoa upon neonatal exposure to bisphenol A and its association with post implantation loss.Mol Biol Rep. 2013 Aug;40(8):4747-57. doi: 10.1007/s11033-013-2571-x. Epub 2013 May 8. Mol Biol Rep. 2013. PMID: 23653003
-
Manipulations of mouse embryos prior to implantation result in aberrant expression of imprinted genes on day 9.5 of development.Hum Mol Genet. 2008 Jan 1;17(1):1-14. doi: 10.1093/hmg/ddm280. Epub 2007 Sep 27. Hum Mol Genet. 2008. PMID: 17901045
-
Imprinting of the mouse Igf2r gene depends on an intronic CpG island.Mol Cell Endocrinol. 1998 May 25;140(1-2):9-14. doi: 10.1016/s0303-7207(98)00022-7. Mol Cell Endocrinol. 1998. PMID: 9722161 Review.
-
Epigenetic and genetic alterations of the imprinting disorder Beckwith-Wiedemann syndrome and related disorders.J Hum Genet. 2013 Jul;58(7):402-9. doi: 10.1038/jhg.2013.51. Epub 2013 May 30. J Hum Genet. 2013. PMID: 23719190 Review.
Cited by
-
Environmental Influences on Genomic Imprinting.Curr Environ Health Rep. 2015 Jun;2(2):155-62. doi: 10.1007/s40572-015-0046-z. Curr Environ Health Rep. 2015. PMID: 26029493 Free PMC article. Review.
-
Chromatin modifier developmental pluripotency associated factor 4 (DPPA4) is a candidate gene for alcohol-induced developmental disorders.BMC Med. 2022 Dec 30;20(1):495. doi: 10.1186/s12916-022-02699-1. BMC Med. 2022. PMID: 36581877 Free PMC article.
-
Early-life lead exposure results in dose- and sex-specific effects on weight and epigenetic gene regulation in weanling mice.Epigenomics. 2013;5(5):487-500. doi: 10.2217/epi.13.49. Epigenomics. 2013. PMID: 24059796 Free PMC article.
-
Insights from space: potential role of diet in the spatial organization of chromosomes.Nutrients. 2014 Dec 10;6(12):5724-39. doi: 10.3390/nu6125724. Nutrients. 2014. PMID: 25514390 Free PMC article. Review.
-
Environmental Exposure to Endocrine Disrupting Chemicals Influences Genomic Imprinting, Growth, and Metabolism.Genes (Basel). 2021 Jul 28;12(8):1153. doi: 10.3390/genes12081153. Genes (Basel). 2021. PMID: 34440327 Free PMC article. Review.
References
-
- Barker DJ (1997) Maternal nutrition, fetal nutrition, and disease in later life. Nutrition 13: 807–813. - PubMed
-
- Harris RM, Waring RH (2012) Diethylstilboestrol-A long-term legacy. Maturitas 72: 108–112. - PubMed
-
- Roseboom TJ, Painter RC, van Abeelen AF, Veenendaal MV, de RooijSR (2011) Hungry in the womb: what are the consequences? Lessons from the Dutch famine. Maturitas 70: 141–145. - PubMed
Publication types
MeSH terms
Substances
Grants and funding
LinkOut - more resources
Full Text Sources
Other Literature Sources
Molecular Biology Databases
Miscellaneous
