

Balancing selection on a regulatory region exhibiting ancient variation that predates human-neandertal divergence
- PMID: 23593015
- PMCID: PMC3623772
- DOI: 10.1371/journal.pgen.1003404
Balancing selection on a regulatory region exhibiting ancient variation that predates human-neandertal divergence
Abstract
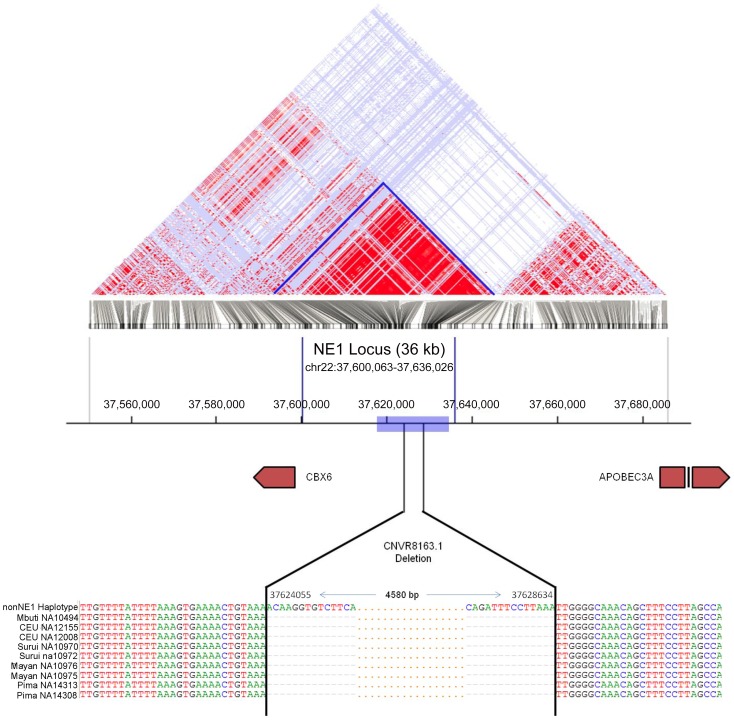
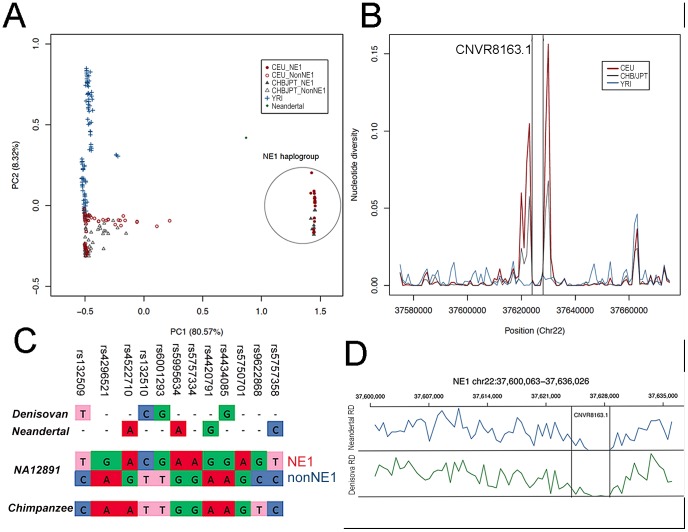
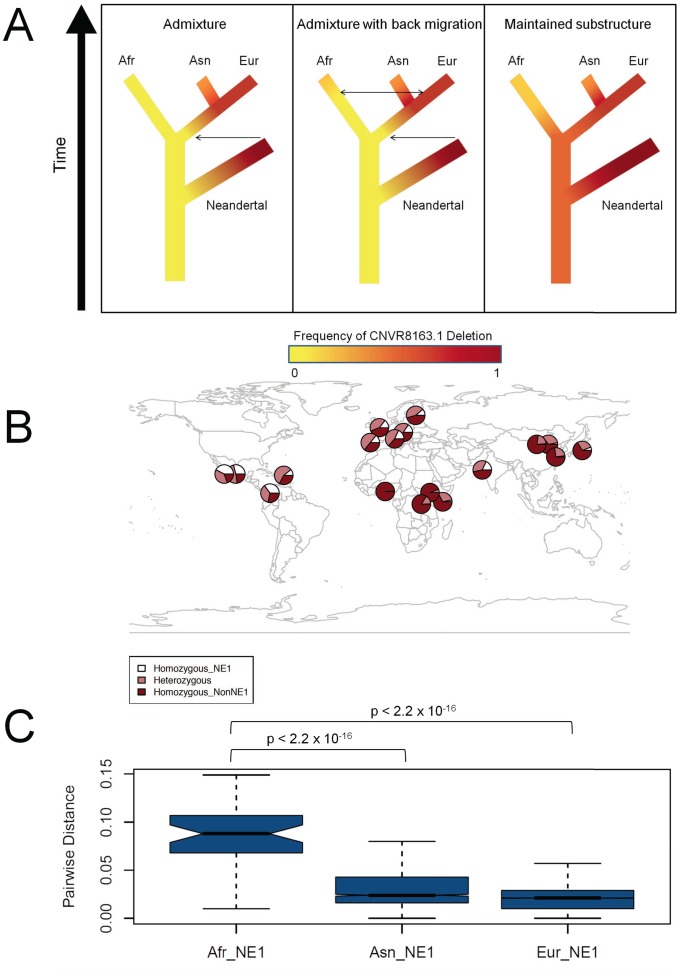
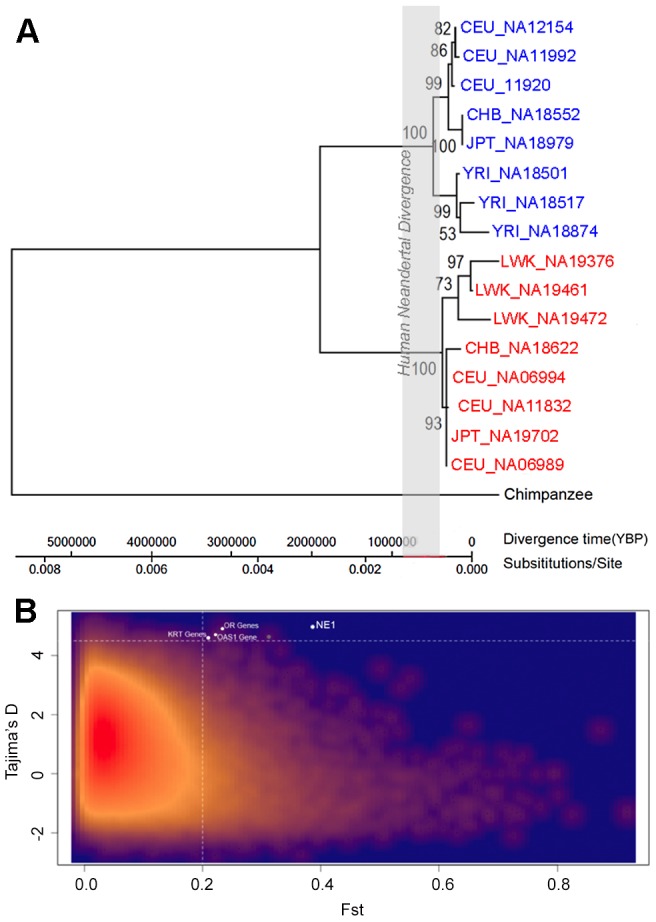
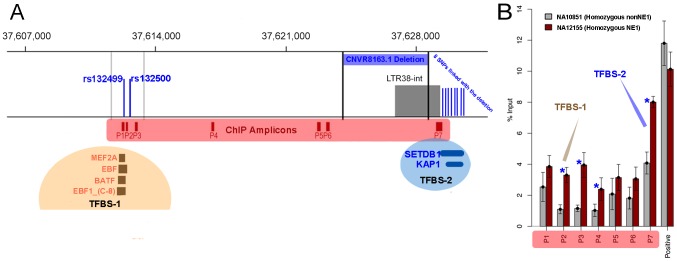
Ancient population structure shaping contemporary genetic variation has been recently appreciated and has important implications regarding our understanding of the structure of modern human genomes. We identified a ∼36-kb DNA segment in the human genome that displays an ancient substructure. The variation at this locus exists primarily as two highly divergent haplogroups. One of these haplogroups (the NE1 haplogroup) aligns with the Neandertal haplotype and contains a 4.6-kb deletion polymorphism in perfect linkage disequilibrium with 12 single nucleotide polymorphisms (SNPs) across diverse populations. The other haplogroup, which does not contain the 4.6-kb deletion, aligns with the chimpanzee haplotype and is likely ancestral. Africans have higher overall pairwise differences with the Neandertal haplotype than Eurasians do for this NE1 locus (p<10⁻¹⁵). Moreover, the nucleotide diversity at this locus is higher in Eurasians than in Africans. These results mimic signatures of recent Neandertal admixture contributing to this locus. However, an in-depth assessment of the variation in this region across multiple populations reveals that African NE1 haplotypes, albeit rare, harbor more sequence variation than NE1 haplotypes found in Europeans, indicating an ancient African origin of this haplogroup and refuting recent Neandertal admixture. Population genetic analyses of the SNPs within each of these haplogroups, along with genome-wide comparisons revealed significant FST (p = 0.00003) and positive Tajima's D (p = 0.00285) statistics, pointing to non-neutral evolution of this locus. The NE1 locus harbors no protein-coding genes, but contains transcribed sequences as well as sequences with putative regulatory function based on bioinformatic predictions and in vitro experiments. We postulate that the variation observed at this locus predates Human-Neandertal divergence and is evolving under balancing selection, especially among European populations.
Conflict of interest statement
The authors have declared that no competing interests exist.
Figures
Similar articles
-
Neandertal origin of genetic variation at the cluster of OAS immunity genes.Mol Biol Evol. 2013 Apr;30(4):798-801. doi: 10.1093/molbev/mst004. Epub 2013 Jan 12. Mol Biol Evol. 2013. PMID: 23315957
-
Neanderthal and Denisova genetic affinities with contemporary humans: introgression versus common ancestral polymorphisms.Gene. 2013 Nov 1;530(1):83-94. doi: 10.1016/j.gene.2013.06.005. Epub 2013 Jul 19. Gene. 2013. PMID: 23872234
-
PKLR- GBA region shows almost complete linkage disequilibrium over 70 kb in a set of worldwide populations.Hum Genet. 2002 Jun;110(6):532-44. doi: 10.1007/s00439-002-0734-2. Epub 2002 May 22. Hum Genet. 2002. PMID: 12107439
-
Haplotype-Based Approach Represents Locus Specificity in the Genomic Diversification Process in Humans (Homo sapiens).Genes (Basel). 2024 Nov 29;15(12):1554. doi: 10.3390/genes15121554. Genes (Basel). 2024. PMID: 39766821 Free PMC article. Review.
-
Ancestry of modern Europeans: contributions of ancient DNA.Cell Mol Life Sci. 2013 Jul;70(14):2473-87. doi: 10.1007/s00018-012-1180-5. Epub 2012 Oct 11. Cell Mol Life Sci. 2013. PMID: 23052219 Free PMC article. Review.
Cited by
-
Nucleotide variation and balancing selection at the Ckma gene in Atlantic cod: analysis with multiple merger coalescent models.PeerJ. 2015 Feb 24;3:e786. doi: 10.7717/peerj.786. eCollection 2015. PeerJ. 2015. PMID: 25755922 Free PMC article.
-
Excess of Deleterious Mutations around HLA Genes Reveals Evolutionary Cost of Balancing Selection.Mol Biol Evol. 2016 Oct;33(10):2555-64. doi: 10.1093/molbev/msw127. Epub 2016 Jun 28. Mol Biol Evol. 2016. PMID: 27436009 Free PMC article.
-
Distilling functional variations for human UGT2B4 upstream region based on selection signals and implications for phenotypes of Neanderthal and Denisovan.Sci Rep. 2023 Feb 23;13(1):3134. doi: 10.1038/s41598-023-29682-x. Sci Rep. 2023. PMID: 36823244 Free PMC article.
-
VCFtoTree: a user-friendly tool to construct locus-specific alignments and phylogenies from thousands of anthropologically relevant genome sequences.BMC Bioinformatics. 2017 Sep 26;18(1):426. doi: 10.1186/s12859-017-1844-0. BMC Bioinformatics. 2017. PMID: 28950836 Free PMC article.
-
Integrative analysis of risk factors for immune-related adverse events of checkpoint blockade therapy in cancer.Nat Cancer. 2023 Jun;4(6):844-859. doi: 10.1038/s43018-023-00572-5. Epub 2023 Jun 12. Nat Cancer. 2023. PMID: 37308678
References
-
- Grossman SR, Shylakhter I, Karlsson EK, Byrne EH, Morales S, et al. (2010) A composite of multiple signals distinguishes causal variants in regions of positive selection. Science 327: 883–886. - PubMed
-
- Voight BF, Kudaravalli S, Wen X, Pritchard JK (2006) A map of recent positive selection in the human genome. PLoS Biol 4: e72 doi:10.1371/journal.pbio.0040072. - DOI - PMC - PubMed
Publication types
MeSH terms
Grants and funding
LinkOut - more resources
Full Text Sources
Other Literature Sources
Miscellaneous
