

Analysis of rare, exonic variation amongst subjects with autism spectrum disorders and population controls
- PMID: 23593035
- PMCID: PMC3623759
- DOI: 10.1371/journal.pgen.1003443
Analysis of rare, exonic variation amongst subjects with autism spectrum disorders and population controls
Abstract
We report on results from whole-exome sequencing (WES) of 1,039 subjects diagnosed with autism spectrum disorders (ASD) and 870 controls selected from the NIMH repository to be of similar ancestry to cases. The WES data came from two centers using different methods to produce sequence and to call variants from it. Therefore, an initial goal was to ensure the distribution of rare variation was similar for data from different centers. This proved straightforward by filtering called variants by fraction of missing data, read depth, and balance of alternative to reference reads. Results were evaluated using seven samples sequenced at both centers and by results from the association study. Next we addressed how the data and/or results from the centers should be combined. Gene-based analyses of association was an obvious choice, but should statistics for association be combined across centers (meta-analysis) or should data be combined and then analyzed (mega-analysis)? Because of the nature of many gene-based tests, we showed by theory and simulations that mega-analysis has better power than meta-analysis. Finally, before analyzing the data for association, we explored the impact of population structure on rare variant analysis in these data. Like other recent studies, we found evidence that population structure can confound case-control studies by the clustering of rare variants in ancestry space; yet, unlike some recent studies, for these data we found that principal component-based analyses were sufficient to control for ancestry and produce test statistics with appropriate distributions. After using a variety of gene-based tests and both meta- and mega-analysis, we found no new risk genes for ASD in this sample. Our results suggest that standard gene-based tests will require much larger samples of cases and controls before being effective for gene discovery, even for a disorder like ASD.
Conflict of interest statement
The authors have declared that no competing interests exist.
Figures
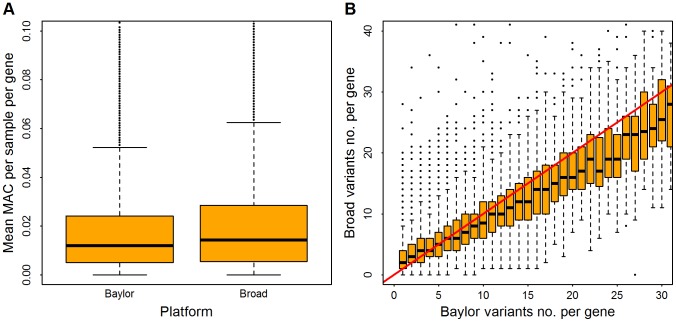
 . Panel (A), distribution of mean MAC per sample, averaged over all genes. Panel (B), in the Baylor samples, genes were binned based on the counts of rare variants (which range from 1 to 30); for each bin the vertical axis shows the distribution of counts (boxplot) from the same genes in the Broad samples. The red line indicates an equal count in Broad and Baylor.
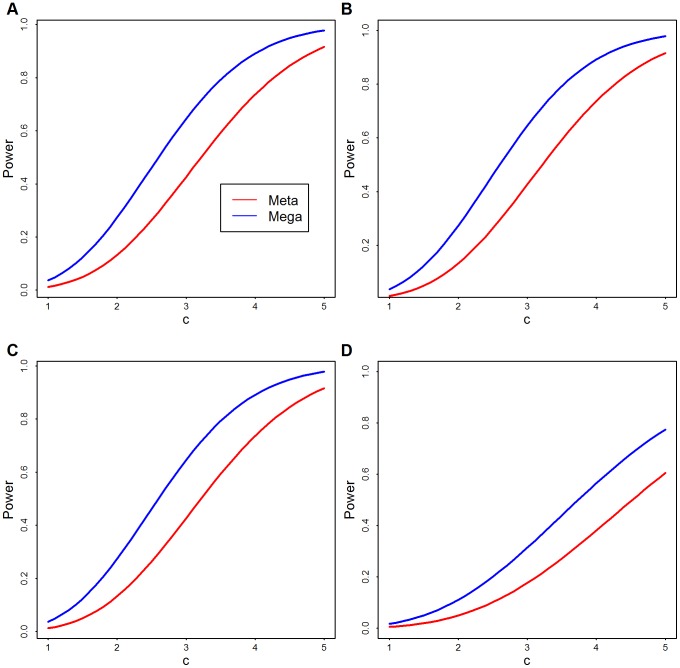
 .
.  is the strength of signal per variant and
  is the number of rare variants. (A)
  ; (B)
; (B)  ; (C)
; (C)  ; and (D)
  .
.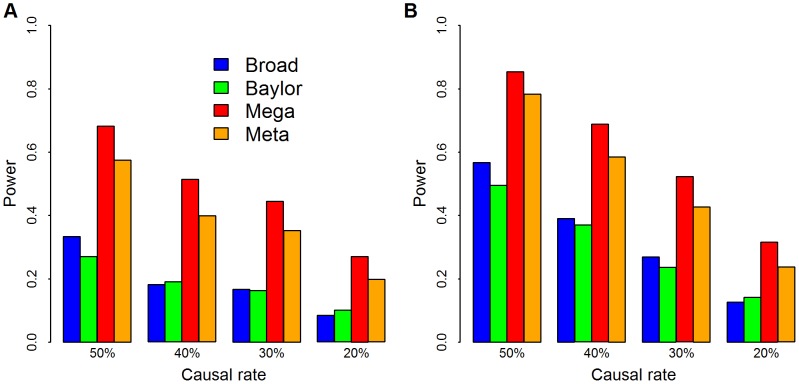
 . Causal rate is the fraction of variants with
  , which varied from
  20% to 50%. We choose weights
  and use SKAT to calculate the p-values for Baylor, Broad and merged data sets. We combine all singleton variants as a super-variant. For meta analysis, the weighted Z-score method combines the two p-values from Baylor and Broad for each gene. Panel (A)
  and the significance level is set at .001; in panel (B)
  and the significance level is set at .01.
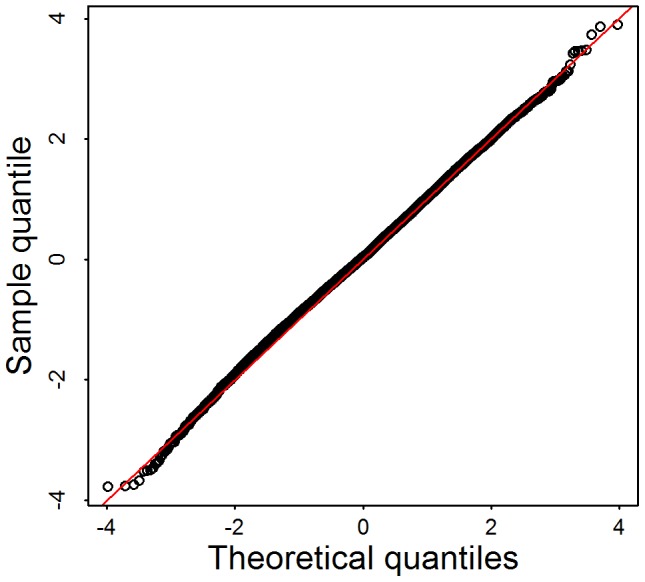
 rare variants,
  . For each gene, we first randomly assign the phenotypes for 913 samples based on a coin toss, then calculate the test statistics
  , and corresponding p-value computed under the assumption that
  . We repeat this 100 times per gene, to obtain more than 10,000 p-values.
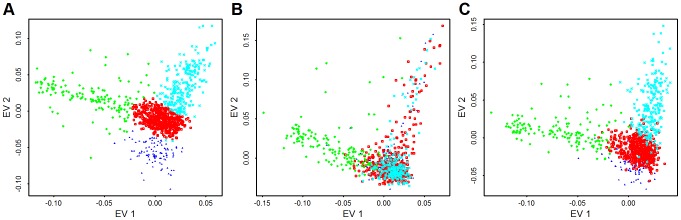
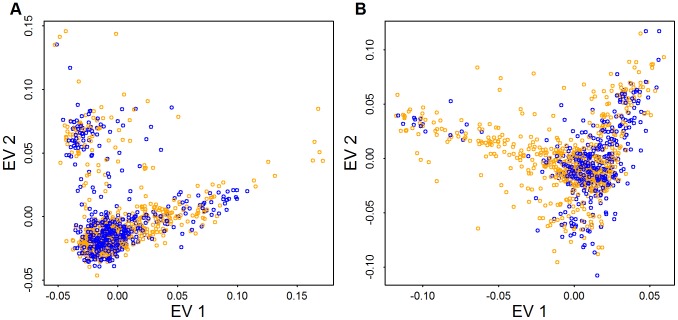
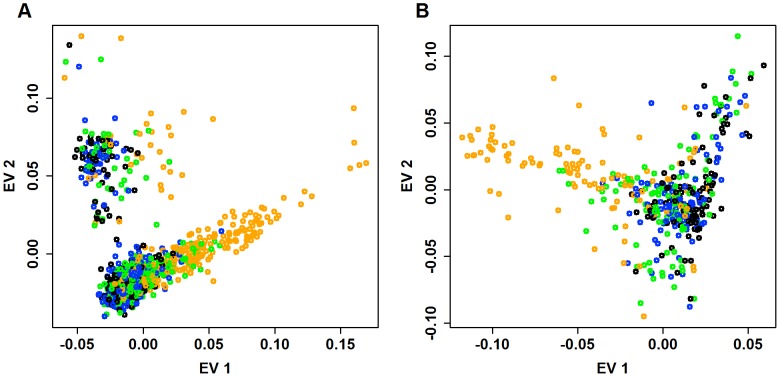
 : fewest doubletons), blue (next 25
 ), green (next 25
 ), and orange (top 25
 : most doubletons) within the Baylor and Broad samples, respectively.
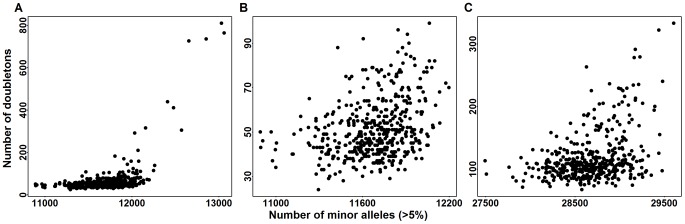
 . Panel (A) is the doubleton counts of Baylor cases versus MACs of CVs in the exome. Panel (B) is a zoomed in version of panel (A). Panel (C) is the doubleton counts of Broad cases versus MAC_c of CVs in the exome.
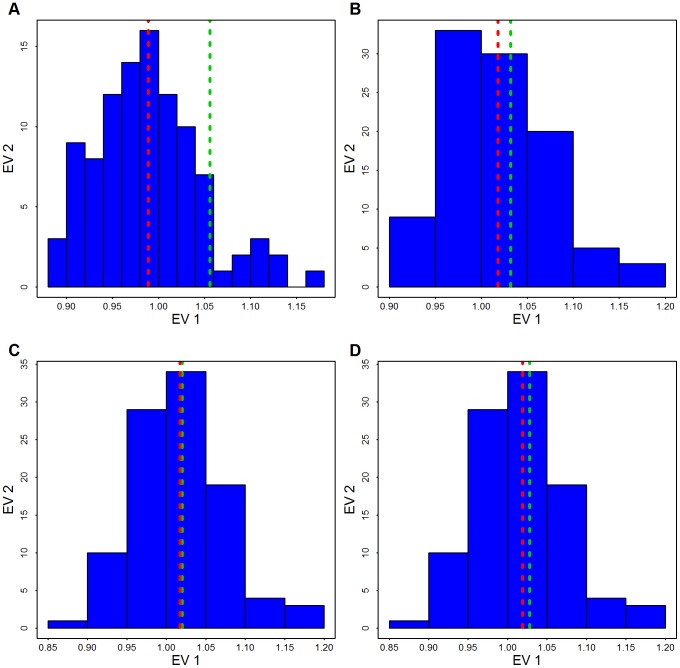
 is obtained based on the 1000 largest genes. The red line shows the mean of the permutation distribution and the green line shows
  obtained from the data using (A) Broad SKAT p-values obtained without eigen-vectors; (B) Broad SKAT p-values, with common variants (CVs) eigen-vectors, (C) Broad SKAT p-values, with low frequency variants (LFVs) eigen-vectors; and (D) Broad SKAT p-values, with CVs plus LFVs eigen-vectors.
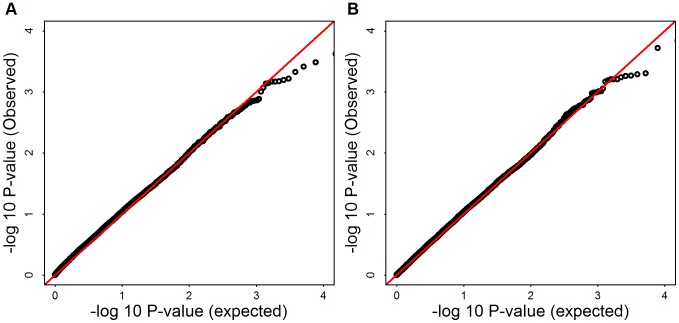
 and 1.047, for mega SKAT and burden test, respectively.
References
-
- Levy D, Ronemus M, Yamrom B, Lee Y, Leotta A, et al. (2011) Rare de novo and transmitted copy-number variation in autistic spectrum disorders. Neuron 70: 886–897. - PubMed
Publication types
MeSH terms
Grants and funding
- R01 MH089208/MH/NIMH NIH HHS/United States
- R37 MH057881/MH/NIMH NIH HHS/United States
- U54 HG003067/HG/NHGRI NIH HHS/United States
- R01 MH089004/MH/NIMH NIH HHS/United States
- R01 MH061009/MH/NIMH NIH HHS/United States
- P30 HD015052/HD/NICHD NIH HHS/United States
- U54 HG003273/HG/NHGRI NIH HHS/United States
- R01 MH057881/MH/NIMH NIH HHS/United States
- R01 MH089175/MH/NIMH NIH HHS/United States
- R01 MH094400/MH/NIMH NIH HHS/United States
- UL1 RR024975/RR/NCRR NIH HHS/United States
- R01 MH089482/MH/NIMH NIH HHS/United States
- P50 HD055751/HD/NICHD NIH HHS/United States
- R01 MH089025/MH/NIMH NIH HHS/United States
LinkOut - more resources
Full Text Sources
Other Literature Sources
Miscellaneous
