

Continent-wide decoupling of Y-chromosomal genetic variation from language and geography in native South Americans
- PMID: 23593040
- PMCID: PMC3623769
- DOI: 10.1371/journal.pgen.1003460
Continent-wide decoupling of Y-chromosomal genetic variation from language and geography in native South Americans
Abstract
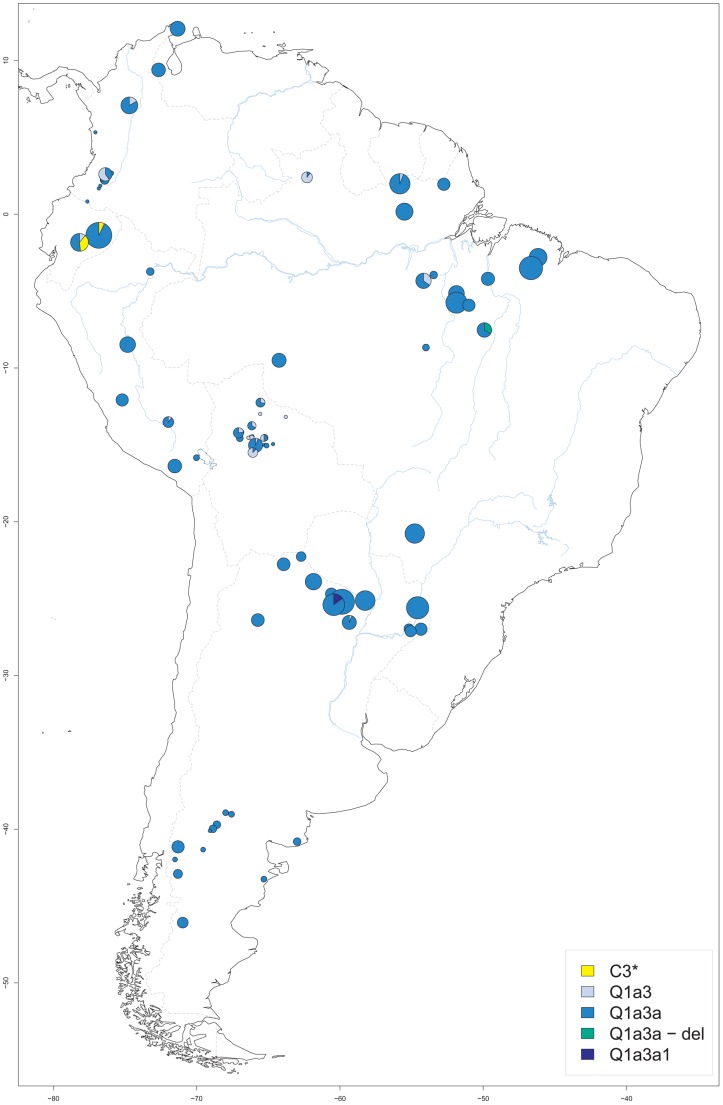
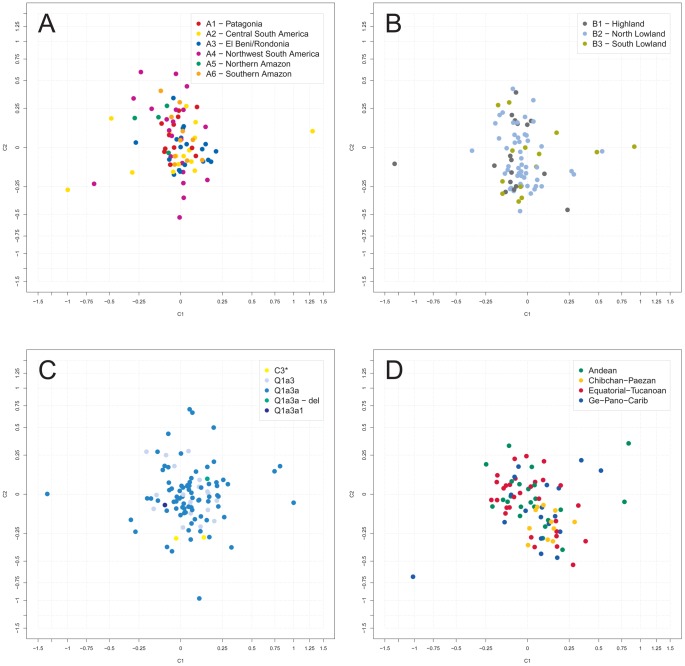
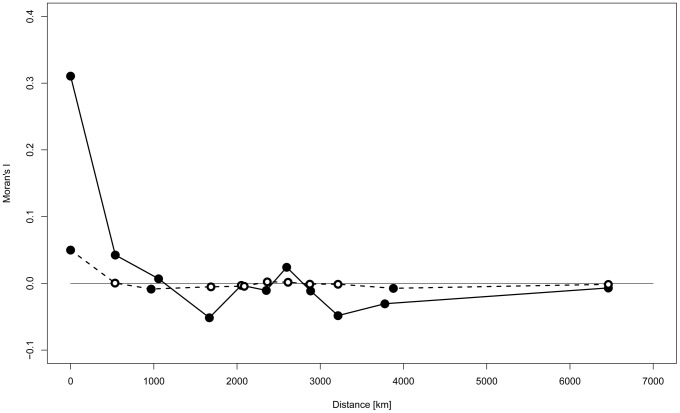
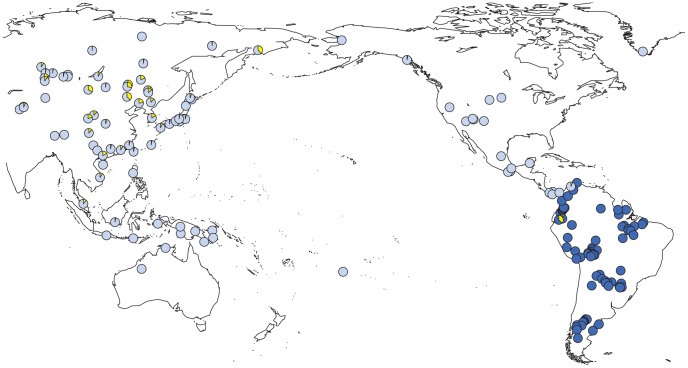
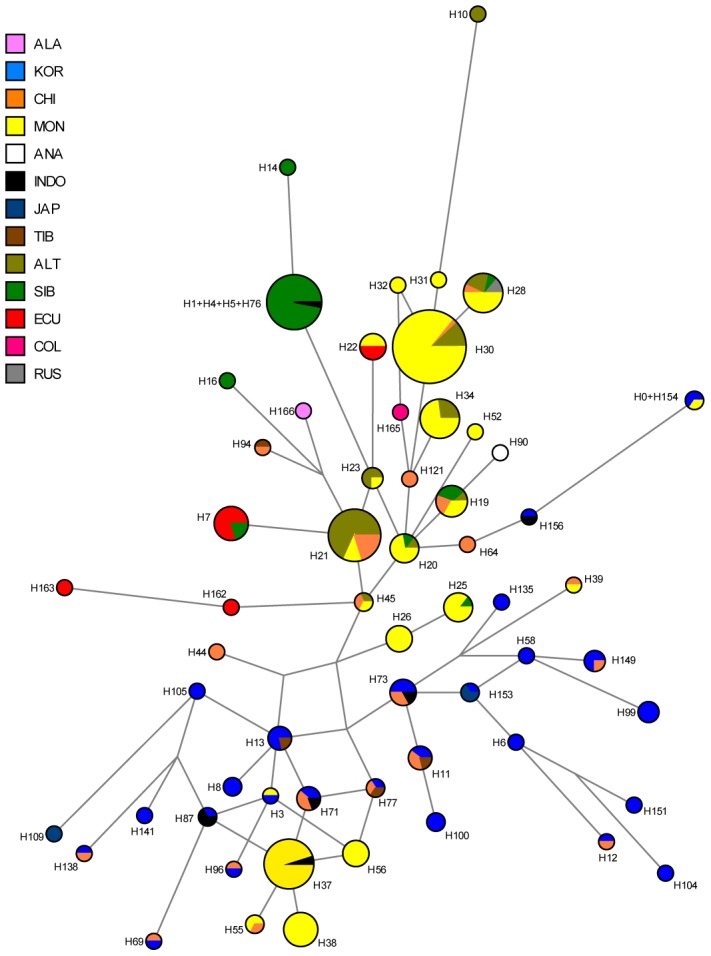
Numerous studies of human populations in Europe and Asia have revealed a concordance between their extant genetic structure and the prevailing regional pattern of geography and language. For native South Americans, however, such evidence has been lacking so far. Therefore, we examined the relationship between Y-chromosomal genotype on the one hand, and male geographic origin and linguistic affiliation on the other, in the largest study of South American natives to date in terms of sampled individuals and populations. A total of 1,011 individuals, representing 50 tribal populations from 81 settlements, were genotyped for up to 17 short tandem repeat (STR) markers and 16 single nucleotide polymorphisms (Y-SNPs), the latter resolving phylogenetic lineages Q and C. Virtually no structure became apparent for the extant Y-chromosomal genetic variation of South American males that could sensibly be related to their inter-tribal geographic and linguistic relationships. This continent-wide decoupling is consistent with a rapid peopling of the continent followed by long periods of isolation in small groups. Furthermore, for the first time, we identified a distinct geographical cluster of Y-SNP lineages C-M217 (C3*) in South America. Such haplotypes are virtually absent from North and Central America, but occur at high frequency in Asia. Together with the locally confined Y-STR autocorrelation observed in our study as a whole, the available data therefore suggest a late introduction of C3* into South America no more than 6,000 years ago, perhaps via coastal or trans-Pacific routes. Extensive simulations revealed that the observed lack of haplogroup C3* among extant North and Central American natives is only compatible with low levels of migration between the ancestor populations of C3* carriers and non-carriers. In summary, our data highlight the fact that a pronounced correlation between genetic and geographic/cultural structure can only be expected under very specific conditions, most of which are likely not to have been met by the ancestors of native South Americans.
Conflict of interest statement
The authors have declared that no competing interests exist.
Figures
Similar articles
-
High-resolution SNPs and microsatellite haplotypes point to a single, recent entry of Native American Y chromosomes into the Americas.Mol Biol Evol. 2004 Jan;21(1):164-75. doi: 10.1093/molbev/msh009. Epub 2003 Oct 31. Mol Biol Evol. 2004. PMID: 14595095
-
The first peopling of South America: new evidence from Y-chromosome haplogroup Q.PLoS One. 2013 Aug 21;8(8):e71390. doi: 10.1371/journal.pone.0071390. eCollection 2013. PLoS One. 2013. PMID: 23990949 Free PMC article.
-
Y-chromosome analysis reveals genetic divergence and new founding native lineages in Athapaskan- and Eskimoan-speaking populations.Proc Natl Acad Sci U S A. 2012 May 29;109(22):8471-6. doi: 10.1073/pnas.1118760109. Epub 2012 May 14. Proc Natl Acad Sci U S A. 2012. PMID: 22586127 Free PMC article.
-
Gm haplotype distribution in Amerindians: relationship with geography and language.Am J Phys Anthropol. 1993 Apr;90(4):427-44. doi: 10.1002/ajpa.1330900404. Am J Phys Anthropol. 1993. PMID: 7682769 Review.
-
Origin and evolutionary relationships of native Andean populations.High Alt Med Biol. 2001 Summer;2(2):227-33. doi: 10.1089/152702901750265323. High Alt Med Biol. 2001. PMID: 11443003 Review.
Cited by
-
Genomic insights on the ethno-history of the Maya and the 'Ladinos' from Guatemala.BMC Genomics. 2015 Feb 25;16(1):131. doi: 10.1186/s12864-015-1339-1. BMC Genomics. 2015. PMID: 25887241 Free PMC article.
-
Cultural Innovations Influence Patterns of Genetic Diversity in Northwestern Amazonia.Mol Biol Evol. 2018 Nov 1;35(11):2719-2735. doi: 10.1093/molbev/msy169. Mol Biol Evol. 2018. PMID: 30169717 Free PMC article.
-
Evaluating the X chromosome-specific diversity of Colombian populations using insertion/deletion polymorphisms.PLoS One. 2014 Jan 31;9(1):e87202. doi: 10.1371/journal.pone.0087202. eCollection 2014. PLoS One. 2014. PMID: 24498042 Free PMC article.
-
The Genetic History of Peruvian Quechua-Lamistas and Chankas: Uniparental DNA Patterns among Autochthonous Amazonian and Andean Populations.Ann Hum Genet. 2016 Mar;80(2):88-101. doi: 10.1111/ahg.12145. Epub 2016 Feb 16. Ann Hum Genet. 2016. PMID: 26879156 Free PMC article.
-
Peopling of the North Circumpolar Region--insights from Y chromosome STR and SNP typing of Greenlanders.PLoS One. 2015 Jan 30;10(1):e0116573. doi: 10.1371/journal.pone.0116573. eCollection 2015. PLoS One. 2015. PMID: 25635810 Free PMC article.
References
-
- Comas D, Bosch E, Calafell F (2008) Human genetics and languages. Chichester: Wiley.
-
- Jobling MA, Hurles ME, Tyler-Smith C (2004) Human Evolutionary Genetics: Origins, Peoples and Disease: Garland Publishing.
-
- Lao O, Lu TT, Nothnagel M, Junge O, Freitag-Wolf S, et al. (2008) Correlation between genetic and geographic structure in Europe. Current biology : CB 18: 1241–1248. - PubMed
Publication types
MeSH terms
LinkOut - more resources
Full Text Sources
Other Literature Sources
Miscellaneous
