

Quantitative PCR method for enumeration of cells of cryptic species of the toxic marine dinoflagellate Ostreopsis spp. in coastal waters of Japan
- PMID: 23593102
- PMCID: PMC3596365
- DOI: 10.1371/journal.pone.0057627
Quantitative PCR method for enumeration of cells of cryptic species of the toxic marine dinoflagellate Ostreopsis spp. in coastal waters of Japan
Abstract
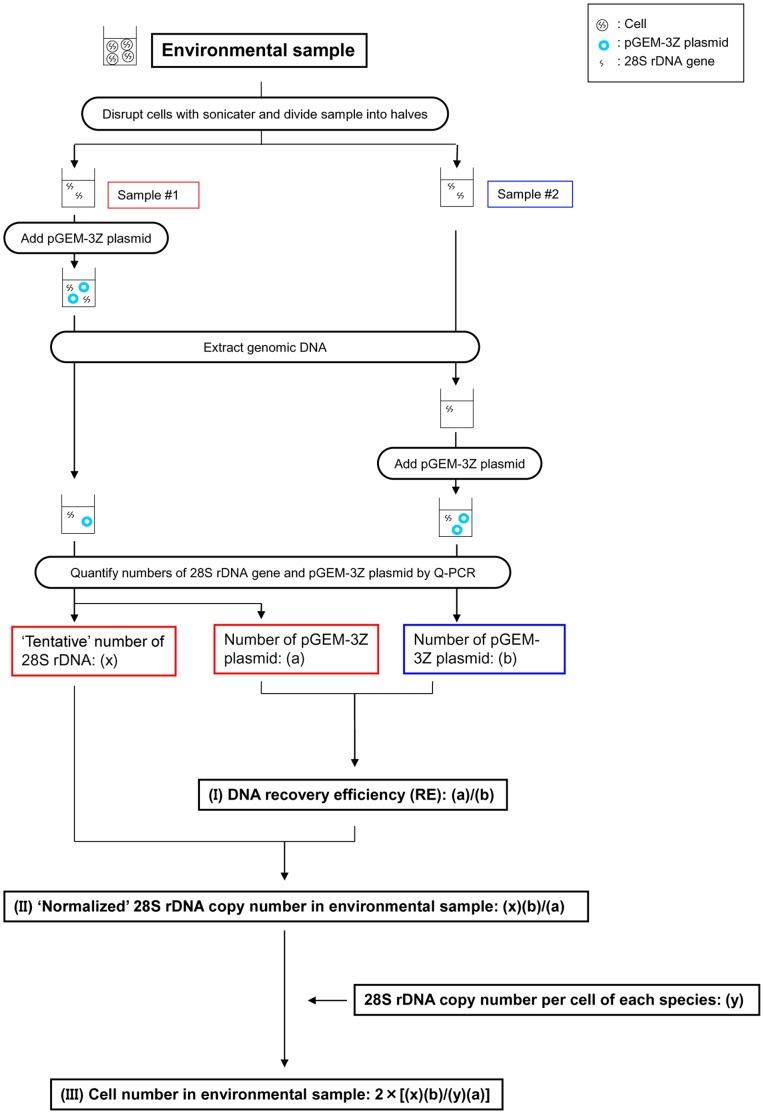
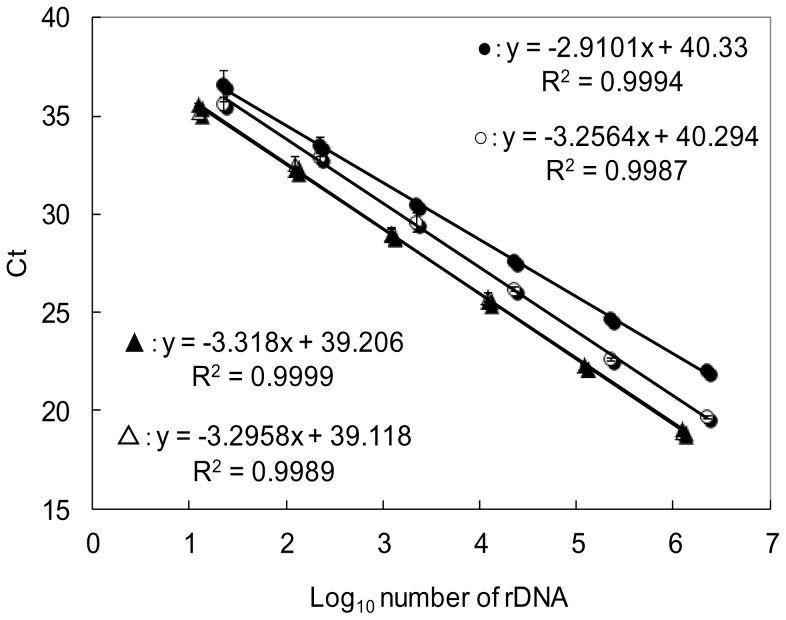
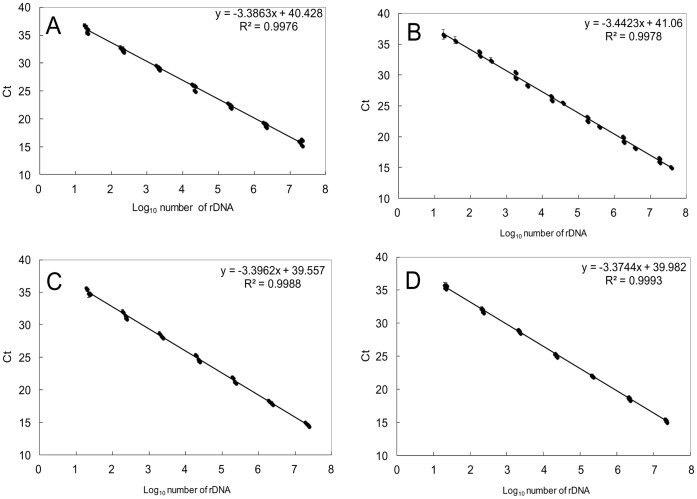
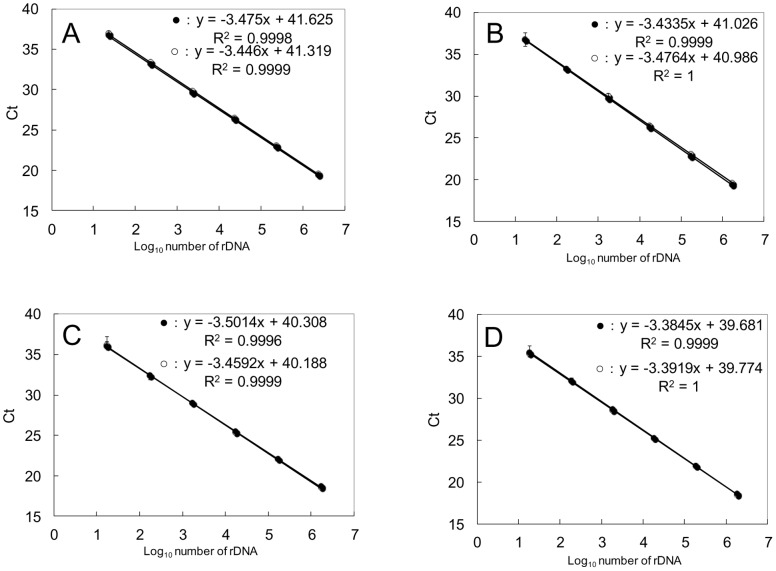
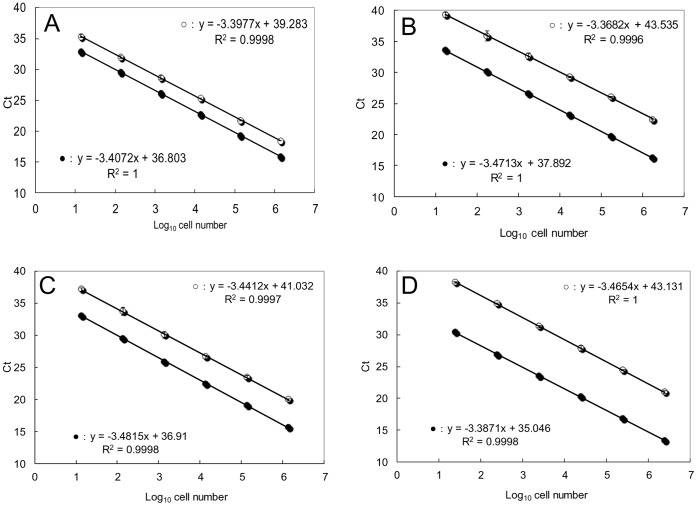
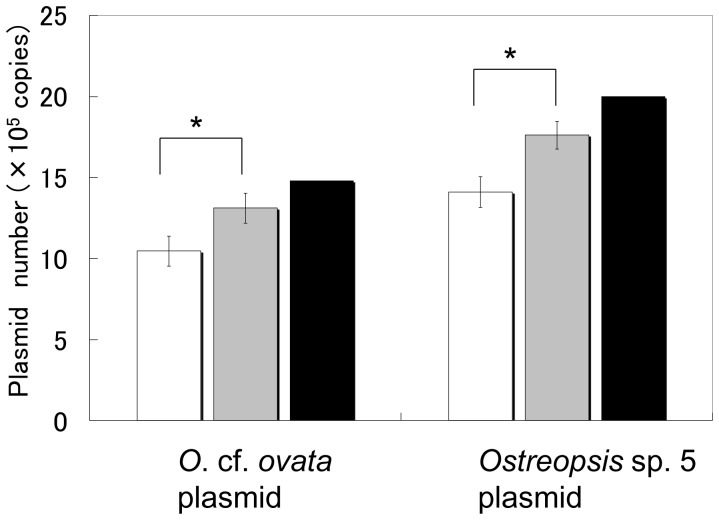
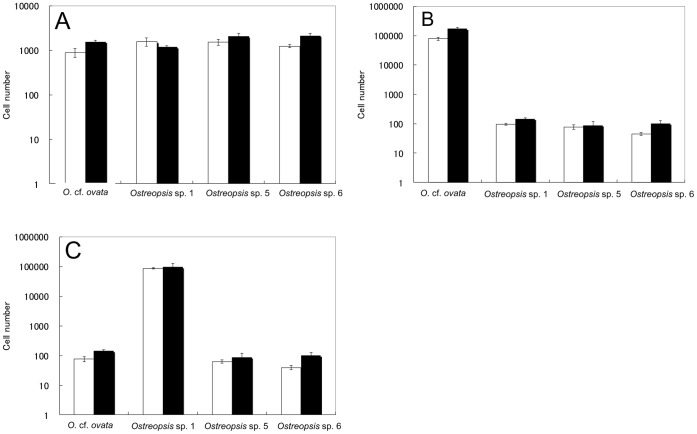
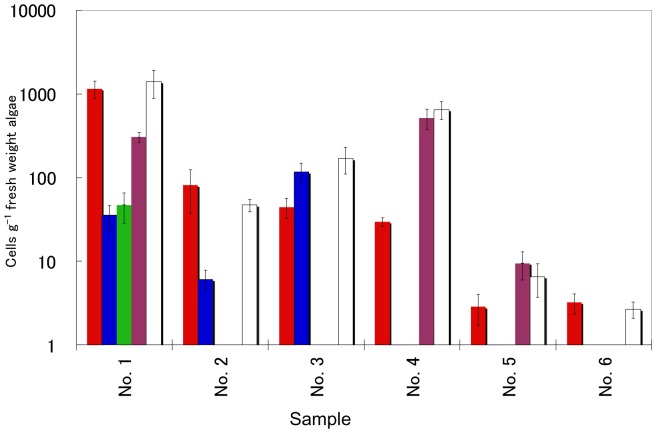
Monitoring of harmful algal bloom (HAB) species in coastal waters is important for assessment of environmental impacts associated with HABs. Co-occurrence of multiple cryptic species such as toxic dinoflagellate Ostreopsis species make reliable microscopic identification difficult, so the employment of molecular tools is often necessary. Here we developed new qPCR method by which cells of cryptic species can be enumerated based on actual gene number of target species. The qPCR assay targets the LSU rDNA of Ostreopsis spp. from Japan. First, we constructed standard curves with a linearized plasmid containing the target rDNA. We then determined the number of rDNA copies per cell of target species from a single cell isolated from environmental samples using the qPCR assay. Differences in the DNA recovery efficiency was calculated by adding exogenous plasmid to a portion of the sample lysate before and after DNA extraction followed by qPCR. Then, the number of cells of each species was calculated by division of the total number of rDNA copies of each species in the samples by the number of rDNA copies per cell. To test our procedure, we determined the total number of rDNA copies using environmental samples containing no target cells but spiked with cultured cells of several species of Ostreopsis. The numbers estimated by the qPCR method closely approximated total numbers of cells added. Finally, the numbers of cells of target species in environmental samples containing cryptic species were enumerated by the qPCR method and the total numbers also closely approximated the microscopy cell counts. We developed a qPCR method that provides accurate enumeration of each cryptic species in environments. This method is expected to be a powerful tool for monitoring the various HAB species that occur as cryptic species in coastal waters.
Conflict of interest statement
Figures
Similar articles
-
Quantitative PCR assay for detection and enumeration of ciguatera-causing dinoflagellate Gambierdiscus spp. (Gonyaulacales) in coastal areas of Japan.Harmful Algae. 2016 Feb;52:11-22. doi: 10.1016/j.hal.2015.11.018. Epub 2015 Dec 28. Harmful Algae. 2016. PMID: 28073467
-
Monitoring toxic Ostreopsis cf. ovata in recreational waters using a qPCR based assay.Mar Pollut Bull. 2014 Nov 15;88(1-2):102-9. doi: 10.1016/j.marpolbul.2014.09.018. Epub 2014 Oct 1. Mar Pollut Bull. 2014. PMID: 25282181
-
Culture-Independent Study of the Late-Stage of a Bloom of the Toxic Dinoflagellate Ostreopsis cf. ovata: Preliminary Findings Suggest Genetic Differences at the Sub-Species Level and Allow ITS2 Structure Characterization.Toxins (Basel). 2015 Jun 30;7(7):2514-33. doi: 10.3390/toxins7072514. Toxins (Basel). 2015. PMID: 26134259 Free PMC article.
-
Toxic marine microalgae and noxious blooms in the Mediterranean Sea: A contribution to the Global HAB Status Report.Harmful Algae. 2021 Feb;102:101843. doi: 10.1016/j.hal.2020.101843. Epub 2020 Jun 12. Harmful Algae. 2021. PMID: 33875177 Review.
-
Algal blooms historical outbreaks in the northern coastal waters of the Persian Gulf and Oman Sea (1980-2015).Environ Monit Assess. 2021 Sep 14;193(10):648. doi: 10.1007/s10661-021-09413-3. Environ Monit Assess. 2021. PMID: 34523030 Review.
Cited by
-
High Specificity of a Quantitative PCR Assay Targeting a Saxitoxin Gene for Monitoring Toxic Algae Associated with Paralytic Shellfish Toxins in the Yellow Sea.Appl Environ Microbiol. 2015 Oct;81(20):6973-81. doi: 10.1128/AEM.00417-15. Epub 2015 Jul 31. Appl Environ Microbiol. 2015. PMID: 26231652 Free PMC article.
-
Massive Occurrence of the Harmful Benthic Dinoflagellate Ostreopsis cf. ovata in the Eastern Adriatic Sea.Toxins (Basel). 2019 May 25;11(5):300. doi: 10.3390/toxins11050300. Toxins (Basel). 2019. PMID: 31130661 Free PMC article.
-
A comparison of two gene regions for assessing community composition of eukaryotic marine microalgae from coastal ecosystems.Sci Rep. 2024 Mar 18;14(1):6442. doi: 10.1038/s41598-024-56993-4. Sci Rep. 2024. PMID: 38499675 Free PMC article.
-
Development of a species-specific TaqMan-MGB real-time PCR assay to quantify Olsenella scatoligenes in pigs offered a chicory root-based diet.AMB Express. 2018 Jun 16;8(1):99. doi: 10.1186/s13568-018-0627-y. AMB Express. 2018. PMID: 29909539 Free PMC article.
-
Development of a quantitative PCR assay for the detection and enumeration of a potentially ciguatoxin-producing dinoflagellate, Gambierdiscus lapillus (Gonyaulacales, Dinophyceae).PLoS One. 2019 Nov 15;14(11):e0224664. doi: 10.1371/journal.pone.0224664. eCollection 2019. PLoS One. 2019. PMID: 31730656 Free PMC article.
References
-
- Hallegraeff GM (1993) A review of harmful algal blooms and their apparent global increase. Phycologia 32: 79–99.
-
- Hoagland P, Anderson DM, Kaoru Y, White AW (2002) The economic effects of harmful algal blooms in the United States: Estimates, assessment issues, and information needs. Estuaries 25: 819–837.
-
- Heid CA, Stevens J, Livak KJ, Williams PM (1996) Real time quantitative PCR. Genome Res 6: 986–994. - PubMed
Publication types
MeSH terms
Substances
LinkOut - more resources
Full Text Sources
Other Literature Sources
Research Materials
Miscellaneous
