

p38 MAPK regulates cavitation and tight junction function in the mouse blastocyst
- PMID: 23593143
- PMCID: PMC3617173
- DOI: 10.1371/journal.pone.0059528
p38 MAPK regulates cavitation and tight junction function in the mouse blastocyst
Abstract
Blastocyst formation is essential for implantation and maintenance of pregnancy and is dependent on the expression and coordinated function of a series of proteins involved in establishing and maintaining the trans-trophectoderm ion gradient that enables blastocyst expansion. These consist of Na/K-ATPase, adherens junctions, tight junctions (TJ) and aquaporins (AQP). While their role in supporting blastocyst formation is established, the intracellular signaling pathways that coordinate their function is unclear. The p38 MAPK pathway plays a role in regulating these proteins in other cell types and is required for embryo development at the 8-16 cell stage, but its role has not been investigated in the blastocyst.
Hypothesis: p38 MAPK regulates blastocyst formation by regulating blastocyst formation gene expression and function.
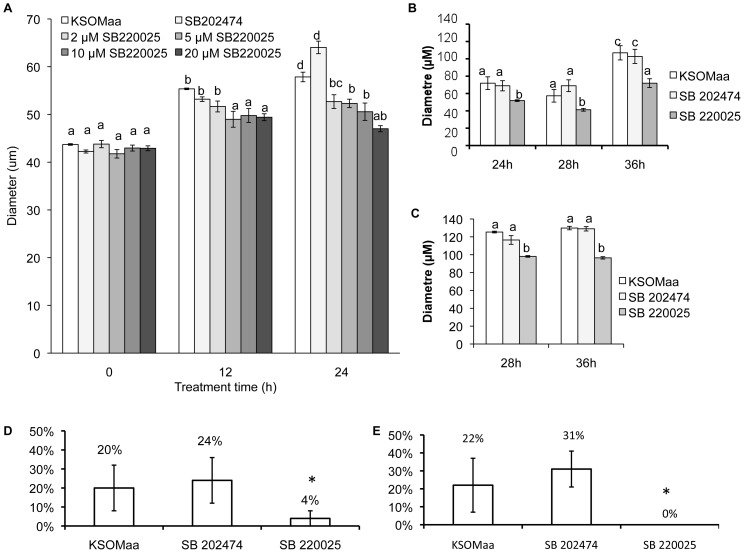
Methods: Embryos were cultured from the early blastocyst stage for 12 h or 24 h in the presence of a potent and specific p38 MAPK inhibitor, SB 220025. Blastocyst expansion, hatching, gene family expression and localization, TJ function and apoptosis levels were analyzed.
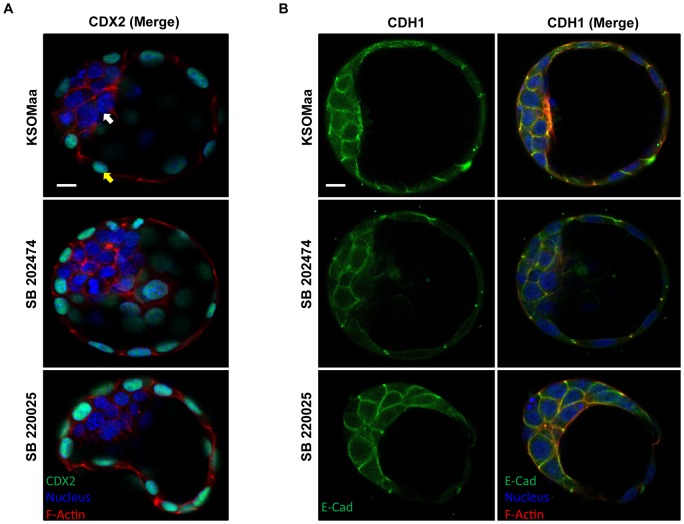
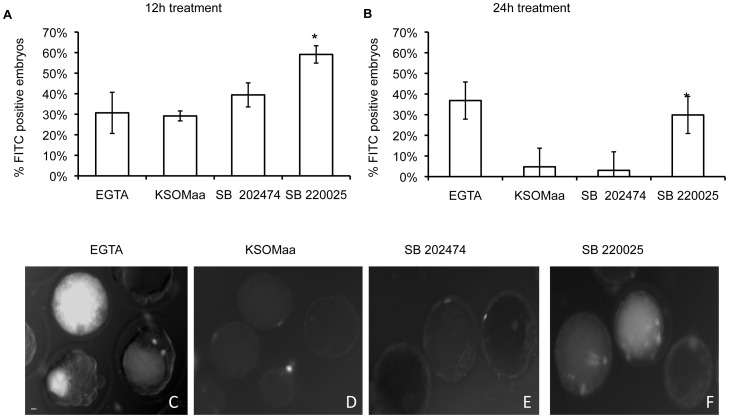
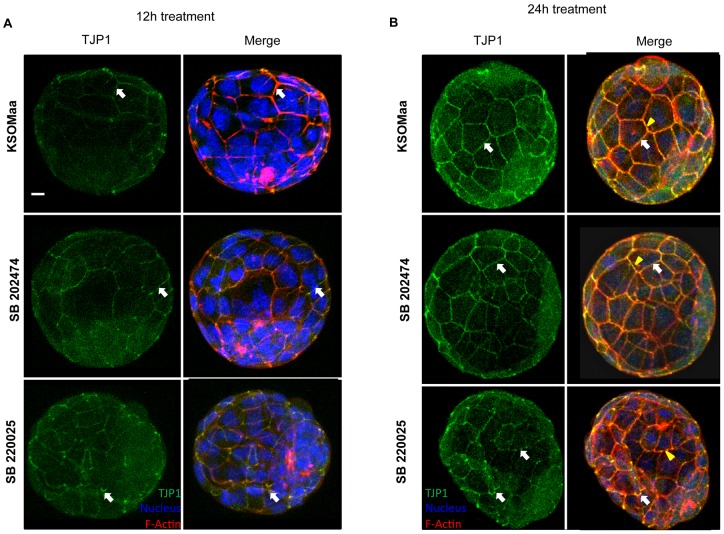
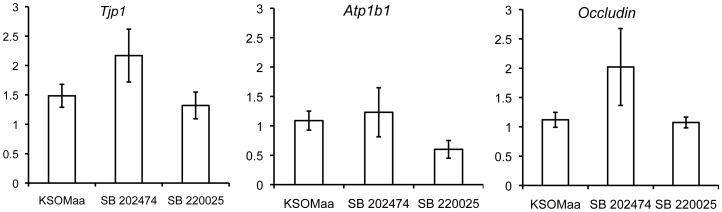
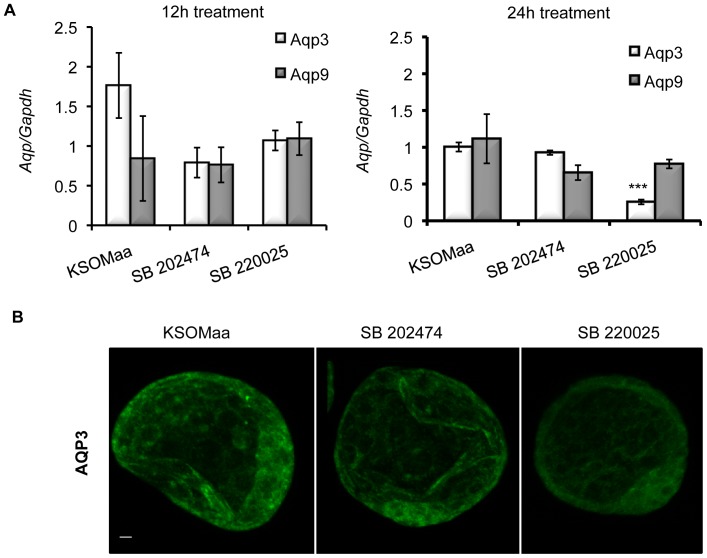
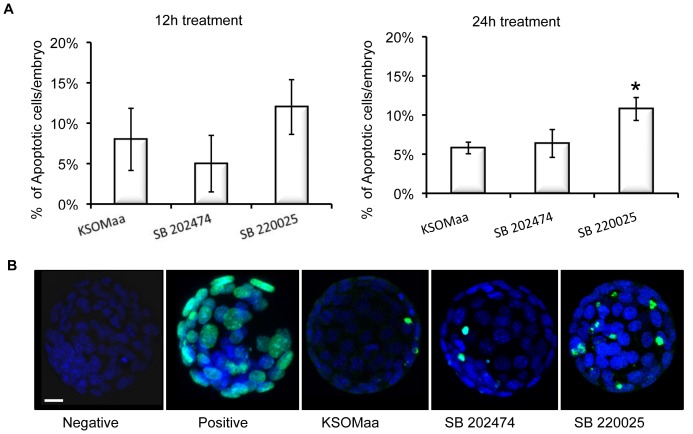
Results: Inhibition of the p38 MAPK pathway reduced blastocyst expansion and hatching, increased tight junction permeability, affected TJP1 localization, reduced Aqp3 expression, and induced a significant increase in apoptosis.
Conclusion: The p38 MAPK pathway coordinates the overall events that regulate blastocyst formation.
Conflict of interest statement
Figures
Similar articles
-
p38 mitogen-activated protein kinase (MAPK) first regulates filamentous actin at the 8-16-cell stage during preimplantation development.Biol Cell. 2005 Aug;97(8):629-40. doi: 10.1042/BC20040146. Biol Cell. 2005. PMID: 15850458
-
Attenuated expression of the tight junction proteins is involved in clopidogrel-induced gastric injury through p38 MAPK activation.Toxicology. 2013 Feb 8;304:41-8. doi: 10.1016/j.tox.2012.11.020. Epub 2012 Dec 7. Toxicology. 2013. PMID: 23220562
-
Ouabain stimulates a Na+/K+-ATPase-mediated SFK-activated signalling pathway that regulates tight junction function in the mouse blastocyst.PLoS One. 2011;6(8):e23704. doi: 10.1371/journal.pone.0023704. Epub 2011 Aug 25. PLoS One. 2011. PMID: 21901128 Free PMC article.
-
Regulation of blastocyst formation.Front Biosci. 2001 May 1;6:D708-30. doi: 10.2741/watson. Front Biosci. 2001. PMID: 11333210 Review.
-
Molecular regulation of blastocyst formation.Anim Reprod Sci. 2004 Jul;82-83:583-92. doi: 10.1016/j.anireprosci.2004.04.004. Anim Reprod Sci. 2004. PMID: 15271481 Review.
Cited by
-
DDX21 is a p38-MAPK-sensitive nucleolar protein necessary for mouse preimplantation embryo development and cell-fate specification.Open Biol. 2021 Jul;11(7):210092. doi: 10.1098/rsob.210092. Epub 2021 Jul 14. Open Biol. 2021. PMID: 34255976 Free PMC article.
-
c-Abl Plays an Important Role in Mouse Preimplantation Embryo Development and the Dysregulation Associated With Decreased mTERT Expression.Mol Reprod Dev. 2025 Jun;92(6):e70039. doi: 10.1002/mrd.70039. Mol Reprod Dev. 2025. PMID: 40528788 Free PMC article.
-
Stabilization of F-Actin Cytoskeleton by Paclitaxel Improves the Blastocyst Developmental Competence through P38 MAPK Activity in Porcine Embryos.Biomedicines. 2022 Aug 2;10(8):1867. doi: 10.3390/biomedicines10081867. Biomedicines. 2022. PMID: 36009414 Free PMC article.
-
Nucleus, Cytoskeleton, and Mitogen-Activated Protein Kinase p38 Dynamics during In Vitro Maturation of Porcine Oocytes.Animals (Basel). 2019 Apr 13;9(4):163. doi: 10.3390/ani9040163. Animals (Basel). 2019. PMID: 31013909 Free PMC article.
-
Adiponectin stimulates lipid metabolism via AMPK in rabbit blastocysts.Hum Reprod. 2017 Jul 1;32(7):1382-1392. doi: 10.1093/humrep/dex087. Hum Reprod. 2017. PMID: 28472298 Free PMC article.
References
-
- Watson AJ, Natale DR, Barcroft LC (2004) Molecular regulation of blastocyst formation. Anim Reprod Sci 82–83: 583–592. - PubMed
-
- Strumpf D, Mao CA, Yamanaka Y, Ralston A, Chawengsaksophak K, et al. (2005) Cdx2 is required for correct cell fate specification and differentiation of trophectoderm in the mouse blastocyst. Development 132(9): 2093–2102. - PubMed
-
- McLaren A, Smith R (1977) Functional test of tight junctions in the mouse blastocyst. Nature 267(5609): 351–353. - PubMed
Publication types
MeSH terms
Substances
Grants and funding
LinkOut - more resources
Full Text Sources
Other Literature Sources
Molecular Biology Databases
