. 2013 Apr 12;8(4):e59883.
doi: 10.1371/journal.pone.0059883. Print 2013.

Adaptation of mycobacteria to growth conditions: a theoretical analysis of changes in gene expression revealed by microarrays

Affiliations

Adaptation of mycobacteria to growth conditions: a theoretical analysis of changes in gene expression revealed by microarrays

Robert Ashley Cox et al. PLoS One. .

Abstract

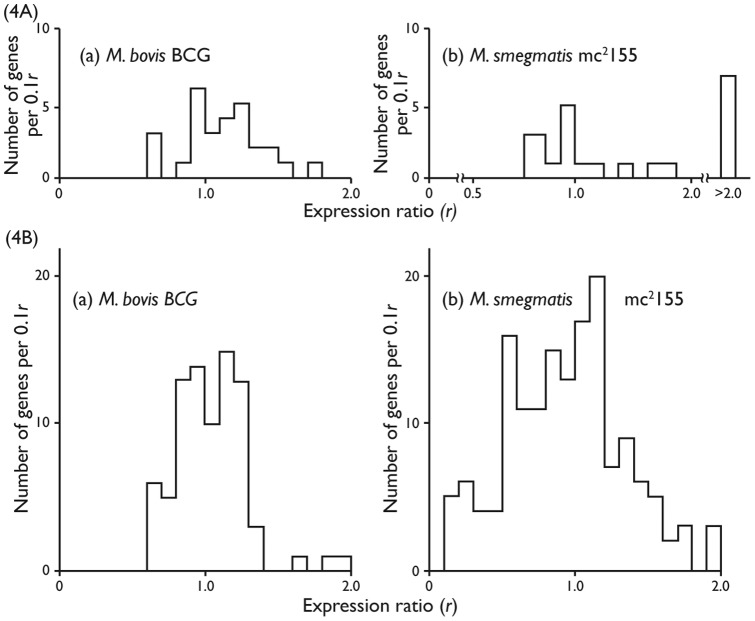
Background: Microarray analysis is a powerful technique for investigating changes in gene expression. Currently, results (r-values) are interpreted empirically as either unchanged or up- or down-regulated. We now present a mathematical framework, which relates r-values to the macromolecular properties of population-average cells. The theory is illustrated by the analysis of published data for two species; namely, Mycobacterium bovis BCG Pasteur and Mycobacterium smegmatis mc(2) 155. Each species was grown in a chemostat at two different growth rates. Application of the theory reveals the growth rate dependent changes in the mycobacterial proteomes.

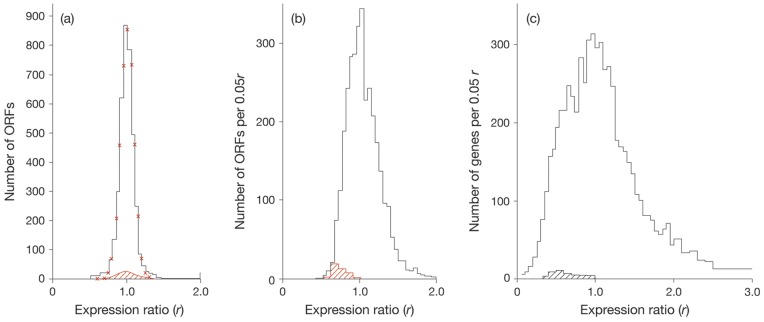
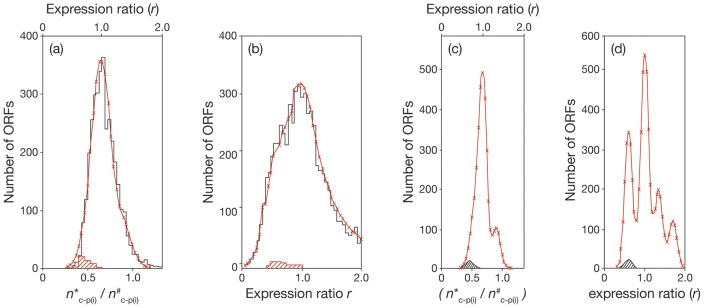
Principal findings: The r-value r (i) of any ORF (ORF(i)) encoding protein p (i) was shown to be equal to the ratio of the concentrations of p (i) and so directly proportional to the ratio of the numbers of copies of p (i) per population-average cells of the two cultures. The proportionality constant can be obtained from the ratios DNA: RNA: protein. Several subgroups of ORFs were identified because they shared a particular r-value. Histograms of the number of ORFs versus the expression ratio were simulated by combining the particular r-values of several subgroups of ORFs. The largest subgroup was ORF(j) (r (j) = 1.00± SD) which was estimated to comprise respectively 59% and 49% of ORFs of M. bovis BCG Pasteur and M. smegmatis mc(2) 155. The standard deviations reflect the properties of the cDNA preparations investigated.

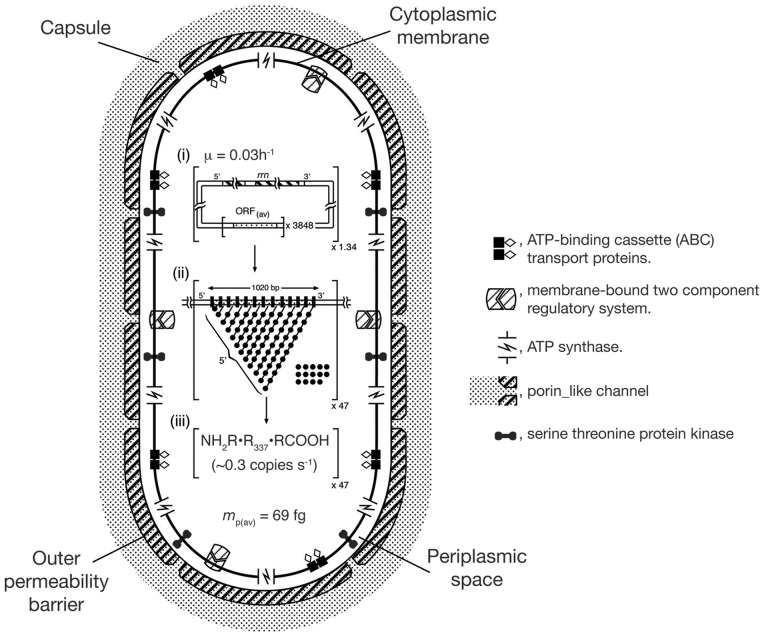
Significance: The analysis provided a quantitative view of growth rate dependent changes in the proteomes of the mycobacteria studied. The majority of the ORFs were found to be constitutively expressed. In contrast, the protein compositions of the outer permeability barriers and cytoplasmic membranes were found to be dependent on growth rate; thus illustrating the response of bacteria to their environment. The theoretical approach applies to any cultivatable bacterium under a wide range of growth conditions.


Conflict of interest statement

Competing Interests: The authors have declared that no competing interest exist.

Figures

Figure 1
Figure 1. Histograms of expression ratios reported for M.tuberculosis, BCG-Pasteur and Msmeg.
(a) Profile of expression ratios reported for M.tuberculosis grown in rolling bottles. The wild type (the reference culture) was compared with a dosR minus mutant (the experimental culture). Both cultures were found to grow at the same rate (a doubling time of about 17 h). The profile represents 3850 ORFs. The red crosses mark the Gaussian distribution calculated for 3850 expression ratios of r = 1.0±0.09. (b) Profile of expression ratios reported for cultures of BCG-Pasteur grown in a chemostat at growth rates of µ =  0.01 h−1 (the experimental culture) and µ = 0.03 h−1 (the reference culture). A total of 3475 expression ratios were reported ; the average value was found to be r = 1.05±0.33. (c) Profile of expression ratios reported for cultures of Msmeg grown in a chemostat at growth rates of µ = 0.01 h−1 (the experimental culture) and µ = 0.15 h−1 (the reference culture). The complete profile comprised 6864 ORFs . In all (a), (b) and (c) the hatched regions refer to 50 ORFs encoding for Zur-independent ribosomal proteins.
Figure 2
Figure 2. Comparisons of observed and simulated profiles of expression ratios reported for BCG-Pasteur and Msmeg.
The experimental results are shown in black and the simulated profiles in red with crosses marking calculated values. (a) BCG-Pasteur. The calculations for the simulated profile were based on the assumption that the expression ratios of each of the proposed subgroups of ORFs conform to a normal Gaussian distribution with a standard deviation of ±0.15. The dominant subgroup (ORF(j) r (j)  = 1.0±0.15) comprised 2350 constitutively expressed genes. The second subgroup (ORF(k)) comprised 100 ORFs (r (k)  = 0.70±0.15). The third subgroup (ORF(l)) comprised 500 ORFs (r (l)  = 0.80±0.15). The fourth subgroup (ORF(m)) comprised 500 ORFs (r (m)  = 1.45±0.15). Thus 3450 genes were considered. The average expression ratio was found to be r = 1.02 per ORF. The distribution of ORFs according to the relative number (n*c–p(i)/n # c–p(i)) of copies of protein p (i) in experimental and reference cultures was shown. (b) Msmeg. The simulated profile was calculated for 6180 ORFs in the range r = 0.0–2.0 comprising five subgroups conforming to a normal Gaussian distribution, each with standard deviation of ±0.20. The compositions of the subgroups were as follows: 2750 constitutively expressed ORFs (r (j)  = 1.0±0.20); 1750 ORFs (r (a)  = 0.60±0.20), which includes ORFs of the subgroup ORF(k) (r (k)  = 0.60±0.20); 1000 ORFs (r (b)  = 1.35±0.20); 600 ORFs (r (c)  = 1.70±0.20) and 350 ORFs (r (d)  = 2.30±0.20). In all, 6450 ORFs were considered. (c) Refined simulated expression profiles for BCG-Pasteur. (d) Refined simulated expression profiles for Msmeg. The simulated profiles shown in (a) and (b) were recalculated in (c) and (d) by changing the standard deviations to ±0.1.
Figure 3
Figure 3. The relation of the ratios of the specific growth rates (µ′/µ′′) to the ratios of the peptide chain elongation rates (εaa(k)/ε′′aa(k)) of ribosomal proteins.
Values of (εaa(k)/ε′′aa(k)) were evaluated using equation (9), Table 2. The plot is linear when µ′>µ′′ (see equation (11b), Table 2). The reference point (µ′/µ′′)  =  (εaa(k)/ε ′′aa(k))  = 1.0 is shown as a square; the open circles refer to BCG-Pasteur and Msmeg; the filled circle refers to E. coli B/r (see Table 3, [19]). The broken line applies when µ′< µ′′.
Figure 4
Figure 4. Effects of growth rate on the expressions of ORFs encoding proteins involved in the bacterial outer permeability barrier.
(A) Two Component systems proteins of the BCG-Pasteur (a) and Msmeg (b). (B) ATP binding casette proteins of BCG-Pasteur (a) and Msmeg (b).
Figure 5
Figure 5. A schematic view of a population-average cell of BCG-Pasteur (t d  = 23 h) illustrating features important on growth including transcription/translation activities.
The cell is represented as a cylinder with hemispherical ends (axial ratio of 1:2). Transcription/translation activities are based on µ = 0.03 h−1, nR(av)  = 3730 ribosomes and mp(av)  = 69 fg protein per population-average cell (see Table 4). Porins are shown as Y-shaped channels traversing the outer membrane permeability barrier. (i). Summary of genomic properties per population-average cell (see Tables 3 and 4). The properties of the genome; namely the number of rrn operons (solid bars) and the number of ‘average’ ORFs are (stippled bars) presented within the square brackets. The number of genome equivalents is indicated outside the brackets on the lower right hand side. (ii)Transcription/translation activity of an ‘average’ ORF is represented schematically within the square brackets in the form of a fibril diagram. The size (bp) of an ‘average’ ORF is shown and also the locations of the 5′-ends of nascent mRNA transcripts. Nascent polypeptide chains are not shown. The proportion of non-programmed ribosomes per ORF is indicated by the relative number of free ribosomes. The number of ‘average’ ORFs being transcribed/ translated at any instant is shown by the number outside the square brackets on the lower right hand side; vertical. Black bars along the ORF represent RNAP holoenzymes; filled circles represent ribosomes; and the lines joining these circles represent nascent mRNA. (iii)Rate of synthesis of ‘average’ proteins. The rate of synthesis per fibril is indicated within the square brackets. The number of fibrils synthesizing protein is given outside the square brackets on the lower right-hand side. The product of the two numbers provides the specific protein synthesis rate (amino acid residues h−1). Sections (i), (ii) and (iii) are based on Cox .

Similar articles

Cited by

References

    1. Kendall SL, Rison SC, Movahedzadeh F, Frita R, Stoker NG (2004a) What do microarrays really tell us about Mycobacterium tuberculosis?. Trends Microbiol 12: 537–544. - PubMed
    1. Blattner FR, Plunkett G III, Bloch CA, Perna NT, Burland V, et al. (1997) The complete genome sequence of Escherichia coli K-12. Science 277: 1453–1474. - PubMed
    1. Southern EM (2001) DNA microarrays. History and overview Methods Mol Biol. 170: 1–15. - PubMed
    1. Cole ST, Brosch R, Parkhill J, Garnier T, Churcher C, et al. (1998) Deciphering the biology of Mycobacterium tuberculosis from the complete genome sequence. Nature 393: 537–544. - PubMed
    1. Cole ST, Eiglmeier K, Parkhill J, James KD, Thomson NR, et al. (2001) Massive gene decay in the leprosy bacillus. Nature 409: 1007–1011. - PubMed

MeSH terms